
Time-of-Arrival (TOA) Difference
This is the difference in arrival time of a sound at the two ears of the listener. It is probably the most important single factor in determining the direction of a sound. It is zero for sounds arriving from directly in front of the listener and is a maximum of about 0.6 ms (depending on the size of the head) for sounds arriving at 90° to the frontal axis. In general the TOA difference is proportional to sin θ in Figure 48.
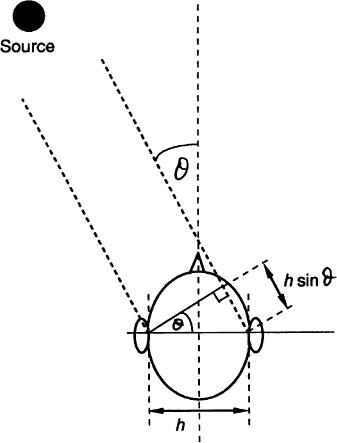
Figure 48 Time of arrival difference, t is given by t = h sin θ/c where c is the velocity of sound in air
Pure tones are generally very difficult, or even impossible, to locate and there needs to be a low frequency component. This may take the form of a modulation of an otherwise steady tone.
The Haas Effect
If the same sound is emitted by two sources, as would occur for example if a mono signal were fed into two similar loudspeakers, the brain appears to fuse together the two signals provided that the time difference between them is less than about 50 ms. There is a perceptible time interval if the difference is greater than about 50 ms.
With differences less than 50 ms not only do the two sources appear as one but the apparent single source tends to be towards origination of the first arrival. For the delayed source to seem as loud as the undelayed one it must be higher in level by an amount which depends on the time delay. The relationship is shown in Figure 49.
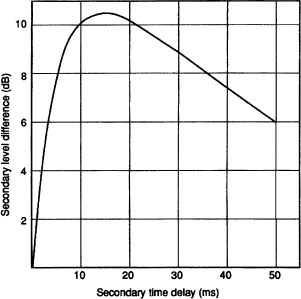
Figure 49 The ‘Haas effect’ curve relating time delay and level difference for two sound sources to appear to have the same loudness
Sound Image Positions with Two Loudspeakers
TOA differences, while very important in real-life location of sounds, do not apply in the case of stereo reproduction from two loudspeakers. It can be shown that sound image position depends upon the ‘inter-channel difference’, i.e. the number of dBs difference in level between the left and right signals. The relationship is shown in Figure 50.
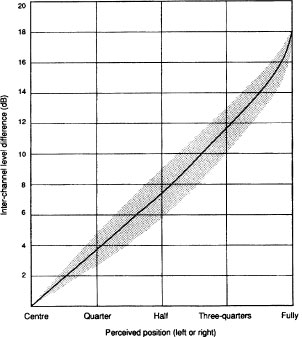
Figure 50 Relationship between interchannel difference and image position
Figure 50 was originally produced from speech sources but it appears to be applicable to other kinds of sound. The shaded area indicates the disagreement which can occur between different listeners. Interestingly, if the signals to the loudspeakers are changed over, so that what was the left signal is fed to the right speaker, and the right signal is fed to the left speaker, for many listeners the shape of the curve is different. That is, it is not a mirror image of the original.
|
Channel |
|
Application |
Left |
Right |
Designation in domestic equipment |
L |
R |
Colour in domestic equipment (including headphones) |
White (or no colour) |
Red |
Designation in broadcast equipment |
A |
B |
Designation in some stereo microphones |
X |
Y |
Colour in broadcast equipment* |
Red |
Green |
* Note that the broadcasting colours follow the colour convention used for navigation lights at sea.
M and S signals
The M signal is essentially the sum of the signals in the two channels; the S signal is the difference:
![]()
In practice a correction is applied. The addition of A and B, if these were identical as is the case for a central stereo image, then M is 6 dB higher than A or B. The correction which is used depends on circumstances, and sometimes on the broadcasting organization – it may be 3 dB or 6 dB.
Hence
![]()
Similarly
![]()
Derivation of M/S signals from A/B and vice versa
Two methods of doing this are shown in Figure 51.
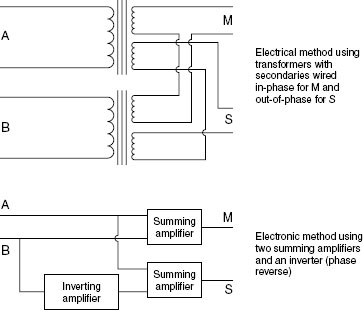
Figure 51 Conversion of stereo signals from A/B to M/S (or M/S to A/B).
Microphones for Stereo
1 Coincident Pair Microphones, A/B (or XY) Configuration
Both microphones have, as near as is practicable, identically similar characteristics and their diaphragms are mounted as close together as possible (ideally they would be coincident in space).
As Figures 52 and 53 show, for two figure-of-eight microphones the conversion of an A/B system to an M/S one can be effected by turning the microphone through 45°! The out-of-phase regions may or may be significant. Individual sound sources in these areas will appear in the stereo image as difficult to locate. Reverberation, in for example, a concert hall, is sufficiently diffuse for there to be no apparent ill-effects for the components of the reverberation which enter the microphones from the out-of-phase angles.

Figure 52 Polar diagrams for a pair of coincident figure-of-eight microphones. Note the out-of-phase quadrants
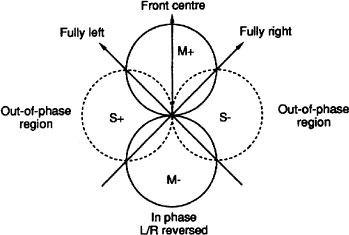
Figure 53 The equivalent M/S diagrams to Figure 52
Approximate Stereo Image Positions
The following tables assume well-matched coincident-pair microphones angled at 90° to each other. The positions of the sound images assume well-matched loudspeakers and good listening conditions. They can only be approximate because listeners can differ in their placing of such images (see Figure 50). The angle of sound incidence is with reference to the centre line between the microphones.
1. Figure-of-Eight Microphones
Angle of sound incidence (°) |
Approximate image position |
– 45 |
Fully left |
– 30 |
3/4 L |
– 15 |
1/2 L |
0 |
Centre |
15 |
1/2 R |
30 |
3/4 R |
45 |
Fully right |
The level of the M signal is about – 3 dB at 45° compared with the level at 0°.
2. Hypercardioids
Note that the polar diagrams for most hypercardioid microphones vary considerably with frequency. The figures in the table below are, nevertheless, likely to be fair indications for most speech and music.
Angle of sound incidence (°) |
Approximate image position |
– 75 |
Fully left |
– 60 |
3/4 L |
– 45 |
1/2 L |
– 20 |
1/4 L |
0 |
Centre |
20 |
1/4 R |
45 |
1/2 R |
60 |
3/4 R |
75 |
Fully right |
The level of the M signal is about –3 dB at roughly 60° to 70° compared with the level at 0°.
3. Cardioids
Note that, like hypercardioids, the polar diagrams for most cardioid microphones vary considerably with frequency. The figures in the table are, again, likely to be fair indications for most speech and music.
Angle of sound incidence (°) |
Approximate image position |
– 90 |
Fully left |
– 60 |
1/2 L |
– 30 |
1/4 L |
0 |
Centre |
30 |
1/4 R |
60 |
1/2 R |
90 |
Fully right |
The level of the M signal is about –3 dB at roughly 75° compared with the level of 0°.
4. M/S Microphones
Basically any M/S microphone must consist of a sideways figure-of-eight microphone with a forward-facing microphone which can, in principle, be of any pattern. A commonly used system consists of a forward-facing cardioid with the inevitable sideways figure-of-eight (Figure 54).
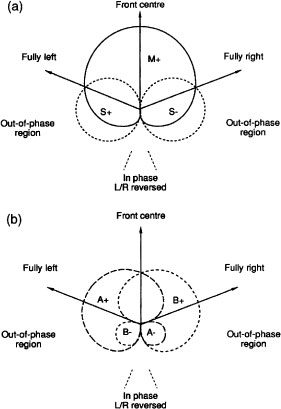
Figure 54 (a) M/S microphone, forward-facing cardioid; (b) the A/B equivalent – two cardioids at 90°
An M/S signal must, sooner or later, be converted into an A/B signal, certainly for aural monitoring. Methods for doing this are illustrated in Figure 55.
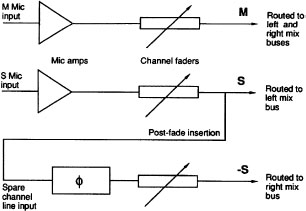
Figure 55 Derivation of A/B from M/S using three mixer channels, with the fader on the ‘spare’ channel providing width control
The width of the stereo image is dependent on the amplitude of the S signal – if that is zero then there is no stereo component and the result is mono. A method of obtaining an A/B signal from M/S using three channels on a mixer is shown in Figure 55, where a fader in the third channel controls the S signal and is thus a width control.
5. Panpot Systems
Each microphone’s output is placed in the stereo image by a ‘panpot’ which is essentially a potential divider which distributes the signal between the A and B channels according to the position of the sliding contact. It is, of course, possible to use coincident pair microphones and panpotted microphones at the same time.
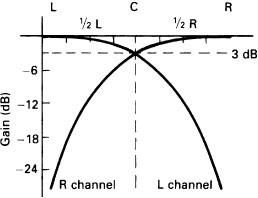
Figure 56 Panpot law