
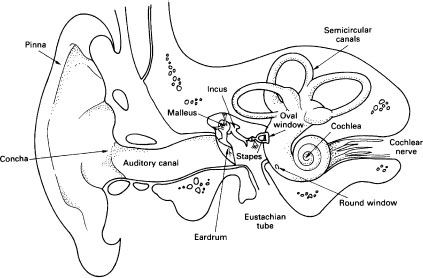
Figure 6 The structure of the ear (after Kessel and Kardon (1979))
The Response of the Ear to Different Frequencies
This is best shown graphically, as in Figure 8. Each line is an equal loudness curve. See below for an explanation of Phons.
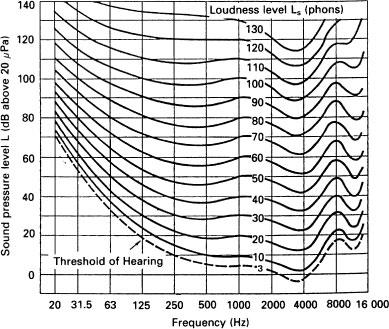
The reference zero, a sound pressure level (SPL) of 0 dB, is taken to be a pressure of 20 μPa (0.000 02 N/m2).
Frequency Discrimination
The smallest change in frequency that can be detected is known as the frequency difference limen, dl. At sound levels 20 dB above the threshold, and for frequencies below 1–2 kHz, and for durations greater than 0.25s dl is reasonably constant at 1 Hz. Above 2 kHz dl increases approximately in proportion to the frequency.
Loudness
Loudness is a subjective quality related to sound intensity. It is generally accepted that with steady tones a change of level of 1 dB can just about be detected. With speech and music 3dB is the minimum change of level that is normally detectable.
In general a change of level of 10 dB causes a doubling or halving of the perceived loudness.
The sone. This is an attempt to have a unit which is proportional to loudness. It is defined on the basis of one sone being the loudness at 40 dB above threshold, with 1 sone added for each 10 dB increase in level (or halved for each 10 dB below 40 dB).
s = 2(p–40)/10
where s is the number of sones for a sound pressure of p dB above the threshold.
The phon. Phons are defined by the SPL in dB at 1 kHz and the Equal Loudness Curves as shown in Figure 7. Thus, taking for example the 80 phon curve, at 63 Hz the SPL has to be about 90 dB to sound as loud as 80 dB at 1 kHz.
Noise Masking
The property of a louder signal to render inaudible a quieter sound. This effect is greatest when the two sounds are within the same critical band and when the masking signal is lower than the masked one. Figure 9 shows the effect of a 90 Hz-wide band of noise centred on 410 Hz on sounds of other frequencies.
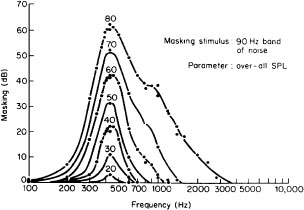
When the masking signal’s level is 60 dB it will provide about 30 dB of masking for frequencies between about 350 Hz and 600 Hz. With a masking noise level of 80 dB there will be roughly 20 dB of masking between 260 Hz and 1500 Hz. (Courtesy of Egan and Hale 11 (1950).)
Beats
With two tones whose frequencies are close together the signals will go alternately in and out of phase. One of three sensations are then possible.
up to about 10 Hz difference the low frequency alternations in level are perceived;
between frequency differences of about 10 Hz and about 50–500 Hz (according to the mean frequency) there is a sensation of ‘roughness’;
at higher frequencies the two frequencies are heard separately.
These beats are not difference tones and do not imply a non-linearity in the hearing process.
Difference tones, can however, be heard when the two frequencies are in the ratio 1.1:1 or 1.2:1 up to 1.5:1.