
10
Artificial Intelligence in ServiceNow
This chapter will cover one of the most powerful areas of the ServiceNow platform: its artificial intelligence (AI) and machine learning (ML) capabilities. The ServiceNow platform includes diverse AI features including predictive intelligence, AI search, Health Log Analytics, and Virtual Agent with Natural Language Understanding. This chapter will focus on predictive intelligence.
This chapter’s goal is to make the predictive intelligence AI features and their use and implementation accessible to as many people in the ServiceNow community as possible. We’ll start by providing a brief introduction to the relevant concepts in AI that are directly applicable to the ServiceNow capabilities. This will help you build a basic understanding of how you can expect the system to behave.
With that foundation in place, we’ll cover the key AI/ML capabilities of ServiceNow, as well as their application, and provide a framework. This will help you implement these features so that they have an impact on your organization.
In this chapter, we will cover the following topics:
- Understanding AI and ML
- The AI/ML capabilities of the ServiceNow platform
- Classification framework
- Regression framework
- Similarity framework
- Clustering framework
By the end of this chapter, you’ll be able to understand, explain, and implement the most common use cases of ServiceNow’s AI features.
Understanding AI and ML
When implementing AI features, it’s incredibly useful to have an understanding of what the system is doing so you know why you’re getting certain results and how those results will change in response to different actions you can take. A full introduction to AI requires at least an entire book, which would likely be out of date within months of publication. Therefore, we’ll cover the bare minimum needed to interact with ServiceNow AI deployments here. We will try and focus on enduring concepts rather than the latest trends.
What is AI?
Broadly speaking, AI is the ability of artificial systems to understand, process, or make decisions based on data provided to the system. AI is often used synonymously with ML, but ML is a subset of AI and some AI systems do not incorporate a learning component.
The difference between AI and ML
Even a simple set of scripted conditions is AI in a sense, and the earliest AI systems essentially consisted of lots of rules coded in by people. Unfortunately, once you start writing down rules, it quickly becomes apparent that, in most cases, the world is too complex and dynamic for people to keep up by writing all the rules manually.
In response to this, a sub-field of AI called ML has been created that allows people to provide computers with lots of data and then have the computers process that data to create their own rules that best fit the past data. This works well because the rate at which people can generate data is often much faster than the rate at which we can develop consistent, generalizable rules about the way the world works.
Typically, these sets of rules are called models, but ServiceNow refers to them as solutions in some cases. You can think of a model as a formula that relates a set of inputs in some standard format to an output of some kind. One kind of model might take a string of words and output a number representing the sentiment (positive or negative), while another model might take in an image and output a word to describe the contents of the image.
Again, you could, in theory, come up with a model manually but the central feature of ML is that the models are created by first defining a structure (how many variables and how those variables are related to each other) and then running some process to populate the variables in a way that best describes the training data. Some other nuances and techniques are used to prevent the models from overfitting to the training data in a way that would make them less useful. However, it’s enough to know that the models are populated mostly by using training data and that a good ML model will be able to predict future values using the information learned from past data.
Metrics and tradeoffs in ML models
A wide variety of metrics are used in ML research and development, but we’ll focus on the ones ServiceNow uses in their platform – coverage and precision. Coverage refers to the estimated proportion of future records that will have predictions made, while precision refers to the estimated proportion of those records for which predictions were made where the said predictions ended up being correct.
There are usually tradeoffs between different metrics, and understanding these tradeoffs is often essential for tuning a ServiceNow model for maximum impact. To manage these tradeoffs, it is important to understand that, in a business context, a model can give correct answers, incorrect answers, or no answer at all. You may have to make decisions such as whether you should increase the number of correct answers per wrong answer at the cost of giving fewer answers overall.
Imagine, for example, a five-question test where you would score 1 point for each correct answer, -5 points for each incorrect answer, and 0 points for a skipped question. You’d probably only want to answer the questions you were most sure about and skip the rest. If you were to write the same test and you got +5 points for a correct answer and -1 point for an incorrect answer, you’d probably be more willing to risk a wrong answer because the penalty is lower.
The same is true in the ServiceNow domain. If a customer creates a case about an issue, it would be quite acceptable to have a model recommend a possible knowledge base article to them 90% of the time, even if it was, on average, only 50% likely to solve the issue. This is because the cost of showing a user a non-helpful article is very small compared to the value of solving their issue on the spot.
In contrast, if you’re using a model to route tickets, you’d be happier to have a model that only gave an answer 50% of the time but was more than 90% correct when it did make a prediction. It’s ok for your model to “admit” to not knowing the answer but you don’t want the tasks sent to an incorrect group, only to languish in their queue until they re-assign it again.
These two situations illustrate cases of different priorities since the confusion created by an incorrect knowledge article is relatively small but the confusion caused by an incorrect routing can be much larger.
It’s worth noting that not all ServiceNow predictive intelligence features can assess their own precision metrics. For example, when looking for similar records using the similarity framework, you may need a person to manually check if a given answer is a good answer based on the input data.
The role of data in ML
As you may have realized by now, data is an essential component of an ML solution. The learning part of ML involves processing data to create a better model. While different types of models approach this in different ways, a common trend is that the quality of the output of the model will be no greater than the quality of the input data, even if the best model type is selected.
In a typical ML project, you will have some part of your historical data that you use for training, often called the training set, as well as two parts of that historical data that you use to assess how good your models are, known as the validation set and the test set. ServiceNow handles these splits for you and uses them to calculate the estimated metrics for your solutions as you train them, so you don’t need to worry about these splits.
Data comes in many forms, whether it is images, words, or numbers. However, in most AI models, the input data needs to be converted into lists of numbers in some way; those numbers are what is processed by the AI. Converting inputs into numbers is particularly important when we talk about text data. Fortunately, a great deal of research has been done into processing natural language text, such as what you might see in an incident short description, so there are tools that ServiceNow can use to make this process easier.
In Natural Language Processing (NLP), converting text input into numbers is often separated from the task of doing something useful with those numbers. We call the first part of the process embedding the text. This can mean taking a word such as cat and turning it into a list of numbers such as [0.2309, 0.2828, 0.6318, …, -0.7149]. Once the words are in numeric (also known as vector) form, you can use those numbers to do a variety of things, such as classification, clustering, and more. Each type of data you find in ServiceNow has some conversion that can be applied to put it into a numerical form. The algorithms will use those numerical representations for learning purposes.
Once the data is in a form that is suitable for an ML model to operate on, you can apply a variety of different algorithms to that data. In the next section, we’ll look at some examples of these algorithms.
Algorithms in ML
To understand how ServiceNow’s models can be expected to work, let’s look at some very basic algorithms that can solve specific problems. ML models might use many inputs or a complex input, such as a field of text, but the learning process results in a model that minimizes the mistakes it makes on the training dataset with the assumption that how the model does in the training will be an indicator of how it will do with real-world data. First, let’s predict a number based on some set of inputs. This type of task is called regression and focuses on the ability to correctly predict a number, given input. One common example of a regression problem is that of predicting a house’s price when given some inputs such as size, age, and the number of rooms.
Let’s look at a visual example. Assuming you wanted to predict house prices based on the number of rooms, you might plot the price against different numbers of bedrooms and then train a model to fit this data as well as possible. See the following figure for an example:
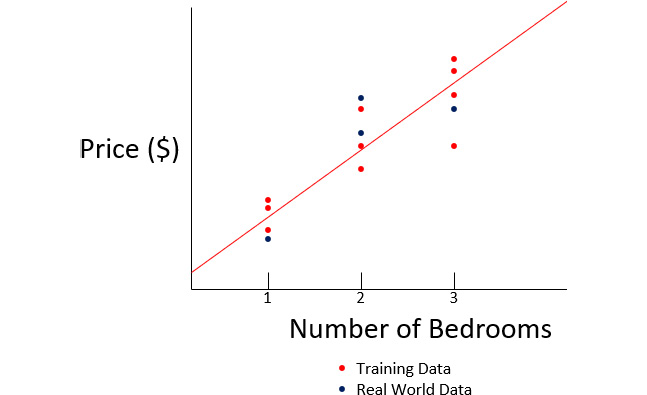
Figure 10.1 – ML works when the real-world and training data are similar
The red line indicates a possible model that has been trained to fit the training data to minimize the total error. As you can see, the real data seems fairly similar to the training data, so this model does a pretty decent job. However, if you used data from one city as your training data and then tried to predict house prices in a different city, you might end up with something similar to the following:

Figure 10.2 – When the training and real data are very different, ML will do well on the training data but poorly on the real data
In this example, you can see that the training data and the real-world data are unlikely to have come from the same underlying distribution, which means that no matter how well your trained model fits the training data, it’s not going to do a good job on the real data. Therefore, it’s important to be cautious any time you want to undertake an ML project and you don’t have access to a good quality training dataset that is representative of your production data.
The AI/ML capabilities of the ServiceNow platform
This section will focus on the different AI and ML capabilities within the ServiceNow platform. For each technology, we’ll cover not only the features but also examples of use cases where these features add value. By the end of this section, you should have a good overview of the capabilities offered, as well as how they can be applied in practice within your organization.
Predictive intelligence
ServiceNow’s predictive intelligence is a collection of fundamental ML features that handle similarity search, classifications, regression, and clustering, along with the supporting features that enable customers to train, manage, and support these features. Predictive intelligence underpins some of ServiceNow’s features, such as Major incident Workbench’s Similar incidents feature, but these capabilities are also available via a set of developer APIs so that they can address use cases specific to your business as well.
Within predictive intelligence, you’ll find four types of solution definitions, each targeting a specific type of problem. Later in this chapter, we’ll cover the steps to bring predictive intelligence to your company across these four capabilities, but first, let’s go through a hypothetical example of a predictive intelligence journey to give you a rough understanding of some of the key elements of this process.
Practical example – automating an incident routing rule
The best way to understand the difference between AI and ML is with a simple toy example that is representative of the journey many customers find themselves on.
Let’s imagine an incident has been logged in ServiceNow and, immediately, the company’s on-call service desk agent gets an email notification asking them to route the incident to the hardware or software team. Within 30 minutes or so, they will read the incident description and make a judgment call based on their knowledge of technology issues at this company and choose to either send the ticket to the hardware or software team.
After a while, the company leadership questioned the necessity of a trained specialist looking at every ticket and instead asked the service desk team lead to create an automatic process to route the tickets. The lead discussed this with their ServiceNow architect and together, they wrote down a set of rules to route tickets and then sent it over to the ServiceNow development team to implement.
The dev team looked over the rules and decided to build ServiceNow assignment rules based on these rules that look for certain keywords, such as Laptop or Microsoft Word. Then, depending on the matches, they send them to the hardware or software teams. If there are no matches, then the ticket will be routed to the software team because they generally have more capacity than the hardware team. With this new process in place, the service desk team had time to spend on higher-value tasks; the tickets were mostly routed very quickly but there was an increase in routing mistakes.
After a while, users start to complain that tickets related to the desktop interface for the recently implemented ERP system keep getting sent to the hardware team rather than the software team. The process owner recognized that while assignment rules and branching logic like this can cover some static rules, what they needed was a process that could learn and adapt to change – in other words, an ML solution. The process owner recognized that an ML system would allow the system to adapt without keeping the dev team busy coding up new rules each time something in the environment changes. Fortunately, ServiceNow’s predictive intelligence solution provides several capabilities that cover some of the most common ML use cases.
By enabling ServiceNow’s predictive intelligence solution for classification, they were able to train a classification solution (which is a type of ML model) so that it could use data about where past tickets were and notice patterns in the data that the service desk probably used subconsciously but didn’t consider important when they were writing rules. For example, words such as battery and USB occur with relatively high frequency in hardware issues than software issues, and words such as desktop and computer don’t tell you as much about where to route tickets as you might think.
The advantage of ML is that with enough input data, the system will learn many different factors and that these factors can continue to be updated over time without human input. These patterns can be used by ServiceNow to decide where to send the incident and recognize when it is not sure enough to make an automated judgment so that human judgment can be made instead.
The new system worked well but still didn’t quite live up to the expectations the process owner had for their incident routing. Due to this, they completed some error analysis by looking at cases where the predictive intelligence features didn’t provide the results they expected. In some cases, the errors were understandable (for example, long rambling incident descriptions describing a multitude of issues), but looking at the data showed that the system would generally be correct when it assigned tickets to the hardware team but that it would often send hardware tickets to the software team as well.
This result got the process owner thinking back to the old rules-based model and they realized that they had a systematic issue in the data where tickets had been misclassified as software issues by the old rules-based system. Based on this analysis, the service desk team was asked to use some of the time that this new automated process saved them to find examples of recent software tickets and to correct them, as well as any future tickets.
This data-cleaning process finally allowed the company to realize the full value of automation in ticket routing. While the system didn’t always get the routing perfectly correct, it would get most of the tickets to the right people far more quickly than a manual process and far more accurately than the rules-based approach.
Key lessons
This short case study illustrates several very useful concepts that you can apply to your implementation of predictive intelligence:
- This was a great use case because there was often a clear right answer for each classification task and there was already a team responsible for making those judgments. This type of use case is far more likely to succeed than use cases where the inputs, outputs, or decisions cannot be articulated clearly.
- The fact that this company had people doing the routing at the start of their journey allowed this team to qualify another important AI metric, known as human-level performance. Today, a trained person is the most intelligent system we know of, so most AI systems are aiming to get close to human-level performance, which is the expected performance of an unrushed human expert with access to the same data. Most systems aim to reach human-level performance and it is rare for AI systems to exceed human-level performance in terms of accuracy, so you can consider this level of performance as a likely upper bound on how good the system could be under ideal conditions.
- Implementing and testing a basic set of rules before moving to an AI solution provides what is called a performance baseline, which can be used as a likely lower bound on the performance of an AI system. If your AI system is performing more poorly than a set of simple rules, it’s unlikely that it has been properly selected, implemented, and tuned. We’ll cover the use of human-level performance and baseline performance to assess an AI use case later in this chapter but for now, knowing how good the baseline is gives you a sense of how hard the problem is.
- Implementing the predictive intelligence features required a substantial dataset of past incidents to train the solution. In general, ML is not a capability that can be implemented without data because there will be nothing for the ML system to learn from. At the same time, issues in that data can impact the quality of your system’s results, and the patterns of error in the training data were ultimately reflected in the results the classification solution provided.
- Correcting the data issues in both the past training data and new records allowed the company to improve the performance of the model but required time and effort from the service desk. While teams often focus on the reduction in effort from implementing ML, it’s important to recognize that new tasks will need to be carried out to keep the system performing well over time.
- The final value proposition for this case study was not that the system outperformed the service desk from the point of view of precision, but rather that it was nearly as precise but far faster than a human and roughly as fast but far more precise than the rule-based models.
Now that you have a conceptual understanding of the key concepts and have an idea of how an ML deployment might progress, let’s have a look at some of the specific features ServiceNow offers, as well as how they can be applied to drive value for your organization. We’ll start with the feature that this example was built on: the classification framework.
Classification framework
Classification is the task of taking a set of input data, including text or other fields, and using it to output a category, assignment, or other value from a set list of options. In traditional enterprise workflows, simple classification decisions are made with static rules, while more complex classifications rely on expert judgment. ServiceNow’s classification solutions allow the systems to make more complex judgments in an automated way by leveraging information about how data was categorized in the past.
Classification solutions generally outperform simple rules when there are complex relationships between multiple input factors or when there are many examples of high-quality training data for a specific problem. In contrast to this, in a common use case such as setting a priority based on impact and urgency, the relationships between impact and urgency are typically clear and can be captured in a simple 3x3, 4x4, or 5x5 data table. In these cases, you don’t need ML to create an accurate classification because simple rules already work well. If you take the task of predicting the category of an incident from input data, including the department of the user, the text of the incident, and the country of the user, you start to get complex relationships that are not possible to fully document, much less implement in code.
Assessing the applicability of the classification framework
Once you have an idea where a classification solution could be applied, you can use the following tests to determine if this is the right type of solution for your use case:
- Is the problem more complex than you could solve with a simple set of rules or a lookup table? For simple problems, using a classification solution is needlessly complicated.
- Is the problem you’re solving valuable enough to justify managing a classification solution over time? Typically, you’ll want to target higher-volume use cases where the efficiencies gained will outweigh the costs to support and tune the solutions.
- Are the output values (the ones you want to predict) a choice or reference list with a limited number of options? The more classes you have, the harder it is for the model to predict useful values.
- Do you have enough high-quality data to train a classification solution? You will need at least 10,000 records in aggregate with 30 or more examples of each class. However, ServiceNow recommends over 30,000 records for good results. Keep in mind that errors in your training data will make the model’s predictions worse.
- If a mistake is made in the classification, is there a way to correct that error before unacceptable harm occurs? Classification solutions typically have some error rate, so they should not be used if mistakes would be unacceptable (for example, in safety-critical applications).
If you can answer yes to these questions, a classification solution is likely worth trying for your use case. Now, let’s see what it takes to configure a classification solution.
Getting started with the classification framework
Once you’ve applied the criteria in the previous section to determine that your use case seems to be a good fit for the classification framework, you can train your first classification solution. The technical steps are available in the ServiceNow documentation and are subject to change with new releases, so we’ll focus on the key decisions that need to be made and how to think about them.
First, you will want to create a classification definition, which you can do by going to the left menu and selecting Predictive Intelligence | Classification | Solution Definitions:

Figure 10.3 – Menu location of Solution Definitions
The classification definition form walks you through the steps involved, but we’ll provide some supplementary details for how to think about each of these steps:

Figure 13.5 – Classification definition form
The first thing you must do is create a descriptive label and review the name and, possibly, the domain of the definition. The label is up to you and does not impact the functionality of the solution definition. Let’s look at each step one by one.
Step 1 – word corpus
If you plan to include any string field (string is the technical name for text fields) in your model, you should create or select a word corpus. Remember earlier in this chapter when we discussed embedding words as vectors or lists or numbers? The word corpus is used to complete this process. It’s important to note that you can reuse a word corpus between use cases and that the word corpus can include tables other than the one you’re predicting.
A good word corpus should contain a lot of text that is relevant to your company’s use cases. If you don’t have a lot of good text data, you can use the Pre trained option, which provides decent performance on general language but won’t capture the details of your company’s systems and nomenclature. If you include a text field but don’t create a word corpus, the system will try to automatically create one. However, it’s better to intentionally select your options for this field if you want to use any text processing capabilities.
Step 2 – output fields
After selecting a word corpus, you’ll want to identify the table and field that you are aiming to predict. If you want to predict multiple field values, you should create a classification definition for each one. Remember that you want to choose a field with a limited set of options. ServiceNow prevents you from selecting text fields as the target because the classification algorithms they use aren’t useful for predicting freeform text. It’s also important to choose a field that has a single logically correct value. For example, you could reasonably ask the solution to choose an “assignment group” but choosing an “assigned to” individual requires context surrounding availability, skills, and other data that is likely not present in the input record.
Step 3 – input fields
Here, you’ll want to select a set of fields that can be used to predict the output values. When selecting these fields, you should consider at least the following factors:
- Input sequence: The fields being used to drive predictions should be populated before the output fields. For example, asking to predict an assignment group using a closure code wouldn’t work because the closure code is populated later in the workflow.
- Relevance: Ideally, you want to choose fields that have a clear causal relationship with the output; for example, the description field of an incident is very useful for determining the categorization that should be assigned. A good way to think of this is to ask what information from the record a person would want to use if they were doing the prediction themselves.
- Stability: A field that is consistent across the life cycle of your record is a much better predictor than one that changes between the time of prediction and closure. For example, the state of a task is a very bad input field because your training data likely consists of mostly closed tasks, while the tasks you want to predict based on will likely all be open.
It can be useful to experiment with different input fields and see how they impact the model output.
Step 4 – training data and frequency
In this step, you can restrict the set of data that you want to use for training. This is useful when not all the data in the table from step 2 is useful for making predictions. You will likely want to exclude data that is too old (more recent data is more likely to be relevant than older data) or that is still in progress (for example, tickets still waiting for assignment).
The Stop Words field allows you to select a list of stop words that should be ignored, often because they are very common or don’t provide useful information about the ticket. Stop words are most useful in fine-tuning your results. So, if you’re operating in English, it’s usually alright to use the default English stop words as a starting point and then add your own company-specific stop words after looking at some of the results where the classification solution didn’t perform as expected.
Finally, the Training Frequency field allows you to set an interval for your solution to be retrained automatically. This helps you incorporate information from new records and keeps your model from becoming stale. Once you’ve filled in all the fields, you can send your solution for training using the Submit and Train button.
Evaluating a trained solution
When you train a solution definition, the system will create and train a new ML solution for classification, which includes detailed information about how the classification solution is expected to perform. The amount of time it takes to train the solution is dependent on multiple factors, including the size of your training dataset. However, once the state is set to Solution Complete by the training process, you’ll be ready to evaluate and tune your model’s performance. To do this, you’ll have to rely on three main metrics that the ServiceNow platform calculates for you.
Precision
Precision is the percentage of the model’s predictions that we expect to be correct. A precision of 90 means that 90% of the predictions were correct. Precision is a useful metric if the simple ratio of correct classifications to incorrect classifications is very important to you, but always remember that surprising simple rules can often provide high precision values without generating a lot of value. For example, if you meet a stranger in the street, you can predict with a precision of 99.7 that today is not their birthday simply by always guessing it’s not their birthday. This doesn’t mean you’re good at guessing birthdays but rather that high precision can be achieved with a simple rule.
Coverage
Coverage is the percentage of records for which the model is confident enough to make a prediction. A coverage of 80 means that the model predicted 80% of records. Coverage is important because admitting that you have insufficient information to make a confident prediction prevents the model from making avoidable errors. This is important because the cost of a bad prediction can often be much higher than the cost of making no predictions at all.
Recall
The weighted average of the recall of each class. This definition of recall is the number of times the solution predicted the correct class out of the total number of occurrences of that class, aggregated across all classes. This is a metric that can help you understand how well the model is doing at predicting the different classes, but this metric is best used on a class-by-class basis. (This information is available on the Class Confidence tab.)
There is an inherent tradeoff between precision and coverage, which we addressed earlier in this chapter. Now, you can apply the concepts from that discussion here by selecting a target metric and indicating a value for the solution you want to try and achieve. Applying the value usually won’t get you to the exact target value but will bring the solution closer to that point.
The Test Solution tab allows you to input various test values and evaluate the predicted outputs of the model directly. You also have the option to run the test against a subset of the target table to assess the predictions there. This can be useful for checking the model’s performance on very recent data.
Related lists
There are two important related lists for the classification solution: class confidence and excluded classes.
The Excluded Classes tab lists those classes that you didn’t have enough training data for, which means they won’t be predicted by the model. Remember that you need at least 30 data points for a class to be predicted.
The Class Confidence tab shows you the precision, coverage, and recall for each class, as well as the distribution of classes in your data. It’s important to look at this because if your data is very imbalanced (that is, some classes occur much more frequently than others), the model could have good aggregate metrics by simply doing well on one or two of the classes. Note that a model that is good at predicting a smaller set of classes can still add business value if the cost of mislabeling a record is relatively low. Classification is just one of the capabilities that ServiceNow’s predictive intelligence features enable. Next, we’ll look at regression, which predicts numeric values instead of a class.
Regression framework
When you consider the different types of fields in ServiceNow, you might notice that not all fields lend themselves to a classification approach. In addition to assigning categorical values, you may also want to predict numeric field values such as durations, sizes, effort levels, or other measures that vary along some numeric scale. Regression solutions have some distinctive characteristics, which make them very useful as an additional tool for automating processes. To understand these benefits, it is necessary to think about the types of data that we would be predicting and how a person would estimate the number based on inputs. Let’s use the example of estimating the hours that should be estimated for a user story based on some given input text and an assigned team.
The first thing to think about in this situation is whether we should hope for a precisely correct answer each time. If you estimated 30 hours and it turned out to be 28 or 32, you’d probably still think it was a decent estimate; regression solutions approach the problem in the same way. Training a regression solution minimizes how wrong the model is without really expecting that it will get the right answer each time. Instead of an exact value that can be nearly impossible to guess, it may be more useful to think about things in terms of a range of likely values. A person might say, for example, That feature will take between 20 and 30 hours to implement. A regression model in ServiceNow can do the same thing when it provides a range for the expected value of a given value.
Metrics for regression
This understanding allows us to talk about the metrics that are used to assess a regression model. Remember that these metrics are about getting close to the actual value, not getting a precisely correct answer each time.
The metrics for a regression solution will be covered in this section.
Mean absolute error (MAE)
On average, how far from the correct values are the predictions? This is a measure across your whole dataset, so it doesn’t tell you about how bad your worst case is or how good your best-case estimates are. If you had two records where the correct value is 10, you could get a mean absolute error (MAE) of 5 by predicting 10 and 0 or by predicting 5 and 15. It’s important to note that these are absolute errors in that they are absolute values, so an overestimate doesn’t cancel out a later underestimate. What matters is how wrong the prediction was, not in which direction. The units for MAE are the same as the units for the field you’re trying to predict. So, if you are predicting hours, then the MAE would be in hours as well.
Symmetric mean absolute percentage error (SMAPE)
Symmetric mean absolute percentage error (SMAPE) is important because MAE is not always a good way to look at errors; for example, predicting a value of 1,005 when the true value is 1,000 might be acceptable (MAE=5), but predicting 5.25 when the true value is 0.25 (also MAE=5) is not nearly as good. To get around this problem, SMAPE, a modification of MAE where you divide by a special value after getting the absolute error, can be used. To avoid dividing by zero and to make sure we can always give an error value between 0 and 100, the system calculates this special value as the average of the prediction and the actual value. This gives you an answer between 0 and 100 but as a result, the answer will no longer be in the same units as the predicted fields.
Range accuracy
We mentioned that regression models not only predict a value that should be close to the true value but also a range (lower and upper bounds between which the value is expected to fall). The range accuracy is quite simply the estimated percentage of predictions that will fall within the range predicted. Predicted ranges are very useful when planning because it gives you some idea of what the likely outcomes are.
Average interval width
An excellent range accuracy can be achieved simply by providing a very wide range. How much time will that feature take to develop? If you answer between 1 minute and 42,000 years, you’re probably right, but your answer won’t be very useful. The average interval width provides a measure of the average distance between the bottom of the bound and the top of the bound. If this distance is smaller, this points to a more useful model if range accuracy is still usefully high.
You’ll notice a consistent trend throughout this chapter, which is the tradeoffs between metrics; this tradeoff is inherent to the ML field. Your job, as the person deploying, sponsoring, or analyzing these results, is to consider the business implications of these tradeoffs given their place in your processes and operational context.
These metrics will allow you to assess how well your model works. In the next section, we’ll look at the importance of data quality in training models to get good results on these metrics.
Input data quality
When you go to train a regression model, selecting the input dataset is very important. Due to the fact that errors are averaged, a population of easily predicted values in your training data can have a big impact. Regression models require at least 10,000 records to train, which means that it’s tempting to include records with no value or the default value to create a large enough dataset. The problem with this is that your model will be able to predict some number close to the default value for each record and artificially deflate the MAE and other metrics. Instead, consider strategies such as labeling some of the records manually. Even if this will take a few person-days of effort, this will lead to far more accurate results and could make the difference between the success and failure of your use case. Most teams typically under-invest in assessing and improving their data when working on ML use cases because it’s not the most engaging work or because the task can seem insurmountable when you’re talking about thousands of records.
Improving data quality
There are a few strategies that you can use to help assess and reduce the efforts to improve your training dataset.
Strategy 1 – assess the true size of the effort
Consider working through a small set of 100 records manually and seeing how long it takes. Then, use that to estimate how long it would take to label or validate your entire dataset.
Strategy 2 – validate a representative sample
If you’re unsure of the input data quality but are not able to justify evaluating every record by hand, you might consider evaluating 5% or 10% of the records selected at random. This will give you a very good estimate of the overall data quality at a fraction of the cost.
Strategy 3 – develop the value case for good data
If you validate some or all of your data but find that the quality of data is poor, this can strengthen the value case for your ML use case. It indicates a gap in the current process and an opportunity for even greater improvement relative to the current state.
Regression and classification models both have a common theme of predicting field values. The next two model types don’t specifically predict a field value, but they can both be very useful.
Similarity framework
The ServiceNow similarity framework allows you to find new records that are similar to a given input record. This could help a support agent to find past customer cases similar to the case they are working on so that they can reuse knowledge or resolution details. It can also help prevent entering duplicate data or correlating records coming in, such as incidents related to an active major incident.
The similarity framework differs from the prior two predictive models because it will find entire records and not just a single field value.
A useful trick when employing a similarity search model is to use data values from a highly similar past data record to populate your current record. This allows a good similarity model to act as a classification or regression model. This approach is not without its drawbacks however and ServiceNow is not set up to calculate metrics for that use. In general, when using similarity models, it can be hard to assess metrics because determining whether a person would consider records to be similar requires human inspection.
Assessing the similarity framework’s performance
Because ServiceNow doesn’t provide built-in metrics that assess similarity model results, you need to employ different methods to confirm the usefulness of similarity data.
ServiceNow allows you to manually review similar record examples. This is a quick and often useful way to get a sense of what the model considers similar. It’s quick and easy to use and should always be your first step in looking at the output of a similarity framework solution.
To complement this list, there’s a more rigorous but also more time-intensive approach that can be used. You may choose to adapt some of this process to meet your needs, but the general structure is given here:
- Before training your model, set aside a small set of test records (say, 50 to 100). Be sure to exclude these records from your training dataset for your similarity solution.
- Train your model on the remainder of your training dataset.
- On the solution version page, there’s an option to test records, run your sample records through this testing feature to identify the most similar records, and use a similarity score for each match. Record these results.
- Take these results and give them to two to three different people who are knowledgeable about the tickets and ask them whether they would consider the records to be similar. (Giving the records to multiple people allows you to minimize the subjectivity of the assessment.)
- At this point, you can construct a table of records that specifies their similarity score and human-assessed relevance. Rank the entries in the table by similarity score with the highest similarity records first. It is likely but not certain that records higher in the table will have better human scores. This table will allow you to set a similarity score threshold that gives you acceptable coverage while providing results people consider useful.
Let’s look at an example that consists of 10 test records assessed by two human reviewers:

Table 10.1 – Example similarity scoring table
In this example, records with a similarity score of 75 or higher mostly seem to be useful to human validators. In this case, setting your similarity threshold to around 75 would make sense and provide around a 75% usefulness rate and 60% coverage.
Using these tools, the ServiceNow similarity framework can be incredibly useful for providing relevant current or historical data in the context of work being done on the platform.
Another example of the similarity framework is when using a pre-trained word corpus. Here, it’s possible to create a relatively good model with very little training data. Similarity is the only one of ServiceNow’s predictive intelligence features that can be turned on from day 1 of your ServiceNow journey, even without historical data, though you should expect better results with high-quality training data.
The final predictive intelligence model type is a sort of bulk similarity model, and is called the clustering framework because it clusters together groups of similar records for analysis.
Clustering framework
Clustering is a tool for exploring data and detecting patterns that are not apparent to people looking at individual records. Like similarity solutions, a clustering solution quantifies the degree to which records are like one another. The difference is that while similarity search applies to one record at a time, the clustering framework applies to your entire dataset, creating groups of records that mean similar things.
These results are then grouped in a visualization called a treemap, where clusters represent blocks of different records and are sized according to the number of records in each cluster.
Once your clustering solution has been trained, it can be used as an exploratory tool to identify large groups of records that adhere to common patterns. Clustering is very useful for identifying automation opportunities or reoccurring issues.
Creating a clustering solution
Setting up a clustering solution is somewhat more complex than other models. We’ll review the setup and training process here:
- The first step is to choose a label and name for the clustering solution.
- Now, you can select a word corpus. This step is similar to what we covered in the Step 1 – word corpus section. The word corpus is optional but is likely to produce better results for complex data.
- Next, you can select the table from which to source the records and the relevant fields on that table to use for the clustering analysis process.
- The Group By selection allows you to apply a logical grouping to your records before the clustering process runs. Assignment Group, Category, and similar fields that indicate broadly similar families of records are typically used for Group By fields.
- Purity fields can be used to help determine how good your clusters are. Clusters should contain primary records where the purity fields match, so you should select fields that would expect to be the same for similar records.
- You can select a processing language to process the text for a language in addition to English. This will be useful for implementations that use languages other than English.
- You can also select stop words, just like in the other solutions. As you can probably tell, maintaining one good stop word list that can be reused between models will be a big time saver relative to building separate stop word lists per model.
- You can select update and training frequencies that match the rate of change in your data. Consider how often the results will be reviewed and how frequently the analysis is likely to change.
- Finally, a minimum number of records per cluster can be set. This will depend on your use case, but consider whether a cluster with fewer than 5 to 10 records would be a cluster that provides value in your analysis. You can always reduce the minimum cluster size and retrain it once your largest clusters have been analyzed.
- Once you’ve filled in these parameters, you can train your clustering solution. Once it’s ready to go, you’ll be able to use the Cluster Visualization tab to review the results of your clustering solution.
This visualization allows you to interactively filter for cluster sizes and quality. This will allow you to focus on the largest and most consistent clusters first, which are the ones most likely to provide useful ticket groupings. Clicking through the clusters will allow you to see the top 25 representative records, which can be used to identify common root cases and optimization opportunities.
Between similarity, clustering, regression, and classification, ServiceNow provides the tools to address most record-level ML use cases.
Summary
This chapter has given you an overview of AI and ML as it relates to the ServiceNow platform. We’ve covered features and their applications in terms of creating value, as well as some of the common pitfalls in their application. We explored the differences between the types of predictive intelligence models and the key considerations for their training and use. While the features that were covered in this chapter represent part of the core of AI in ServiceNow and are the most broadly applicable, the ServiceNow platform has two more broadly applicable capabilities that allow us to build incredibly engaging user experiences – NLP and AI search. We’ll address them in the next chapter.