
Debugging SharePoint Solutions
Debugging code is as important as writing the code itself. There are few differences in debugging SharePoint code as compared to traditional ASP.NET applications. In ASP.NET you can just set the breakpoint in the code. Press F5 and you can debug the code line by line. It is not as simple in SharePoint because you already have a web application up and running to which you are deploying your customizations. Following are the various techniques to debug code in SharePoint.
Disabling Custom Errors
Custom errors are the way to hide the yellow error screen and show more user friendly messages. Unfortunately they don’t help much in understanding the root cause of issues, and we normally turn these off during the development phase. In SharePoint you normally see a screen showing unexpected error or limited error detail. To see it for yourself go to the farm solution project created earlier in this hour and add throw new Exception(); in the CreateChildControls method. Build and redeploy the solution and refresh the page where the web part is hosted. You see the custom error screen shown in Figure 3.23.
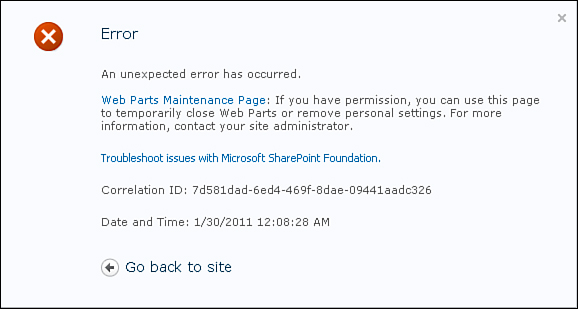
Figure 3.23. Custom error screen
To disable custom errors, open the web.config file for you web application. You can usually find it at C:InetpubwwwrootwssVirtualDirectories in a folder that corresponds to the port number of your web application. Search for the customErrors tag and set the mode attribute to Off or RemoteOnly. Then find the SafeMode tag and set the CallStack and AllowPageLevelTrace attributes to true. Refresh the page and you see more detailed error information as shown in Figure 3.24.
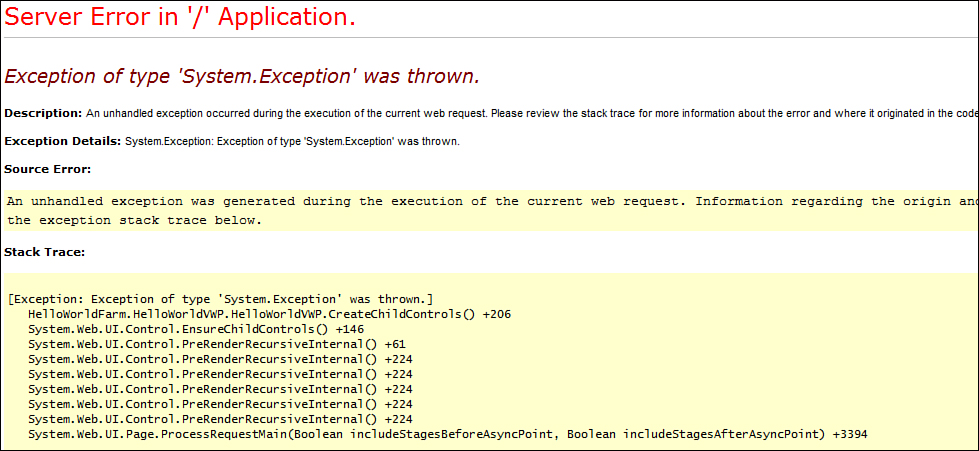
Figure 3.24. The error screen when custom errors are turned off
Introducing Developer Dashboard
SharePoint 2010 comes with a developer dashboard that you will find useful in debugging especially in a production environment. The developer dashboard provides a lot of information such as the stack trace of the current execution and also the SQL queries currently executing. To enable the developer dashboard execute the following command:
stsadm -o setproperty -pn developer-dashboard -pv OnDemand
The other options for this are On and Off in place of OnDemand. After executing this command, refresh your site and you can see a new icon on the top left after the username. Click it and you can see the developer dashboard at the bottom of the same page, as shown in Figure 3.25. Note that you need to remove the throw new Exception(); statement that we added in the previous section and redeploy the solution, or else the page will continue to show the error screen.

Figure 3.25. Developer dashboard
Debugging in Visual Studio
In traditional ASP.NET applications debugging can be started from within the Visual Studio. In SharePoint 2010 you need to attach to the worker process for debugging. Open the HelloWorldFarm project created earlier. Browse to the site where you deployed the web part. Open the HelloWorldVWP.cs file and add a breakpoint at the CreateChildControls method. Now go to the Debug menu and select Attach to Process. Make sure that Show Processes from All Users and Show Processes in All Sessions are selected. You may see multiple w3p.exe in the list. Attach to the appropriate process. If you are unsure which is the right w3p process you can simply attach to all the w3p processes as shown in Figure 3.26.
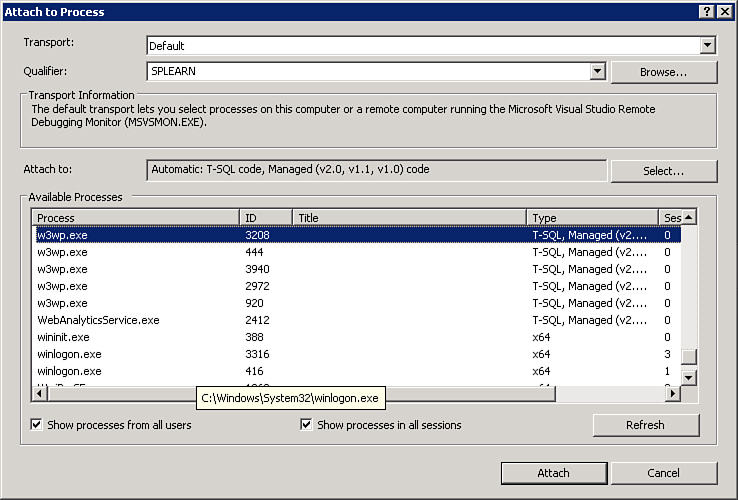
Figure 3.26. Attach to Process in Visual Studio 2010
Sometimes the breakpoints do not load even after attaching the debugger. To solve this problem click the Select button in the Attach to Process screen and select only the Managed (v2.0,v1.1,v1.0) option.
Refresh the page and you can step into the code.
Debugging a sandboxed solution in Visual Studio is similar but requires you to attach to the SPUCWorkerProcess.exe.