
Engineering Resilience into Safety-Critical Systems
Resilience is often defined in terms of the ability to continue operations or recover a stable state after a major mishap or event. This definition focuses on the reactive nature of resilience and the ability to recover after an upset. In this chapter, we use a more general definition that includes prevention of upsets. In our conception, resilience is the ability of systems to prevent or adapt to changing conditions in order to maintain (control over) a system property. In this chapter, the property we are concerned about is safety or risk. To ensure safety, the system or organization must be resilient in terms of avoiding failures and losses, as well as responding appropriately after the fact.
Major accidents are usually preceded by periods where the organization drifts toward states of increasing risk until the events occur that lead to a loss (Rasmussen, 1997). Our goal is to determine how to design resilient systems that respond to the pressures and influences causing the drift to states of higher risk or, if that is not possible, to design continuous risk management systems to detect the drift and assist in formulating appropriate responses before the loss event occurs.
Our approach rests on modeling and analyzing socio-technical systems and using the information gained in designing the socio-technical system, in evaluating both planned responses to events and suggested organizational policies to prevent adverse organizational drift, and in defining appropriate metrics to detect changes in risk (the equivalent of a ‘canary in the coal mine’). To be useful, such modeling and analysis must be able to handle complex, tightly coupled systems with distributed human and automated control, advanced technology and software-intensive systems, and the organizational and social aspects of systems. To do this, we use a new model of accident causation (STAMP) based on system theory. STAMP includes nonlinear, indirect, and feedback relationships and can better handle the levels of complexity and technological innovation in today’s systems than traditional causality and accident models.
In the next section, we briefly describe STAMP. Then we show how STAMP models can be used to design and analyze resilience by applying it to the safety culture of the NASA Space Shuttle program.
The approach we use rests on a new way of thinking about accidents, called STAMP or Systems-Theoretic Accident Modeling and Processes (Leveson, 2004), that integrates all aspects of risk, including organizational and social aspects. STAMP can be used as a foundation for new and improved approaches to accident investigation and analysis, hazard analysis and accident prevention, risk assessment and risk management, and for devising risk metrics and performance monitoring. In this chapter, we will concentrate on its uses for risk assessment and management and its relationship to system resilience. One unique aspect of this approach to risk management is the emphasis on the use of visualization and building shared mental models of complex system behavior among those responsible for managing risk. The techniques integral to STAMP can have great value in terms of more effective organizational decision-making.
Systems are viewed in STAMP as interrelated components that are kept in a state of dynamic equilibrium by feedback loops of information and control. A socio-technical system is not treated as just a static design, but as a dynamic process that is continually adapting to achieve its ends and to react to changes in itself and its environment. The original design must not only enforce constraints on behavior to ensure safe operations, but it must continue to operate safely as changes and adaptations occur over time.
Safety is an emergent system property. In STAMP, accidents are accordingly viewed as the result of flawed processes involving interactions among people, societal and organizational structures, engineering activities, and physical system components. The process leading up to an accident can be described in terms of an adaptive feedback function that fails to maintain safety as performance changes over time to meet a complex set of goals and values. The accident or loss itself results not simply from component failure (which is treated as a symptom of the problems) but from inadequate control of safety-related constraints on the development, design, construction, and operation of the socio-technical system.
Safety and resilience in this model are treated as control problems: Accidents occur when component failures, external disturbances, and/or dysfunctional interactions among system components are not adequately handled. In the Space Shuttle Challenger accident, for example, the O-rings did not adequately control the propellant gas release by sealing a tiny gap in the field joint. In the Mars Polar Lander loss, the software did not adequately control the descent speed of the spacecraft – it misinterpreted noise from a Hall effect sensor as an indication the spacecraft had reached the surface of the planet.
Accidents such as these, involving engineering design errors, may in turn stem from inadequate control of the development process, i.e., risk is not adequately managed in design, implementation, and manufacturing. Control is also imposed by the management functions in an organization – the Challenger and Columbia accidents, for example, involved inadequate controls in the launch-decision process and in the response to external pressures – and by the social and political system within which the organization exists. A system is resilient when that control function responds appropriately to prevent risk from increasing to unacceptable levels as the system and its environment change over time.
While events reflect the effects of dysfunctional interactions and inadequate enforcement of safety constraints, the inadequate control itself is only indirectly reflected by the events – the events are the result of the inadequate control. The control structure itself, therefore, must be carefully designed and evaluated to ensure that the controls are adequate to maintain the constraints on behavior necessary to control risk. This definition of risk management is broader than definitions that define it in terms of particular activities or tools. STAMP, which is based on systems and control theory, provides the theoretical foundation to develop the techniques and tools, including modeling tools, to assist managers in managing risk and building resilient systems in this broad context.
Note that the use of the term ‘control’ does not imply a strict military command and control structure. Behavior is controlled or influenced not only by direct management intervention, but also indirectly by policies, procedures, shared values, the level of awareness of behavioral/cognitive patterns and other aspects of the organizational culture. All behavior is influenced and at least partially ‘controlled’ by the social and organizational context in which the behavior occurs. Engineering this context can be an effective way of creating and changing a safety culture.
STAMP is constructed from three fundamental concepts: constraints, hierarchical levels of control, and process models. These concepts, in turn, give rise to a classification of control flaws that can lead to accidents. Each of these is described only briefly here; for more information see Leveson (2004).
The most basic component of STAMP is not an event, but a constraint. In systems theory and control theory, systems are viewed as hierarchical structures where each level imposes constraints on the activity of the level below it – that is, constraints or lack of constraints at a higher level allow or control lower-level behavior.
Safety-related constraints specify those relationships among system variables that constitute the non-hazardous or safe system states – for example, the power must never be on when the access to the highvoltage power source is open, the descent engines on the lander must remain on until the spacecraft reaches the planet surface, and two aircraft must never violate minimum separation requirements.
Instead of viewing accidents as the result of an initiating (root cause) event in a chain of events leading to a loss, accidents are viewed as resulting from interactions among components that violate the system safety constraints. The control processes that enforce these constraints must limit system behavior to the safe changes and adaptations implied by the constraints. Preventing accidents requires designing a control structure, encompassing the entire socio-technical system, that will enforce the necessary constraints on development and operations. Figure 8.1 shows a generic hierarchical safety control structure. Accidents result from inadequate enforcement of constraints on behavior (e.g., the physical system, engineering design, management, and regulatory behavior) at each level of the socio-technical system. Inadequate control may result from missing safety constraints, inadequately communicated constraints, or from constraints that are not enforced correctly at a lower level. Feedback during operations is critical here. For example, the safety analysis process that generates constraints always involves some basic assumptions about the operating environment of the process. When the environment changes such that those assumptions are no longer true, the controls in place may become inadequate.
The model in Figure 8.1 has two basic hierarchical control structures – one for system development (on the left) and one for system operation (on the right) – with interactions between them. A spacecraft manufacturer, for example, might only have system development under its immediate control, but safety involves both development and operational use of the spacecraft, and neither can be accomplished successfully in isolation: Safety must be designed into the physical system, and safety during operation depends partly on the original system design and partly on effective control over operations. Manufacturers must communicate to their customers the assumptions about the operational environment upon which their safety analysis and design was based, as well as information about safe operating procedures. The operational environment, in turn, provides feedback to the manufacturer about the performance of the system during operations.
Between the hierarchical levels of each control structure, effective communication channels are needed, both a downward reference channel providing the information necessary to impose constraints on the level below and a measuring channel to provide feedback about how effectively the constraints were enforced. For example, company management in the development process structure may provide a safety policy, standards, and resources to project management and in return receive status reports, risk assessment, and incident reports as feedback about the status of the project with respect to the safety constraints.

Figure 8.1: General form of a model of socio-technical control (Adapted from Leveson, 2004)
Between the hierarchical levels of each control structure, effective communication channels are needed, both a downward reference channel providing the information necessary to impose constraints on the level below and a measuring channel to provide feedback about how effectively the constraints were enforced. For example, company management in the development process structure may provide a safety policy, standards, and resources to project management and in return receive status reports, risk assessment, and incident reports as feedback about the status of the project with respect to the safety constraints.
The safety control structure often changes over time, which accounts for the observation that accidents in complex systems frequently involve a migration of the system toward a state where a small deviation (in the physical system or in human behavior) can lead to a catastrophe. The foundation for an accident is often laid years before. One event may trigger the loss, but if that event had not happened, another one would have. As an example, Figures 8.2 and 8.3 show the changes over time that led to a water contamination accident in Canada where 2400 people became ill and seven died (most of them children) (Leveson et al., 2003). The reasons why this accident occurred would take too many pages to explain and only a small part of the overall STAMP model is shown.

Figure 8.2: The designed safety control structure in the Walkerton Water contamination accident
Each component of the water quality control structure played a role in the accident. Figure 8.2 shows the control structure for water quality in Ontario Canada as designed. Figure 8.3 shows the control structure as it existed at the time of the accident. One of the important changes that contributed to the accident is the elimination of a government water-testing laboratory. The private companies that were substituted were not required to report instances of bacterial contamination to the appropriate government ministries. Essentially, the elimination of the feedback loops made it impossible for the government agencies and public utility managers to perform their oversight duties effectively. Note that the goal here is not to identify individuals to blame for the accident but to understand why they made the mistakes they made (none were evil or wanted children to die) and what changes are needed in the culture and water quality control structure to reduce risk in the future.

Figure 8.3: The safety control structure existing at the time of the Walkerton Water contamination accident
In this accident, and in most accidents, degradation in the safety margin occurred over time and without any particular single decision to do so but simply as a series of decisions that individually seemed safe but together resulted in moving the water quality control system structure slowly toward a situation where any slight error would lead to a major accident. Designing a resilient system requires ensuring that controls do not degrade despite the inevitable changes that occur over time or that such degradation is detected and corrected before a loss occurs.
Figures 8.2 and 8.3 show static models of the safety control structure, drawn in the form commonly used for control loops. (Lines going into the left of a box are control lines. Lines from or to the top or bottom of a box represent information, feedback, or a physical flow. Rectangles with sharp corners are controllers while rectangles with rounded corners represent physical processes.) But to build a resilient system, models are needed to understand why the structure changed over time in order to build in protection against unsafe changes. For this goal, we use system dynamics models. The field of system dynamics, created at MIT in the 1950s by Forrester, is designed to help decision makers learn about the structure and dynamics of complex systems, to design high leverage policies for sustained improvement, and to catalyze successful implementation and change. System dynamics provides a framework for dealing with dynamic complexity, where cause and effect are not obviously related. Like the other STAMP models, it is grounded in the theory of non-linear dynamics and feedback control, but also draws on cognitive and social psychology, organization theory, economics, and other social sciences (Sterman, 2000). System dynamics models are formal and can be executed, like our other models.
System dynamics is particularly relevant for complex systems. System dynamics makes it possible, for example, to understand and predict instances of policy resistance or the tendency for well-intentioned interventions to be defeated by the response of the system to the intervention itself. In related but separate research, Marais and Leveson are working on defining archetypical system dynamics models often associated with accidents to assist in creating the models for specific systems (Marais & Leveson, 2003).
Figure 8.4 shows a simple systems dynamics model of the Columbia accident. This model is only a hint of what a complete model might contain. The loops in the figure represent feedback control loops where the ‘+’ or ‘-’ on the loops represent polarity or the relationship (positive or negative) between state variables: a positive polarity means that the variables move in the same direction while a negative polarity means that they move in opposite directions. There are three main variables in the model: safety, complacency, and success in meeting launch rate expectations.
The control loop in the lower left corner of Figure 8.4, labeled R1 or Pushing the Limit, shows how, as external pressures increased, performance pressure increased, which led to increased launch rates and thus success in meeting the launch rate expectations, which in turn led to increased expectations and increasing performance pressures. This, of course, is an unstable system and cannot be maintained indefinitely – note the larger control loop, B1, in which this loop is embedded, is labeled Limits to Success. The upper left loop represents part of the safety program loop. The external influences of budget cuts and increasing performance pressures that reduced the priority of safety procedures led to a decrease in system safety efforts. The combination of this decrease along with loop B2 in which fixing problems increased complacency, which also contributed to reduction of system safety efforts, eventually led to a situation of (unrecognized) high risk. One thing not shown in the diagram is that these models can also contain delays. While reduction in safety efforts and lower prioritization of safety concerns may lead to accidents, accidents usually do not occur for a while, so false confidence is created that the reductions are having no impact on safety and therefore pressures increase to reduce the efforts and priority even further as the external performance pressures mount.
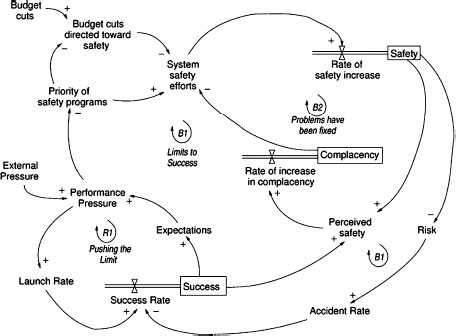
Figure 8.4: Simplified model of the dynamics behind the shuttle Columbia loss
The models can be used to devise and validate fixes for the problems and to design systems to be more resilient. For example, one way to eliminate the instability of the model in Figure 8.4 is to anchor the safety efforts by, perhaps, externally enforcing standards in order to prevent schedule and budget pressures from leading to reductions in the safety program. Other solutions are also possible. Alternatives can be evaluated for their potential effects and impact on system resilience using a more complete system dynamics model, as described in the next section.
Often, degradation of the control structure involves asynchronous evolution, where one part of a system changes without the related necessary changes in other parts. Changes to subsystems may be carefully designed, but consideration of their effects on other parts of the system, including the control aspects, may be neglected or inadequate. Asynchronous evolution may also occur when one part of a properly designed system deteriorates. The Ariane 5 trajectory changed from that of the Ariane 4, but the inertial reference system software did not. One factor in the loss of contact with the SOHO (Solar Heliospheric Observatory) spacecraft in 1998 was the failure to communicate to operators that a functional change had been made in a procedure to perform gyro spin-down.
Besides constraints and hierarchical levels of control, a third basic concept in STAMP is that of process models. Any controller – human or automated – must contain a model of the system being controlled. For humans, this model is generally referred to as their mental model of the process being controlled, cf. Figure 8.5.

Figure 8.5: Role of models in control
For effective control, the process models must contain the following: (1) the current state of the system being controlled, (2) the required relationship between system variables, and (3) the ways the process can change state. Accidents, particularly system accidents, frequently result from inconsistencies between the model of the process used by the controllers and the actual process state; for example, the lander software thinks the lander has reached the surface and shuts down the descent engine; the Minister of Health has received no reports about water quality problems and believes the state of water quality in the town is better than it actually is; or a mission manager believes that foam shedding is a maintenance or turnaround issue only. Part of our modeling efforts involves creating the process models, examining the ways that they can become inconsistent with the actual state (e.g., missing or incorrect feedback), and determining what feedback loops are necessary to maintain the safety constraints.
When there are multiple controllers and decision makers, system accidents may also involve inadequate control actions and unexpected side effects of decisions or actions, again often the result of inconsistent process models. For example, two controllers may both think the other is making the required control action, or they make control actions that conflict with each other. Communication plays an important role here. Leplat suggests that accidents are most likely in boundary or overlap areas where two or more controllers control the same process (Leplat, 1987).
A STAMP modeling and analysis effort involves creating a model of the organizational safety structure including the static safety control structure and the safety constraints that each component is responsible for maintaining, process models representing the view of the process by those controlling it, and a model of the dynamics and pressures that can lead to degradation of this structure over time. These models and analysis procedures can be used to investigate accidents and incidents to determine the role played by the different components of the safety control structure and to learn how to prevent related accidents in the future, to proactively perform hazard analysis and design to reduce risk throughout the life of the system, and to support a continuous risk management program where risk is monitored and controlled.
In this chapter, we are concerned with resilience and therefore will concentrate on how system dynamics models can be used to design and analyze resilience, to evaluate the effect of potential policy changes on risk, and to create metrics and other performance measures to identify when risk is increasing to unacceptable levels. We demonstrate their use by modeling and analysis of the safety culture of the NASA Space Shuttle program and its impact on risk. The CAIB report noted that culture was a large component of the Columbia accident. The same point was made in the Rogers Commission Report on the Challenger Accident (Rogers, 1987), although the cultural aspects of the accident was emphasized less in that report.
The models were constructed using both our personal long-term association with the NASA manned space program as well as interviews with current and former employees, books on NASA’s safety culture such as McCurdy (1993), books on the Challenger and Columbia accidents, NASA mishap reports (Gehman, 2003), Mars Polar Lander (Young, 2000), Mars Climate Orbiter (Stephenson, 1999), WIRE (Branscome, 1999), SOHO (NASA/ESA Investigation Board, 1998), Huygens (Link, 2000), etc., other NASA reports on the manned space program (SIAT or Shuttle Independent Assessment Team Report (McDonald, 2000), and others) as well as many of the better researched magazine and newspaper articles.
We first describe system dynamics in more detail and then describe our models and examples of analyses that can be derived using them. We conclude with a general description of the implications for building and operating resilient systems.
System behavior in system dynamics is modeled by using feedback (causal) loops, stock and flows (levels and rates), and the non-linearities created by interactions among system components. In this view of the world, behavior over time (the dynamics of the system) can be explained by the interaction of positive and negative feedback loops (Senge, 1990). The models are constructed from three basic building blocks: positive feedback or reinforcing loops, negative feedback or balancing loops, and delays. Positive loops (called reinforcing loops) are self-reinforcing while negative loops tend to counteract change. Delays introduce potential instability into the system.
Figure 8.6a shows a reinforcing loop, which is a structure that feeds on itself to produce growth or decline. Reinforcing loops correspond to positive feedback loops in control theory. An increase in variable 1 leads to an increase in variable 2 (as indicated by the ‘+’ sign), which leads to an increase in variable 1 and so on. The ‘+’ does not mean the values necessarily increase, only that variable 1 and variable 2 will change in the same direction. If variable 1 decreases, then variable 2 will decrease. A ‘-’ indicates that the values change in opposite directions. In the absence of external influences, both variable 1 and variable 2 will clearly grow or decline exponentially. Reinforcing loops generate growth, amplify deviations, and reinforce change (Sterman, 2000).
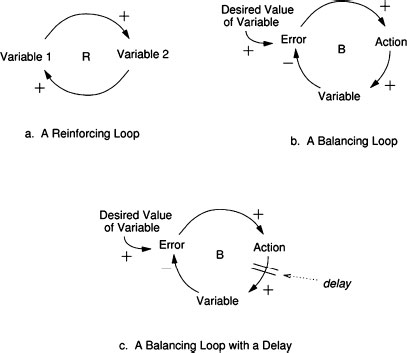
Figure 8.6: The three basic components of system dynamics models
A balancing loop (Figure 8.6b) is a structure that changes the current value of a system variable or a desired or reference variable through some action. It corresponds to a negative feedback loop in control theory. The difference between the current value and the desired value is perceived as an error. An action proportional to the error is taken to decrease the error so that, over time, the current value approaches the desired value.
The third basic element is a delay, which is used to model the time that elapses between cause and effect. A delay is indicated by a double line, as shown in Figure 8.6c. Delays make it difficult to link cause and effect (dynamic complexity) and may result in unstable system behavior. For example, in steering a ship there is a delay between a change in the rudder position and a corresponding course change, often leading to over-correction and instability.
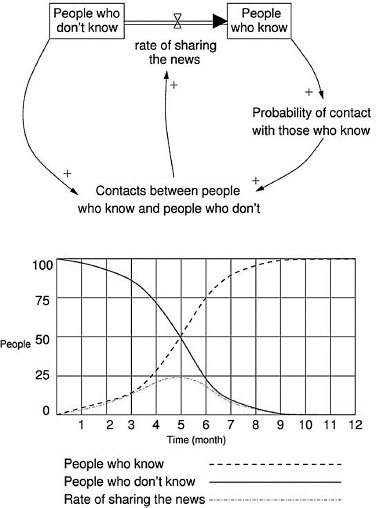
Figure 8.7: An example system dynamics and analysis output
The simple ‘News Sharing’ model in Figure 8.7 is helpful in understanding the stock and flow syntax and the results of our modeling effort. The model shows the flow of information through a population over time. The total population is fixed and includes 100 people. Initially, only one person knows the news, the other 99 people do not know it. Accordingly, there are two stocks in the model: People who know and People who don’t know. The initial value for the People who know stock is one and that for the People who don’t know stock is 99. Once a person learns the news, he or she moves from the left-hand stock to the right-hand stock through the double arrow flow called Rate of sharing the news. The rate of sharing the news at any point in time depends on the number of Contacts between people who know and people who don’t, which is function of the value of the two stocks at that time. This function uses a differential equation, i.e., the rate of change of a variable V, i.e., dV/dt, at time t depends on the value of V(t). The results for each stock and variable as a function of time are obtained through numerical integration. The graph in Figure 8.7 shows the numerical simulation output for the number of people who know, the number of people who don’t know, and the rate of sharing the news as a function of time.
One of the significant challenges associated with modeling a socio-technical system as complex as the Shuttle program is creating a model that captures the critical intricacies of the real-life system, but is not so complex that it cannot be readily understood. To be accepted and therefore useful to risk decision makers, a model must have the confidence of the users and that confidence will be limited if the users cannot understand what has been modeled. We addressed this problem by breaking the overall system model into nine logical subsystem models, each of an intellectually manageable size and complexity. The subsystem models can be built and tested independently and then, after validation and comfort with the correctness of each subsystem model is achieved, the subsystem models can be connected to one another so that important information can flow between them and emergent properties that arise from their interactions can be included in the analysis. Figure 8.8 shows the nine model components along with the interactions among them.
As an example, our Launch Rate model uses a number of internal factors to determine the frequency at which the Shuttle can be launched. That value – the ‘output’ of the Launch Rate model – is then used by many other subsystem models including the Risk model and the Perceived Success by Management models.
The nine subsystem models are:
• Risk
• System Safety Resource Allocation
• System Safety Status
• System Safety Knowledge Skills and Staffing
• Shuttle Aging and Maintenance
• Launch Rate
• System Safety Efforts and Efficacy
• Incident Learning and Corrective Action
• Perceived Success by Management.
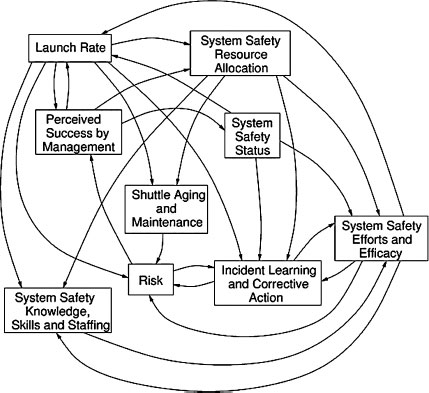
Figure 8.8: The nine submodels and their interactions
Each of these submodels is described briefly below, including both the outputs of the submodel and the factors used to determine the results. The models themselves can be found elsewhere (Leveson et al., 2005).
Risk
The purpose of the technical risk model is to determine the level of occurrence of anomalies and hazardous events, as well as the interval between accidents. The assumption behind the risk formulation is that once the system has reached a state of high risk, it is highly vulnerable to small deviations that can cascade into major accidents. The primary factors affecting the technical risk of the system are the effective age of the Shuttle, the quantity and quality of inspections aimed at uncovering and correcting safety problems, and the proactive hazard analysis and mitigation efforts used to continuously improve the safety of the system. Another factor affecting risk is the response of the program to anomalies and hazardous events (and, of course, mishaps or accidents).
The response to anomalies, hazardous events, and mishaps can either address the symptoms of the underlying problem or the root causes of the problems. Corrective actions that address the symptoms of a problem have insignificant effect on the technical risk and merely allow the system to continue operating while the underlying problems remain unresolved. On the other hand, corrective actions that address the root cause of a problem have a significant and lasting positive effect on reducing the system technical risk.
System Safety Resource Allocation
The purpose of the resource allocation model is to determine the level of resources allocated to system safety. To do this, we model the factors determining the portion of NASA’s budget devoted to system safety. The critical factors here are the priority of the safety programs relative to other competing priorities such as launch performance and NASA safety history. The model assumes that if performance expectations are high or schedule pressure is tight, safety funding will decrease, particularly if NASA has had past safe operations.
System Safety Status
The safety organization’s status plays an important role throughout the model, particularly in determining effectiveness in attracting high-quality employees and determining the likelihood of other employees becoming involved in the system safety process. Additionally, the status of the safety organization plays an important role in determining their level of influence, which in turn, contributes to the overall effectiveness of the safety activities. Management prioritization of system safety efforts plays an important role in this submodel, which in turn influences such safety culture factors as the power and authority of the safety organization, resource allocation, and rewards and recognition for raising safety concerns and placing emphasis on safety. In the model, the status of the safety organization has an impact on the ability to attract highly capable personnel; on the level of morale, motivation, and influence; and on the amount and effectiveness of cross-boundary communication.
System Safety Knowledge, Skills, and Staffing
The purpose of this submodel is to determine both the overall level of knowledge and skill in the system safety organization and to determine if the number of NASA system safety engineers is sufficient to oversee the contractors. These two values are used by the System Safety Effort and Efficacy submodel.
In order to determine these key values, the model tracks four quantities: the number of NASA employees working in system safety, the number of contractor system safety employees, the aggregate experience of the NASA employees, and the aggregate experience of the system safety contractors such as those working for United Space Alliance (USA) and other major Shuttle contractors.
The staffing numbers rise and fall based on the hiring, firing, attrition, and transfer rates of the employees and contractors. These rates are determined by several factors, including the amount of safety funding allocated, the portion of work to be contracted out, the age of NASA employees, and the stability of funding.
The amount of experience of the NASA and contractor system safety engineers relates to the new staff hiring rate and the quality of that staff. An organization that highly values safety will be able to attract better employees who bring more experience and can learn faster than lower quality staff. The rate at which the staff gains experience is also determined by training, performance feedback, and the workload they face.
Shuttle Aging and Maintenance
The age of the Shuttle and the amount of maintenance, refurbishments, and safety upgrades affects the technical risk of the system and the number of anomalies and hazardous events. The effective Shuttle age is mainly influenced by the launch rate. A higher launch rate will accelerate the aging of the Shuttle unless extensive maintenance and refurbishment are performed. The amount of maintenance depends on the resources available for maintenance at any given time. As the system ages, more maintenance may be required; if the resources devoted to maintenance are not adjusted accordingly, accelerated aging will occur.
The original design of the system also affects the maintenance requirements. Many compromises were made during the initial phase of the Shuttle design, trading off lower development costs for higher operations costs. Our model includes the original level of design for maintainability, which allows the investigation of scenarios during the analysis where system maintainability would have been a high priority from the beginning.
While launch rate and maintenance affect the rate of Shuttle aging, refurbishment and upgrades decrease the effective aging by providing complete replacements and upgrade of Shuttle systems such as avionics, fuel systems, and structural components. The amount of upgrades and refurbishment depends on the resources available, as well as on the perception of the remaining life of the system. Upgrades and refurbishment will most likely be delayed or canceled when there is high uncertainty about the remaining operating life. Uncertainty will be higher as the system approaches or exceeds its original design lifetime, especially if there is no clear vision and plan about the future of the manned space program.
Launch Rate
The Launch Rate submodel is at the core of the integrated model. Launch rate affects many parts of the model, such as the perception of the level of success achieved by the Shuttle program. A high launch rate without accidents contributes to the perception that the program is safe, eventually eroding the priority of system safety efforts. A high launch rate also accelerates system aging and creates schedule pressure, which hinders the ability of engineers to perform thorough problem investigation and to implement effective corrective actions that address the root cause of the problems rather than just the symptoms.
The launch rate in the model is largely determined by three factors:
1. Expectations from high-level management: Launch expectations will most likely be high if the program has been successful in the recent past. The expectations are reinforced through a ‘Pushing the Limits’ phenomenon where administrators expect ever more from a successful program, without necessarily providing the resources required to increase launch rate;
2. Schedule pressure from the backlog of flights scheduled: This backlog is affected by the launch commitments, which depend on factors such as ISS commitments, Hubble servicing requirements, and other scientific mission constraints;
3. Launch delays that may be caused by unanticipated safety problems: The number of launch delays depends on the technical risk, on the ability of system safety to uncover problems requiring launch delays, and on the power and authority of system safety personnel to delay launches.
System Safety Efforts and Efficacy
This submodel captures the effectiveness of system safety at identifying, tracking, and mitigating Shuttle system hazards. The success of these activities will affect the number of hazardous events and problems identified, as well as the quality and thoroughness of the resulting investigations and corrective actions. In the model, a combination of reactive problem investigation and proactive hazard mitigation efforts leads to effective safety-related decision-making that reduces the technical risk associated with the operation of the Shuttle. While effective system safety activities will improve safety over the long run, they may also result in a decreased launch rate over the short term by delaying launches when serious safety problems are identified.
The efficacy of the system safety activities depends on various factors. Some of these factors are defined outside this submodel, such as the availability of resources to be allocated to safety and the availability and effectiveness of safety processes and standards. Others depend on the characteristics of the system safety personnel themselves, such as their number, knowledge, experience, skills, motivation, and commitment. These personal characteristics also affect the ability of NASA to oversee and integrate the safety efforts of contractors, which is one dimension of system safety effectiveness. The quantity and quality of lessons learned and the ability of the organization to absorb and use these lessons is also a key component of system safety effectiveness.
Incident Learning and Corrective Action
The objective of this submodel is to capture the dynamics associated with the handling and resolution of safety-related anomalies and hazardous events. It is one of the most complex submodels, reflecting the complexity of the cognitive and behavioral processes involved in identifying, reporting, investigating, and resolving safety issues. Once integrated into the combined model, the amount and quality of learning achieved through the investigation and resolution of safety problems impacts the effectiveness of system safety efforts and the quality of resulting corrective actions, which in turn has a significant effect on the technical risk of the system.
The structure of this model revolves around the processing of incidents or hazardous events, from their initial identification to their eventual resolution. The number of safety-related incidents is a function of the technical risk. Some safety-related problems will be reported while others will be left unreported. The fraction of safety problems reported depends on the effectiveness of the reporting process, the employee sensitization to safety problems, and the possible fear of reporting if the organization discourages it, perhaps due to the impact on the schedule. Problem reporting will increase if employees see that their concerns are considered and acted upon, that is, if they have previous experience that reporting problems led to positive actions. The number of reported problems also varies as a function of the perceived safety of the system by engineers and technical workers. A problem-reporting positive feedback loop creates more reporting as the perceived risk increases, which is influenced by the number of problems reported and addressed. Numerous studies have shown that the risk perceived by engineers and technical workers is different from high-level management perception of risk. In our model, high-level management and engineers use different cues to evaluate risk and safety, which results in very different assessments.
A fraction of the anomalies reported are investigated in the model. This fraction varies based on the resources available, the overall number of anomalies being investigated at any time, and the thoroughness of the investigation process. The period of time the investigation lasts will also depend on these same variables.
Once a hazard event or anomaly has been investigated, four outcomes are possible: (1) no action is taken to resolve the problem, (2) a corrective action is taken that only addresses the symptoms of the problem, (3) a corrective action is performed that addresses the root causes of the problem, and (4) the proposed corrective action is rejected, which results in further investigation until a more satisfactory solution is proposed. Many factors are used to determine which of these four possible outcomes results, including the resources available, the schedule pressure, the quality of hazardous event or anomaly investigation, the investigation and resolution process and reviews, and the effectiveness of system safety decision-making. As the organization goes through this ongoing process of problem identification, investigation, and resolution, some lessons are learned, which may be of variable quality depending on the investigation process and thoroughness. In our model, if the safety personnel and decision-makers have the capability and resources to extract and internalize high-quality lessons from the investigation process, their overall ability to identify and resolve problems and to do effective hazard mitigation will be enhanced.
Perceived Success by Management
The purpose of this submodel is to capture the dynamics behind the success of the Shuttle program as perceived by high-level management and NASA administration. The success perceived by high-level management is a major component of the Pushing the Limit reinforcing loop, where much will be expected from a highly successful program, creating even higher expectations and performance pressure. High perceived success also creates the impression that the system is inherently safe and can be considered operational, thus reducing the priority of safety, which affects resource allocation and system safety status. Two main factors contribute to the perception of success: the accumulation of successful launches positively influences the perceived success while the occurrence of accidents and mishaps have a strong negative influence.
Principal Findings and Anticipated Outcomes/Benefits
The models we constructed can be used in many ways, including understanding how and why accidents have occurred, testing and validating changes and new policies (including risk and vulnerability assessment of policy changes), learning which ‘levers’ have a significant and sustainable effect, and facilitating the identification and tracking of metrics to detect increasing risk. But in order to trust the models and the results from their analysis, the users need to be comfortable with the models and their accuracy.
We first validated each model individually, using (1) review by experts familiar with NASA and experts on safety culture in general and (2) execution of the models to determine whether the results were reasonable.
Once we were comfortable with the individual models, we ran the integrated model using baseline parameters. In the graphs that follow, Figures 8.9-8.13, the arrows on the x-axis (timeline) indicate when accidents occur during the model execution (simulation). Also, it should be noted that we are not doing risk assessment, i.e., quantitative or qualitative calculation of the likelihood or severity of an accident or mishap. Instead, we are doing risk analysis, i.e., trying to understand the static causal structure and dynamic behavior of risk or, in other words, identifying what technical and organizational factors contribute to the level of risk and their relative contribution to the risk level, both at a particular point in time and as the organizational and technical factors change over time.
The first example analysis of the baseline models evaluates the relative level of concern between safety and performance (Figure 8.9). In a world of fixed resources, decisions are usually made on the perception of relative importance in achieving overall (mission) goals. Immediately after an accident, the perceived importance of safety rises above performance concerns for a short time. But performance quickly becomes the dominant concern.

Figure 8.9: Relative level of concern between safety and performance
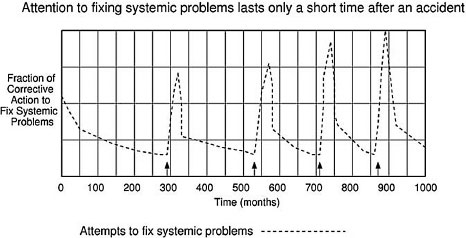
Figure 8.10: Fraction of corrective action to fix systemic safety problems over time
A second example looks at the fraction of corrective action to fix systemic safety problems over time (Figure 8.10). Note that after an accident, there is a lot of activity devoted to fixing systemic factors for a short time, but as shown in the previous graph, performance issues quickly dominate over safety efforts and less attention is paid to fixing the safety problems. The length of the period of high safety activity basically corresponds to the return to flight period. As soon as the Shuttle starts to fly again, performance becomes the major concern as shown in the first graph.
The final example examines the overall level of technical risk over time (Figure 8.11). In the graph, the level of risk decreases only slightly and temporarily after an accident. Over longer periods of time, risk continues to climb due to other risk-increasing factors in the models such as aging and deferred maintenance, fixing symptoms and not root causes, limited safety efforts due to resource allocation to other program aspects, etc.

Figure 8.11: Level of technical risk over time
The analysis described so far simply used the baseline parameters in the integrated model. One of the important uses for our system dynamics models, however, is to determine the effect of changing those parameters. As the last part of our Phase 1 model construction and validation efforts, we ran scenarios that evaluated the impact of varying some of the model factors. Two examples are included here.
In the first example scenario, we examined the relative impact on level of risk from fixing symptoms only after an accident (e.g., foam shedding or O-ring design) versus fixing systemic factors (Figure 8.12). Risk quickly escalates if symptoms only are fixed and not the systemic factors involved in the accident. In the graph, the combination of fixing systemic factors and symptoms comes out worse than fixing only systemic factors because we assume a fixed amount of resources and therefore in the combined case only partial fixing of symptoms and systemic factors is accomplished.

Figure 8.12: Fixing symptoms vs. fixing systemic factors
A second example scenario looks at the impact on the model results of increasing the independence of safety decision makers through an organizational change like the Independent Technical Authority (Figure 8.13). The decreased level of risk arises from our assumptions that the ITA will involve:
• The assignment of high-ranked and highly regarded personnel as safety decision-makers;
• Increased power and authority of the safety decision-makers;
• The ability to report increased investigation of anomalies; and
• An unbiased evaluation of proposed corrective actions that emphasize solutions that address systemic factors.
Note that although the ITA reduces risk, risk still increases over time. This increase occurs due to other factors that tend to increase risk over time such as increasing complacency and Shuttle aging.
Implications for Designing and Operating Resilient Systems
We believe that the use of STAMP and, particularly, the use of system dynamics models can assist designers and engineers in building and operating more resilient systems. While the model-building activity described in this paper involved a retroactive analysis of an existing system, similar modeling can be performed during the design process to evaluate the impact of various technical and social design factors and to design more resilient systems that are able to detect and respond to changes in both the internal system and the external environment. During operations for an existing system, a resilient risk management program would involve (1) deriving and using metrics to detect drift to states of increasing risk and (2) evaluation of planned changes and new policies to determine their impact on system resilience and system risk.

Figure 8.13: The impact of introducing an independent technical authority
The ability for evaluation of design factors and the heightened awareness of the critical shortcomings of an organizational management system or decision-making process is of real value and importance in the real world context that demands ever-increasing performance or productivity. The tension that managers and others in a organization feel as their deadlines are shortened, their resources constrained, and the competition intensifies often allows safety and risk considerations to diminish. Using STAMP and the models we introduce can potentially provide decision-makers with critical insights that can prevent organizations from drifting into less safe behaviors and promote greater adaptability. Organizations that operate in hazardous conditions must make every effort to have proper prevention as well as mitigation activities.
To evaluate the approach in a real setting, we are currently using it to perform a risk and vulnerability analysis of changes to the organizational structure of the NASA manned space program in the wake of the Columbia loss. We plan to follow this analysis up with a field study to determine how well the analysis predicted the risks over time and how accurate the modeling activity was in analyzing the resilience of the new NASA safety organization.