Chapter 12. Database Design Case Study 2
East Coast Aquarium
Many-to-many relationships are often the bane of the relational database designer. Sometimes it is not completely clear that you are dealing with that type of relationship. However, failure to recognize the many-to-many relationship can result in serious data integrity problems.
The organization described in this chapter actually needs two databases, the larger of which is replete with many-to-many relationships. In some cases it will be necessary to create additional entities for composite entities to reference merely to ensure data integrity.
Perhaps the biggest challenge with a database design that works for East Coast Aquarium is the lack of complete specifications. As you will see, the people who will be using the application programs to manipulate the aquarium's two new databases have only a general idea of what the programs must do. Unlike Mighty-Mite Motors—which had the history of working from a large collection of existing forms, documents, and procedures—East Coast Aquarium has nothing of that sort.
Organizational Overview
The East Coast Aquarium is a nonprofit organization dedicated to the study and preservation of marine life. Located on the Atlantic Coast in the heart of a major northeastern U.S. city, it provides a wide variety of educational services to the surrounding area. The aquarium is supported by donations, memberships, fees for private functions, gift shop revenues, class fees, and the small admission fee it charges to the public. Research activities are funded by federal and private grants. To help keep costs down, many of the public service jobs (leading tours, staffing the admissions counter, running the gift shop) are handled by volunteers.
The aquarium grounds consist of three buildings: the main facility, a dolphin house, and a marina where the aquarium's research barge is docked. The centerpiece of the main building is a three-story center tank that is surrounded by a spiral walkway. The sides of the tank are transparent, so that visitors can walk around the tank and observe its residents at various depths.
Note: If you happen to recognize the layout of this aquarium, please keep in mind that only the physical structure of the environment is modeled after anything that really exists. The way the organization functions is purely a product of my imagination, and no comment, either positive or negative, is intended with regard to the real-world aquarium.
The height of the tank makes it possible to simulate the way habitats vary at different ocean depths. Species that dwell on the ocean floor, coral reef fish, and sandbar dwellers therefore are all housed in the same tank, interacting in much the same way as they would in the ocean.
The remaining space on the first floor of the main building (Figure 12-1) includes the gift shop and a quarantine area for newly arrived animals. The latter area is not accessible to visitors. The second floor (Figure 12-2) contains a classroom and the volunteers’ office. Small tanks containing single-habitat exhibits are installed in the outside walls. These provide places to house species that have special habitat requirements or that don't coexist well with other species. The third floor (Figure 12-3) provides wall space for additional small exhibits. It also houses the aquarium's administrative offices.


East Coast Aquarium has two very different areas where it needs data management. The first is in the handling of its animals: where they are housed in the aquarium, where they came from, what they are to be fed, problems that occur in the tanks, and so on. The second area concerns the volunteers, including who they are, what they have been trained to do, and when they are scheduled to work. For this particular organization, the two data environments are completely separate; that is, they share no data. A database designer who volunteers to work with the aquarium staff will therefore prepare two database designs, one to be used by the volunteer staff in the volunteers’ office and the other to be used by the administrative and animal-care staff through the aquarium grounds.
Animal Tracking Needs
Currently, East Coast Aquarium uses a general-purpose PC accounting package to handle its data-processing needs. The software takes care of payroll as well as purchasing, accounts payable, and accounts receivable. Grant funds are managed by special-purpose software that is designed to monitor grant awards and how they are spent.
Although the accounting and grant management packages adequately handle the aquarium's finances, there is no data processing that tracks the actual animals housed in the aquarium. The three people in charge of the animals have expressed a need for the following:
▪ An “inventory” of which species are living in which locations in the aquarium. Some species can be found in more than one tank, and several tanks in addition to the central tank contain more than one species. For larger animals, such as sharks and dolphins, the head animal keeper would like a precise count. However, for small fish that are often eaten by large fish and that breed in large numbers, only an estimate is possible. The animal handling staff would like to be able to search for information about animals using either the animal's English name or its Latin name.
▪ Data about the foods each species eats, including how much should be fed at which interval. The head animal keeper would like to be able to print out a feeding instruction list every morning to distribute to the staff. In addition, the animal-feeding staff would like to store information about their food inventory. Although purchasing of food is handled by the administrative office, the head animal keeper would like an application program to decrement the food inventory automatically by the amount fed each day and to generate a tickle request whenever the stock level of a type of food drops below the reorder point. This will make it much easier to ensure that the aquarium does not run short of animal food.
▪ Data about the sizes, locations, and habitats of the tanks on the aquarium grounds. Some tanks, such as the main tank, contain more than one habitat, and the same habitat can be found in more than one tank.
▪ Data about tank maintenance. Although the main tank is fed directly from the ocean, the smaller tanks around the walls of the main building are closed environments, much like a saltwater aquarium might be at home. This means that the pH and salinity of the tanks must be monitored closely. The head animal keeper therefore would like to print out a maintenance schedule each day, as well as be able to keep track of what maintenance is actually performed.
▪ Data about where species can be obtained. If the aquarium wants to increase the population of a particular species, and the increase cannot be generated through in-house breeding, then the staff would like to know which external supplier can be contacted. Some of the suppliers sell animals; others, such as zoos or other aquariums, will trade or donate animals.
▪ Problems that arise in the tanks. When animals become ill, the veterinarian wants to be able to view a history of both the animal and the tank in which it is currently living.
▪ Data about the orders placed for animals, in particular the shipments in which animals arrive. Since any financial arrangements involved in securing animals are handled by the administrative office, these data indicate only how many individuals of each species are included on a given order or shipment.
The shipment and problem data are particularly important to the aquarium. When animals first arrive, they are not placed immediately into the general population. Instead, they are held in special tanks in the quarantine area at the rear of the aquarium's first floor. The length of the quarantine period depends on the species.
After the quarantine period has passed and the animals are declared disease-free, they can be placed on exhibit in the main portion of the aquarium. Nonetheless, animals do become ill after they have been released from quarantine. It is therefore essential that records are kept of the sources of animals so that patterns of illness can be tracked back to specific suppliers, if such patterns appear. By the same token, patterns of illnesses in various species housed in the same tank can be an indication of serious problems with the environment in the tank.
The Volunteer Organization
The volunteer organization (Friends of the Aquarium) is totally separate from the financial and animal-handling areas of the aquarium. Volunteers perform tasks that do not involve direct contact with animals, such as leading tours, manning the admissions desk, and running the gift shop. The aquarium has provided office space and a telephone line for the volunteer coordinator and her staff. Beyond that, the Friends of the Aquarium organization has been on its own as far as securing office furniture and equipment.
The recent donation of a PC now makes it possible for the volunteers to input some of the volunteer data online, although the scheduling is still largely manual. Currently, the scheduling process works in the following way:
▪ The person on duty in the volunteers’ office receives requests for volunteer services from the aquarium's administrative office. Some of the jobs are regularly scheduled (for example, staffing the gift shop and the admissions desk). Others are ad hoc, such as a request from a teacher to bring her class for a tour.
▪ The volunteer doing the scheduling checks the list of volunteers to see who is trained to do the job requested. Each volunteer's information is recorded in a data file that contains the volunteer's contact data along with the volunteer's skills. A skill is a general expression of something the volunteer knows how to do, such as lead a tour for elementary school children. The volunteer's information also includes an indication of when that person is available to work.
▪ The volunteer doing the scheduling searches the file for those people who have the required skills and have indicated that they are available at the required time. Most volunteers work on a regularly scheduled basis either at the admissions desk or in the gift shop. However, for ad hoc jobs, the person doing the scheduling must start making telephone calls until someone who is willing and able to do the job is found.
▪ The volunteer is scheduled for the job by writing in the master scheduling notebook. As far as the volunteer coordinator is concerned, a job is an application of a skill. Therefore, a skill is knowing how to lead a tour for elementary school students, while a job that applies that skill is leading a tour of Mrs. Brown's third-graders at 10 AM on Thursday.
One of the things that is very difficult to do with the current scheduling process is keeping track of the work record of each individual volunteer. The aquarium holds a volunteer recognition luncheon once a year, and the volunteer organization would like to find an easy way to identify volunteers who have put in an extra effort so they can be recognized at that event. In contrast, the volunteer organization would also like to be able to identify volunteers who rarely participate—the people who stay on the volunteer rolls only to get free admission to the aquarium—as well as people who make commitments to work but do not show up. (The latter are actually far more of a problem than the former.)
The Volunteers Database
In terms of scope, the volunteers database is considerably smaller than the animal-tracking database. It therefore makes sense to tackle the smaller project first. The database designer will create an application prototype and review it with the users. When the users are satisfied and the designers feel they have detailed information to actually design a database, they will move on to the more traditional steps of creating an ER diagram, tables, and SQL statements.
Note: As you will see, there is a lot involved in creating a prototype. It requires very detailed, intensive work and produces a number of diagrams and/or application program shells. We will therefore look at the volunteers’ prototype in full, but in the interest of length, we will look at only selected aspects of the animal tracking prototype.
Creating the Application Prototype
Given that the specifications of the database are rather general, the first step is to create a prototype of an application program interface. It begins with the opening screen and its main menu board (Figure 12-4). As you can see, when in browse mode, the CASE tool allows users and designers to pull down the menus in the menu bar.
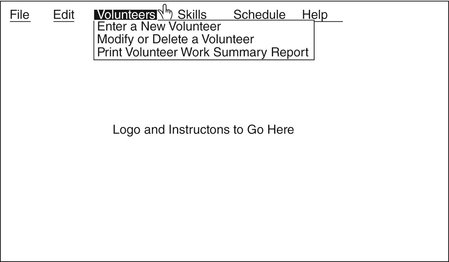
The complete menu tree (with the exception of the Help menu, whose contents are determined by the user interface guidelines of the operating system on which the application is running) can be found in Figure 12-5. Looking at the menu options, users can see that their basic requirements have been fulfilled. The details, however, must be specified by providing users with specific input and output designs.

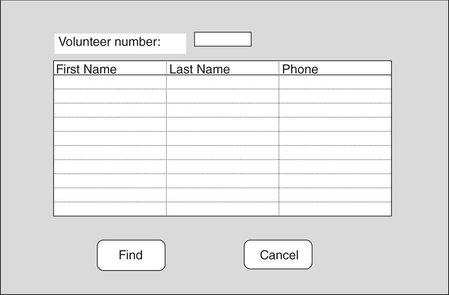
Each menu option in the prototype's main menu has therefore been linked to a screen form. For example, to modify or delete a volunteer, a user must first find the volunteer's data. Therefore the Modify or Delete a Volunteer menu option leads to a dialog box that lets the user either enter a volunteer number or select a volunteer by name and phone number from a list (Figure 12-6). With the prototype, clicking the Find button opens the modify/delete form (Figure 12-7). Users can click in the data entry fields and tab between them, but the buttons at the right of the window are not functional.
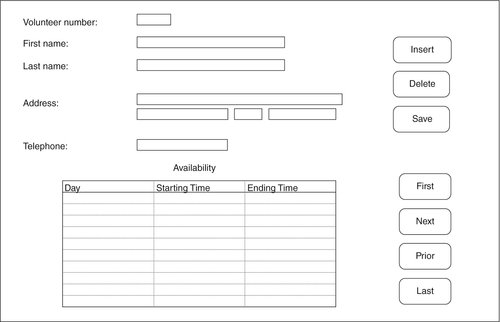
While in browse mode, the CASE tool presents a form as it would appear to the user. However, in design mode, a database designer can see the names of the fields on the form (for example, Figure 12-8). These field names suggest attributes that will be needed in the database.
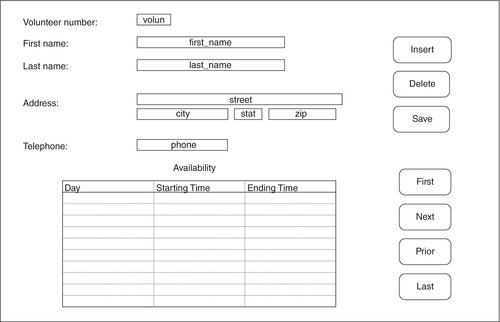
In the case of the volunteer data, it is apparent to the designers that there are at least two entities (and perhaps three) involved with the data that describe a volunteer. The first entity is represented by the single-valued fields occupying the top half of the form (volunteer number, first name, last name, city, state, zip, and phone). However, the availability data—day of the week, starting time, and ending time—are multivalued and therefore must be given an entity of their own. This also implies that there will be a one-to-many relationship between a volunteer and a period of time during which he or she is available.
Note: Should you choose, the field names of a screen prototype can become part of the data dictionary. However, if the field names do not ultimately correspond to column names, their inclusion may add unnecessary complexity to the data dictionary.
The remainder of the prototype application and its forms are designed and analyzed in a similar way:
▪ The volunteer work summary report has been designed to let the user enter a range of dates that the report will cover (see Figure 12-9). The report itself (Figure 12-10) is a control-break report that displays the work performed by each volunteer along with the total hours worked and the number of times the volunteer was a “no show.” The latter number was included because the volunteer coordinator had indicated that it was extremely important to know which volunteers consistently signed up to work and then didn't report when scheduled.

The need to report the “no shows” tells the designers that the schedule table needs to include a Boolean column that indicates whether a person showed up for a scheduled shift. The report layout also includes some computed fields (total hours worked and number of no shows) that contain data that do not need to be stored but can be generated when the report is displayed.
▪ Entering a new skill into the master list requires only a simple form (Figure 12-11). The end user sees only the description of a skill. However, the database designers know that the best way to handle an unstructured block of text is to assign each description a skill number, which can then be used as a foreign key throughout the database. Users, however, do not necessarily need to know that a skill number is being used; they will see just the text descriptions.

▪ To assign skills to a volunteer, the end user must first find the volunteer. The application can therefore use a copy of the dialog box in Figure 12-6. In this case, however, the Find button leads to the form in Figure 12-12.
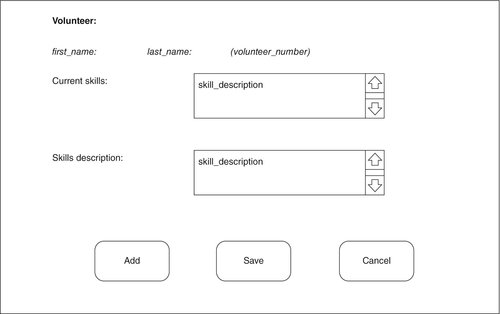
A database designer will recognize quickly that there is a many-to-many relationship between a skill and a volunteer. There are actually three entities behind Figure 12-12: the skill, the volunteer, and the composite entity that represents the relationship between the two. The skill entry form displays data from the volunteer entity at the top, data from the composite entity in the current skills list, and all skills not assigned from the skills table in the skill description list. Of course, the foreign key used in the composite entity is a skill number, but the user sees only the result of a join back to the skills table that retrieves the skill description.
Note: Database integrity constraints will certainly prevent anyone from assigning the same skill twice to the same volunteer. However, it is easier if the user can see currently assigned skills. Then the application can restrict what appears in the skill description list to all skills not assigned to that volunteer. In this case, it is a matter of user interface design rather than database design.
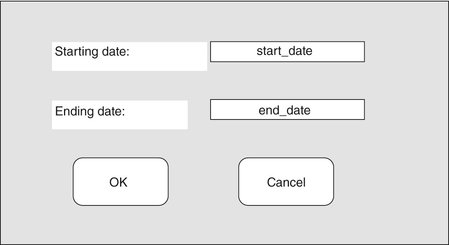
▪ To find the volunteers available to perform a specific job, the volunteers’ application needs a form like the one in Figure 12-13. The end user enters the date and time of the job and chooses the skill required by the job. Clicking the Search button fills in the table at the bottom of the form with the names and phone numbers of volunteers who are theoretically available.

Of all the outputs produced by this application, finding available volunteers is probably the most difficult to implement. The application program must not only work with overlapping intervals of time but also consider both when a volunteer indicates he or she will be available and when a volunteer is already scheduled to work. In most cases, however, a database designer does not have to write the application program code. The designer needs only to ensure that the data necessary to produce the output are present in the database.
▪ Once the person doing the volunteer scheduling has located a volunteer to fill a specific job, then the volunteer's commitment to work needs to become a part of the database. The process begins by presenting the user with a Find Volunteer dialog box like that in Figure 12-6. In this case, the Find button is linked to the Schedule Volunteer window (Figure 12-14). A database designer will recognize that this is not all the data that must be stored about a job, however. In particular someone will need to record whether the volunteer actually appeared to do the scheduled job on the day of the job; this cannot be done when the job is scheduled initially.

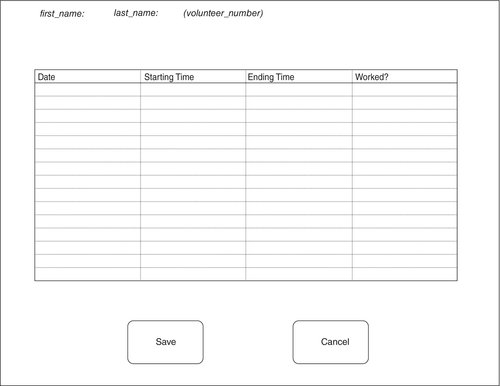
▪ To record attendance, an end user first locates the volunteer using a Find Volunteer dialog box (Figure 12-6), which then leads to a display of the jobs the volunteer has been scheduled to do in reverse chronological order (see Figure 12-15). For those jobs that have not been performed, the End Time and Worked? Columns will be empty. The user can then scroll the list to find the job to be modified and enter values for the two empty columns. The fields on this form, plus those on the job scheduling form, represent the attributes that will describe the job entity.
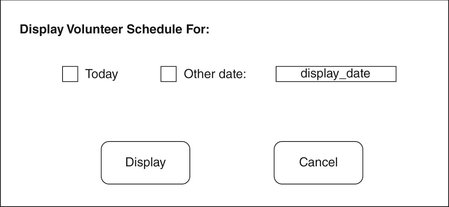
▪ To print a daily schedule, an end user first uses a dialog box to indicate the date for which a schedule should be displayed (Figure 12-16). The application program then assembles the report (Figure 12-17). To simplify working with the program, the application developers should probably allows users to double-click on any line in the listing to open the form in Figure 12-15 for the scheduled volunteer. However, this capability will have no impact on the database design.

Note: A smart database designer, however, would discuss any output that involves something as difficult as evaluating overlapping time intervals with application programmers to ensure that the output is feasible, not only in terms of data manipulation but of performance as well. There is no point in specifying infeasible output.
Creating the ER Diagram
From the approved prototype of the application design and conversations with the volunteers who do volunteer scheduling, the database designers can gather enough information to create a basic ER diagram for the volunteers’ organization. The designers examine each screen form carefully to ensure that the database design provides the attributes and relationships necessary to generate the output.
At first, the ER diagram (Figure 12-18) may seem overly complex. However, two of the entities—state and day—are present for referential integrity purposes, ensuring that abbreviations for state and day names are entered consistently. The relationships among volunteers, jobs, and skills also aren't quite as simple as they might seem at first, in part because there are several many-to-many relationships:

▪ There is a many-to-many relationship between volunteers and skills, which is handled by the skills_known entity.
▪ Because a job may require more than one volunteer, there is a many-to-many relationship between volunteers and jobs that is handled by the volunteer_scheduled entity.
▪ A job may require more than one skill and a skill is used on many jobs. The many-to-many relationship between a job and a skill is therefore handled by the job_skill_required entity.
What makes the situation a bit more complex is that the meaning of the M:M relationship between job and skill (through job_skill_required) is used differently than the relationship between volunteer_scheduled and job_skill_required. A row is added to job_skill_required for each skill required by a job; these data are available when the job is requested. As volunteers are scheduled for the job, rows are added to volunteer_scheduled, creating the relationship between that entity and job_skill_required. (This is essential for determining the correct volunteers still needed to be scheduled for specific skills for a specific job.) The foreign key in volunteer_scheduled uses one column from the table's primary key (job_numb) and one non-key attribute (skill_numb). Nonetheless, that concatenation is exactly the same as the primary key of the job_skill_required table (same columns with the same meaning).
Designing the Tables
The ER diagram in Figure 12-18 produces the following tables:
volunteer (volunteer_numb, first_name, last_name, street, city, state_code, zip, phone)
state (state_code, state_name)
availability (volunteer_numb, day_code, start_time, end_time)
day (day_code, day_name)
skill (skill_numb, skill_description)
skills_known (volunteer_numb, skill_numb)
job (job_numb, job_description, job_date, job_start_time, estimated_duration, numb_volunteers_needed)
job_skill_required (job_numb, skill_numb, numb_volunteers_with_skill)
volunteer_scheduled (volunteer_numb, job_numb, skill_numb)
Generating the SQL
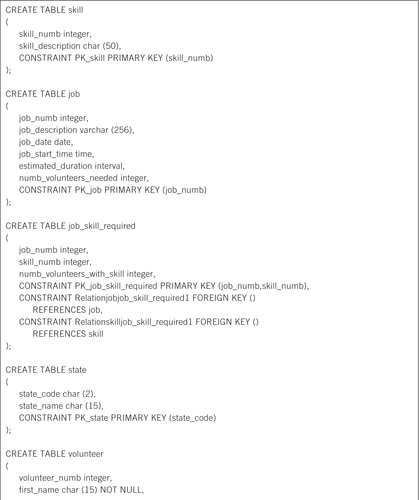
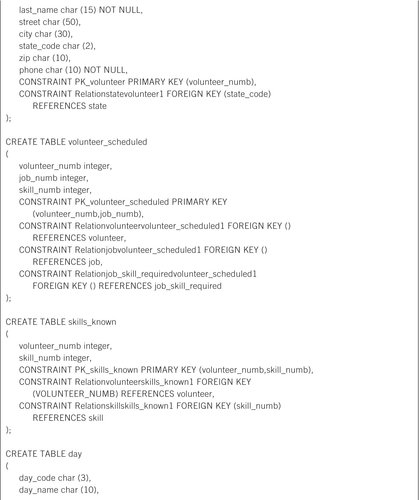
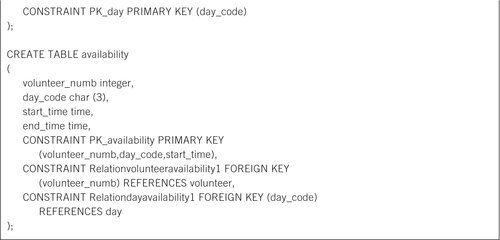
The nine tables that make up the volunteers database can be created with the SQL in Figure 12-19. Notice that some of the attributes in the volunteers table have been specified as NOT NULL. This constraint ensures that at least a name and phone number are available for each volunteer.
The Animal Tracking Database
The animal tracking database is considerably bigger than the volunteers database. The application that will manipulate that database therefore is concomitantly larger, as demonstrated by the menu tree in Figure 12-20. (The File and Edit menus have been left off so the diagram will fit across the width of the page. However, they are intended to be the first and second menus from the left, respectively. A Help menu can also be added along the right stage.)

The functionality requested by the animal handlers falls generally into four categories: the locations (the tanks) and their habitats, the species, the food, and the sources of animals. The organization of the application interface therefore was guided by those groups.
Highlights of the Application Prototype
The screen and report layouts designed for the animal tracking application provide a good starting place for the database designers to identify the entities and attributes needed in the database. As with the volunteers’ application, there is not necessarily a one-to-one correspondence between an entity and an output.
Note: One common mistake made when designing the interface of database application programs is using one data entry form per table. Users do not look at their environments in the same way as a database designer, however, and often the organization imposed by tables does not make sense to the users. Another benefit of prototyping is therefore that it forces database and application designers to adapt to what the users really need, rather than the other way around.
Food Management
One of the important functions mentioned by the aquarium's animal handlers was management of the aquarium feeding schedule (including what should be fed and what was fed) and the food inventory. First, they wanted a daily feeding schedule that could be printed and carried with them as they worked (for example, Figure 12-21). They also wanted to be able to record when animals had been fed so that an updated feeding schedule could take prior feedings into account. Knowing that each species may eat more than one type of food and that each type of food can be eaten by many species, a database designer realizes that there are a number of entities required to implement what the users need:

▪ An entity that describes each species.
▪ An entity that describes each tank in the aquarium.
▪ An entity that describes a type of food.
▪ A composite entity between the species and location entities to record where a specific species can be found.
▪ A composite entity between a species and a type of food recording which food was fed to an animal, when it was fed, and how much of it was fed.
Although it sounds like a separate application to the animal handlers, food inventory management actually requires nothing more than the food entity. The food entity needs to store data about how much food is currently in stock (modified by data from the entity that describes what was fed and by manual entries made when shipments of food arrive) and a reorder point.
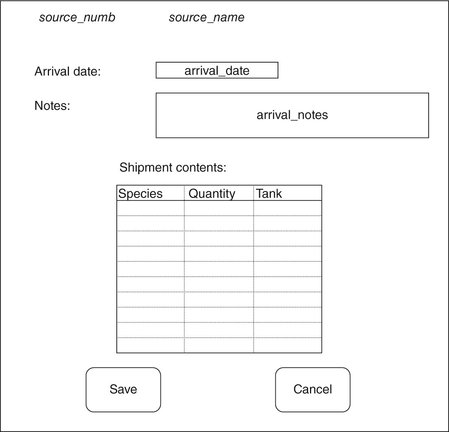
Handling Arriving Animals
When a shipment of animals arrives at the aquarium, animal handlers first check the contents of the shipment against the shipment's paperwork. They then take the animals and place them in the aquarium's quarantine area. The data entry form that the animal handlers will use to store data about arrivals therefore includes a place for entering an identifier for the tank in which the new animals have been placed (Figure 12-22). Given that the aquarium staff needs to be able to locate animals at any time, this suggests that the quarantine tanks should be handled no differently from the exhibit tanks and that there is only one entity for a tank.
After the quarantine period has expired and the animals are certified as healthy, they can be transferred to another location in the building. This means an application program must delete the species from their current tank (regardless of whether it is a quarantine tank or an exhibit tank) and insert data for the new tank. The screen form (Figure 12-23) therefore lets the user identify the species and its current location using pop-up menus. The user also uses a pop-up menu to identify the new location. To the database designer, this translates into the modification of one row (if the species is new to the exhibit tank) or the modification of one row and the deletion of another (if some of the species already live in the exhibit tank) in the table that represents the relationship between a species and a tank. All the database designer needs to do, however, is to provide the table; the application program will take care of managing the data modification.

Problem Analysis
Animal handlers are primarily concerned with the health of the animals in the aquarium. Therefore, it is important that they be able to detect any patterns while analyzing problems that occur in the tanks. Perhaps a single species is experiencing more problems than any other, or perhaps an animal handler is not paying as much attention to the condition of the tanks for which he or she is responsible.
The animal handlers want the information in Figure 12-24 included in the problem summary report. What cannot be seen from the summary screen created by the CASE tool is that the data will appear as a control-break layout. For example, each tank number will appear only once, and each type of animal will appear once for each tank in which it was the victim of a problem.

By the same token, each type of problem will appear once for each tank and species it affected. Only the problem solutions will contain data for every row in the sample output table.
To a database designer, the form in Figure 12-24 suggests the need for five entities:
▪ The species
▪ The tank
▪ The type of problem
▪ A problem occurrence (a type of problem occurring in one tank and involving one species)
▪ Problem solutions (one or more solutions tried for one problem occurrence). There may be many solutions to a single problem occurrence.
One of the best ways to handle problems is to prevent them in the first place. For this reason, the animal handlers also want to include maintenance data in their database.
To make data entry simpler for the end users, the form for entering required maintenance (Figure 12-25) lets a user select a tank and then enter as many maintenance activities as needed.

A database designer views such a form as requiring three entities: the tank, the maintenance activity, and the maintenance required for that tank (a composite entity between the tank and maintenance activity entities).
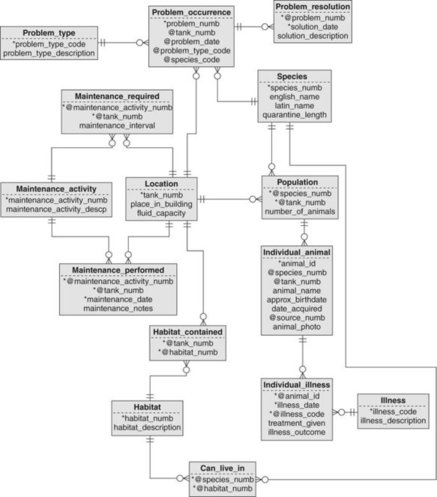
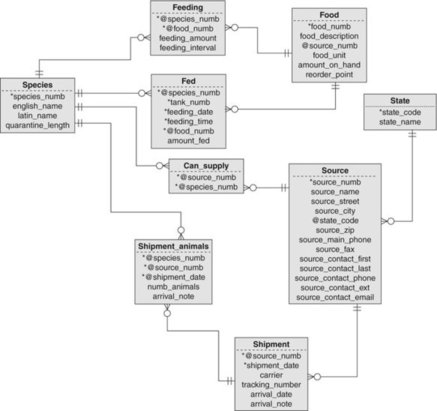
Creating the ER Diagram
After refining the entire application prototype, the database designers for the East Coast Aquarium generate a large interconnected ER diagram. (Part 1 is shown in Figure 12-26 and part 2 is shown in Figure 12-27.) As you can see when examining both figures, the centerpiece is the species entity, which participates in seven different relationships.
▪ Species to location
▪ Location to habitat
▪ Species to habitat
▪ Location to maintenance activity for required maintenance
▪ Location to problem
▪ Species to problem
▪ Species to food
▪ Species to source for ability of source to supply the species
▪ Shipment to species
▪ Illness to individual animal for tracking the condition of mammals and other large animals
The relationships involving location, problem, and species are particularly interesting. On the surface, there appears to be a many-to-many relationship between a tank and a type of problem. By the same token, there appears to be another many-to-many relationship between a species and a type of problem. The problem is that if the database maintained the two separate relationships, each with its own individual composite entity, then it will be impossible to determine which species was affected by which problem in which tank. To resolve the issue, the designer uses a three-way composite entity—problem_occurrence—that relates three parent entities (location, problem, and species) rather than the traditional two. Semantically, a problem occurrence is one type of problem affecting one species in one location, and therefore identifying it in the database requires all three parent entities.
In contrast, why is there no three-way composite entity among species, location, and habitat? As with the preceding example, there is a many-to-many relationship between species and location and a many-to-many relationship between habitat and location. The answer once again lies in the meaning of the relationships. Were we to create a single composite entity relating all three entities, we would be asserting that a given species lives in a given habitat in a given location. However, the animal handlers at the aquarium know that this type of data is not valid, particularly because if an animal lives in a tank with many habitats, it may move among multiple habitats. Instead, the relationship between species and habitat indicates all habitats in which a species can live successfully, and the relationship between location and habitat indicates the habitats present in a tank.
The remainder of the many-to-many relationships are the typical two-parent relationships that you have already seen in this book. The only aspect of these relationships that is the least bit unusual is the two relationships between maintenance activity and location. Each relationship has a different meaning (scheduled maintenance versus maintenance actually performed). The design therefore must include two composite entities, one to represent the meaning of each individual relationship.
Note: There is no theoretical restriction to the number of relationships that can exist between the same parent entities. As long as each relationship has a different meaning, there is usually justification for including all of them in a database design.
Creating the Tables
The ER diagrams translate to the following tables:
species (species_numb, English_name, latin_name, quarantine_length)
location (tank_numb, place_in_building, fluid_capacity)
population (species_numb, tank_numb, number_of_animals)
individual_animal (animal_id, species_numb, tank_numb, animal_name, approx_birth_date, source_numb, animal_photo)
illness (illness_code, illness_description)
individual_illness (animal_id, illness_date, illness_code, treatment_given, illness_outcome)
habitat (habitat_numb, habitat_description)
habitat_contained (tank_numb, habitat_numb)
can_live_in (species_numb, habitat_numb)
problem_type (problem_type_code, problem_type_description)
problem_occurrence (problem_numb, tank_numb, problem_date, problem_type_code, species_code)
problem_resolution (problem_numb, solution_date, solution_description)
maintenance_activity (maintenance_activity_numb, maintenance_activity_desc)
maintenance_required (maintenance_activity_numb, tank_numb, maintenance_interval)
maintenance_performed (maintenance_activity_numb, tank_numb, maintenance_date, maintenance_notes)
feeding (species_numb, food_numb, feeding_amount, feeding_interval)
fed (species_numb, tank_numb, feeding_date, feeding_time, food_numb, amount_fed)
state (state_code, state_name)
source (source_numb, source_name, source_street, source_city, state_code, source_zip, source_main_phone, source_fax, source_contact_first, source_contact_last, source_contact_phone, source_contact_ext, source_contact_email)
can_supply (source_numb, species_numb)
shipment (source_numb, shipment_nate, carrier, tracking_number, arrival_date, arrival_note)
shipment_animals (species_numb, source_numb, shipment_date, numb_animals, arrival_note)
Choosing a primary key for the problem occurrence table presents a bit of a dilemma. Given that a problem occurrence represents a relationship among a problem type, a tank, and a species, the theoretically appropriate primary key is a concatenation of the problem type, the tank number, the species number, and the problem date. However, this is an extremely awkward primary key to use as a foreign key in the problem_resolution table. Although it is unusual to give composite entities arbitrary unique keys, in this case it makes good practical sense.
There are several tables in this design that are “all key” (made up of nothing but the primary key). According to the CASE tool used to draw the ER diagram, this represents an error in the design. However, there is nothing in relational database theory that states that all-key relations are not allowed. In fact, they are rather common when they are needed to represent a many-to-many relationship that has no accompanying relationship data.
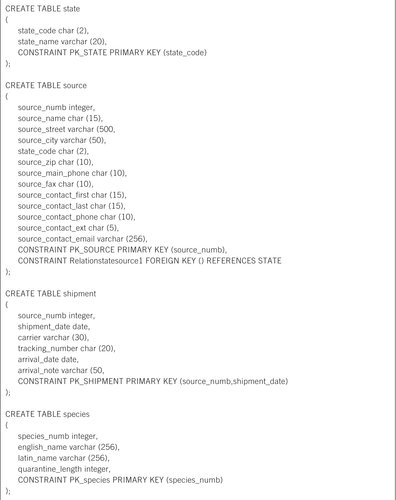
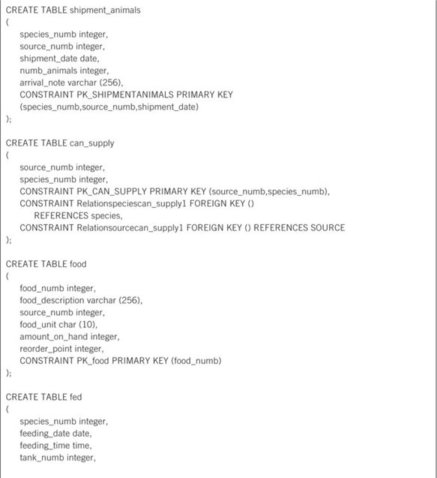
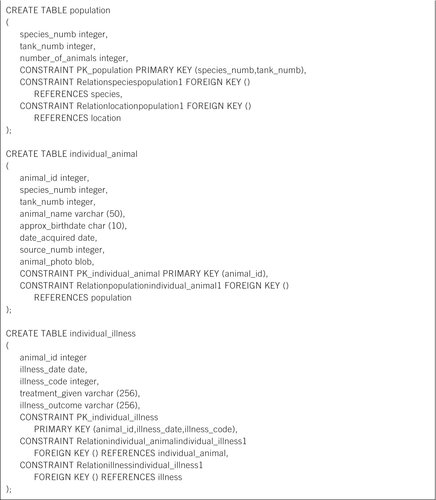
Generating the SQL
The SQL CREATE statements that generate the animal tracking database for East Cost Aquarium can be found in Figure 12-28. Because of the large number of composite entities, there are also a large number of foreign keys. Other than that, the SQL presents no unusual features.


..................Content has been hidden....................
You can't read the all page of ebook, please click here login for view all page.