Chapter 16
Technology and the Music Business
Contents
Introduction
Technological advancements not only launched the music business, but have continually given it a “shot in the arm” just when it needed it most. From stereo to recordable tape to compact discs to digital files to streaming, technology continues to evolve the hardware and software of our industry. Not only has technology changed the format of the business, but technology has changed how the actual business gets done. Technological advancements permeate the core of the record industry, creating the scorecards for success.
Big Data
The term “big data” is used to describe a massive amount of both structured and unstructured data that is so “big” that it’s difficult to process using traditional databases and available software. In most cases, this “big data” is so large or is moving so fast that is exceeds the current ability to process. But—this data holds the potential answers to help companies improve, from making better operational decisions to being more intelligent in the market place. And unlocking “big data” is the next big thing for many companies in the business of digital analysis and applications.
“Big data analytics” takes the process one step further by sifting through the data to uncover patterns and other applicable information. Collecting,
organizing and analyzing large sets of data that are actionable to specific business decisions is big business in today’s market space. Many analytic companies have emerged as business partners to help with the processing of this data by creating interactive tools, hoping to increase their partner’s sales and efficiencies as well as improve operations, customer service and risk management (Beal, 2014).
In recent “data” years, Google Analytics has been a leader in this type of analysis, having created a tool that helps website managers understand the “business” of consumer traffic and how to better design a business’ site to have a favorable outcome—whatever that might be. Simply put, Google Analytics tracks visitors through the website and also tracks of the performance of a marketing campaigns, following keyword searches and tracking popular pages once a searcher has landed.
But this knowledge can be basic, and to understand, as well as act on this information, it can take a big data “tool” provider such as Raven to help “fill in the blanks.” Raven builds dashboards and reports that help businesses understand results of online marketing campaigns including Google Analytics, paid search advertising, search engine optimization and social media marketing. These give great at-a-glance ideas of how a campaign is performing and what needs to be fixed.

Figure 16.1 Raven Tools Dashboard
Entertainment and Big Data
The Nielsen Company has been providing important data to all kinds of products in the U.S. and abroad since the 1920s. In the mid-1930s, the company began to monitor and created an index of radio stations for the U.S. and replicated this concept for television in the 1950s as the format began to penetrate the U.S. marketplace. In doing so, the company established several key measurement devices that have aided in evaluating consumer behavior quarter-over-quarter, year after year. In doing so, Nielsen invented its own vernacular of terms that apply to the entertainment business that are important in evaluating the marketplace:

Figure 16.2
DMA with County Classification
Designated Market Area (DMA)— A term used by Nielsen Media Research to identify an exclusive geographic area of counties in which the home market television stations hold a dominance of total hours viewed. There are 210 DMA’s in the U.S. These markets are listed in order of population—meaning, stratified largest to smallest by size of city. These markets apply to the analysis of music as well.
County Size— The classification of counties according to Census household counts and metropolitan proximity. There are four county size classes “A,” “B,” “C,” and “D.” In general, “A” counties are highly urbanized, “B” counties relatively urbanized, “C” counties relatively rural, and “D” counties very rural. Why is this important? These counties establish the zones known as City, Suburb, or Rural and can help marketers determine strategic plans. As you look at this map of Columbia, Missouri, the DMA is outlined, with urbanized counties A and B in dark and mid shades, relative rural counties C in lighter shades and very rural counties D that are serviced just outlined.
Other Industry Terms
Geographic regions— states are grouped by physical location, which can lead to sales and marketing analysis based on geographic data.
Store types— As an industry standard, stores have been identified by types to aid the industry in identifying source of sales. These store types include Mass Merchants, Traditional Retailers which include chain store and electronic super store, Independent Retailers, Non-traditional Outlets that include online and venue sales, and Digital portals.
Formats— The type of music format that consumer purchase continues to evolve—be it physical or digital. Physical formats include compact discs (CD), vinyl (LP), cassette, and DVD-audio with digital formats including downloads and streaming. Streaming is not included in SoundScan except for the chart numbers.
Other technologies have aided in the data collection of the entertainment business and include the application of inventory management tools as well as digital management devices that allow for the important tracking and processing of royalty payments.
UPC Code— The Universal Product Code contains a unique sequence of numbers that identifies a product. GS1US standards recommend a GS1 company prefix number that identifies a unique code for a specific business. The GTIN (global trade item number) initial numbers, which can vary in size depending on the variety of products the company sells, identify the business, with the last digits identifying the products. The small digit is the “check” digit which validates the barcode equation.

Figure 16.3 Example Universal
Product Code CD Bar Code
Many record companies designate a 5- to 6-digit number that identifies the label. The record company then assigns a 4- to 5-digit product code that identifies the release, including artist and title of the album. The eleventh digit can designate the configuration of the product. The last digit is known as the “check” digit. When scanned, a mathematical equation occurs determining if the product has been correctly scanned. The “check” digit is the “answer” to that equation, verifying an accurate scan. In the U.S., the standard UPC code contains 12 digits.
ISRC Code— For digital product, the ISRC (International Standard Recording Code) is the international identification system for sound recordings and music video recordings. Just like the UPC Code, each ISRC has a unique and permanent sequence of numbers that identifies each specific recording that can be permanently encoded into a product as its digital fingerprint. The encoded ISRC provides the means to automatically identify recordings for royalty payments, key to publishers and songwriters alike. Because these numbers are embedded into the product, this coding system is perfect for the electronic distribution of music, with the ease of adoption into the international music community that has been reliable and cost-effective.
Unlike the sophisticated algorithm of the UPC, the ISRC is an internal tracking code. The codes are simple with origin of country, label or artist identifier, year of creation, and finally song designation number.
A sample code could look like: US ASM 15 00001
To capture sales data, the company that has rights to the digital track gives tracking agencies the ISRC codes and should be imbedded during production. ISRC codes can also be provided by the digital retail portal such as CD Baby.
To learn more about UPC codes go to the GS1US website:
- http://www.gs1us.org/resources/education-and-training/gs1-company-prefix-course
- To learn more about ISRC codes and the application process, check out the International Standard Recording Code website: https://www.usisrc.org/
Billboard and Soundscan
Prior to the invention of barcodes, an prior reporting system based on undocumented sales information was used by Billboard to produce the sales charts. Billboard had a panel of “reporting” retail stores that identified the bestselling record in their store, based on genre. Often times, this information was not supported through actual sales data, but was based on what store managers “thought” was their best seller. Record labels employed retail promotion teams to help influence these reports, hence the sales charts were not always valid depictions of true sales throughout the nation.
Remember, this reporting structure was what was used prior to the creation of barcode scanning systems and the use of point-of-sales data. So capturing accurate sales data was difficult, even for the retailer. The use of barcodes, or UPC (Universal Product Codes) have greatly improved product management. Not only do UPC codes assist in inventory status and reorder generation of hot selling items, the sales information captured allows the retailer to determine the best selling item by store and by chain, as confirmed through real sales data.
With the introduction of barcodes and efficient computer management of inventory, a new idea was introduced. Mike Shallet, an ex-record label promotion guy, along with Mike Fine, a statistician who had previously worked with major newspapers and magazines with a focus on surveys, conceived a revolutionary concept that would use this new-found technology to derive the top-selling records of the week. And in 1991, SoundScan was born.
SoundScan is an information system that tracks sales of music and music video products throughout the United States, Canada, and some international territories as well. Using UPC codes from point-of-sale cash registers, as well as ISRC codes from digital files, sales data is collected weekly from over 14,000 brick-and-mortar and online retail outlets. Weekly data is compiled and made available every Monday. Now owned by Nielsen, SoundScan is the sales source for the Billboard music album charts (www.soundscan.com).
Although 14,000 retail outlets sounds like a lot of stores, SoundScan does not capture all music retailers. Through analysis, SoundScan knows which retailers it does not capture and via statistical equations, is able to derive a representative total. Through nearly the end of 2014, the album that sold the most earned the #1 position for the week on the Billboard Top 200 chart.

Figure 16.4
Nielsen Entertainment Research Products
But the concept of “#1” was understandably challenged since music is consumed in a multitude of ways including streaming through audio and video services and social media outlets. As of November 2014, Billboard changed its Top 200 chart to reflect this new consumership. Although a record that “sells” the most is a notable feat, the artist or the project that has the most “engagement,” including not just sales but audio and video streaming should be considered the #1 act of the week—yes? (Project is defined as total consumption around that album physical and digital sales, TEA and SEA, and all On-Demand audio streaming activity off of that album) New challengers such as Border City Media’s Buzz Angel are entering the market place utilizing additional technologies to assess these matrices. But SoundScan was the first to bring a legitimate assessment and analysis to the industry.
To register music with SoundScan, labels and artists must submit an online form to be included in sales data. http://titlereg.soundscan.com/soundscantitlereg/
A Look at the Soundscan Data
The Charts
By compiling and organizing sales and activity data, SoundScan derives many charts that help describe the marketplace. Know that there are hundreds of charts, subdivided by specific headings. This is the actual data that drives the Billboard Charts.

Figure 16.5 Example of a Billboard Top 200 (Source: Nielsen SoundScan)
As noted in Chapter 7: The Industry Numbers, SoundScan underwent a substantial change of the Top 200 Chart by including not only album sales, but the additional data of TEA (track equivalent album) and SEA (streaming equivalent album) information.
In an attempt to more accurately compare previous years with the current sales trend, SoundScan came up with a unit of measurement called track equivalent albums (TEA), which means that 10 track downloads are counted as a single album. This evaluation is based on a financial equivalent, being a $.99 download x 10 would equal a $9.99 album download or CD. Thus, the total of all the downloaded singles is divided by ten and the resulting figure is added to album downloads and physical album units to give a project picture of “Total” activity reported in Billboard’s Top 200 chart.
Streaming songs generate licenses and royalties from the various sites and add revenue to the bottom line of copyright holders. The s treaming equivalent album (SEA) was introduced in 2013 to measure streaming consumption. To evaluate streaming equivalents, the current industry standard is 1,500 streams of any songs from a particular album are counted as a single album. 1,500 streams x the standard royalty generated by this air-play $.005 = $7.50, being the wholesale price of an album. All of the major on-demand audio subscription services are considered, including Spotify, Beats Music, Google Play, and Xbox Music, Apple Music, Tidal, Amazon Prime, Rhapsody, Rdio and Others. Combine the streaming activity of all the singles from a particular album and divide by 1,500 and the resulting figure is added to the album downloads and physical album units to give a project picture of “total” activity known as the top 200.
Nielsen SoundScan added these two assessments of both TEA and SEA to traditional album sales creating a “total” activity evaluation known now as the Top 200. Looking at the data above, Beyoncé’s new release debuted at #8 selling 42,959 units, even though the #9 position Frozen soundtrack sold more units of 65,054 units. When doing the “math,” the single sales and online streaming of Beyoncé’s record boosted her total activity to bump her release above Disney’s Frozen soundtrack for the week.
| Beyoncé Bey oncé: | 42,959 albums |
| 24,618 TEA = (246,187 / 10 Songs) | |
| 3,431 SEA = (5,146,703/1500 Streams) | |
| 71,008 Total Activity | |
| Disney’s Frozen: | 65,054 albums |
| 4,193 TEA = (41,933 / 10 Songs) | |
| 1,648 SEA = (2,472,511 /1500 Streams) | |
| 70,895 Total Activity |
Music Connect
Recognizing the value of the total picture including physical sales, downloads, streaming, and social and web activity, Nielsen has created another look at all these metrics that allow the industry to evaluate the overall landscape. Music Connect blends a myriad of data points as collected by Nielsen, allowing the reader a dynamic look at an artist’s performance across the various spectrums of the business—in one glance.

Figure 16.5A
Example of a Music Connect Artist Dashboard (Source: Nielsen)
Artist Dashboard
Allowing the user to select a specific time period, an artist’s dashboard report provides deep detail in all metrics including sales by Format: Albums with TEA/SEA and without, albums, singles, videos sales and the streaming activity of the tracks, as well as radio activity, streaming, and social metrics and Web activity from Facebook, Twitter, and Wikipedia. This report also shows year-to-date and activity-to-date cumulative data.
Any metric on the Artist Dashboard can be dynamically toggled on/off to be included on the integrated graph.


Figure 16.5C
Example of collapsed view of Music Connect Artist Dashboard (Source: Nielsen)

Figure 16.5D
Example of a Music Connect Chart Activity Report (Source: Nielsen)

Figure 16.5e
Example of a Music Connect Top 200 (Source: Nielsen)
Chart Activity
The Nielsen Music Connect app provides a mobile access point to Music Connect, featuring the Billboard Top 200 and a myriad of other charts, Artist/Album/Song reports with sales (with and without TEA & SEA), streaming, radio airplay and social data with capability to create unlimited favorite lists and share any report, as well as industry-level stats.
Music Connect is an analytical tool utilizing the sales data from Sound-Scan and the radio and streaming activity from Broadcast Data Systems as well as other Nielsen data collection services which help marketers of the music industry create better strategies in reaching end consumers. Nielsen Music Connect will incorporate all of Nielsen’s current capabilities in music measurement in one interface and replace their current Nielsen SoundScan and Nielsen Broadcast Data Systems tools.
But to continue on with classic SoundScan charts, here are several more samples of valuable data tools supplied by SoundScan.

Figure 16.6
Example of a Year-To-Date (YTD) Album Chart (Source: Nielsen SoundScan)

Figure 16.7
Example of Hot 100 Singles Chart (Source: Nielsen SoundScan)
The Hot 100 Singles chart is created from a combination of single sales, radio airplay and video/audio streams, as calculated by Nielsen. Utilizing the sales of downloaded tracks combined with the sales of the available singles at retail, Billboard calculates the data with audience information captured by BDS that listens to all formats of radio—from top 40 and hip-hop to country, Latin, and rock—along with both video and audio streaming, the Hot 100 Singles chart is created.

Figure 16.8
Example of Hot Digital Tracks Chart (Source: Nielsen)
The Hot Digital Tracks report acts as a barometer as to the next big single or the next up-and-coming act that will break through onto the marketplace. With digital sales representing over half of all music sold, labels have retooled their business models by looking at the single (and this chart) as a money-making entity, rather than focusing on the album.
Soundscan Marketing Reports
SoundScan creates various marketing charts that analyze the marketplace by segmenting sales into many categories.
When reading the YTD—Sales by Format Genre Album report, add (000) to the end of the units to accurately depict album sales by genre. Note that the CD format still dominates sales, but that digital is gaining share. Additionally, certain releases can be counted twice since they may be considered in more than one genre. Note: Core Genre reports are one and only one.
What is not calculated in this report are the genre percentages as they relate to the total. This information is in year-to-date summary reports generated by under Chart information, and can be isolated to DMA performance as well.

SoundScan Label Market Share Report
The Label Share Report shows the percentage of the market by distribution companies, as well as indies year ending on December 30, 2012. Each distributor, shown as Level 1, has “owned” labels that are part of the conglomerate, and “distributed” labels that have contracted the distributor to place their records into the marketplace, which are noted as Level 2. Label groups have sub-labels that are noted as Level 3. Each label is part of the cumulative percentage.
As an example, WEA 1) is considered the primary distributor with owned labels, 2) within the conglomerate family such as Warner Brothers and Atlantic. Through their A.D.A. Indie Distributor, Fueled By Ramen and Bad Boy Record Labels 3) are recognized, with their billing realized within the distribution family, but these labels are independents who have contracted their distribution function with WEA ADA’s Independent Distributor.
From a competitive standpoint, this data allows distributors and their labels to evaluate their performance as it compares to others. This data is compiled weekly, monthly, and year-to-date.


Marketing Report: YTD Percent Sales by DMA/Genre
The YTD Percentage of Sales by DMA/Genre report calculates the percentage of music sold in a specific DMA by genre. DMA stands for designated market area with the regions being derived by Nielsen, the company that calculates television ratings.
In the YTD Percent Sales chart shown below (Table 16.11), the New York DMA purchased 6.76% of all records sold. In other words, for every 100 records sold, nearly seven are purchased in the New York DMA.

Figure 16.11
Sample Marketing Report: YTD—% Sales by DMA/Genre Album (Source: Nielsen)
Additionally, the New York DMA purchased 9.6% of all classical records sold, making NY a ripe market for classical music. In this case, for every 100 records sold in the classical genre, nearly 10 records are purchased in the New York DMA and that is nearly 4% higher than the second best market, Los Angeles.
This report helps marketers to look at DMAs as a whole. Labels can compare the percentage of their artists’ sales to that of the overall market, seeing if an artist’s sales have over or under performed.
National Sales Summary Report
This report denotes sales by store type, geographic region, and population density. Note that Digital stores sold the most, with mass merchants being next. Chain stores include electronic superstores, as well as retail chains. Non-traditional retailers include Urban Outfitters and Hot Topic.

Figure 16.12
Example Summary Report: National Sales by Strata (Source: Nielsen)
Although cities have higher population density per square mile, suburban areas out-purchase the city geographic marketplace, with the rural areas following close behind in purchasing power. The exception to this sales power is the independent stores, where there is less representation.
Border City Media’s BuzzAngle Music
Border City Media, Inc. was formed in 2013, and is part of the “big data” movement, filling a void in the music industry by providing sophisticated tools needed to effectively analyze all the new platforms that people are using to consume music. Border City Media has developed a new, state-of-the-art service called BuzzAngle Music, which is a comprehensive tool that can analyze total music consumption, such as physical and digital album sales, song sales, streaming history, airplay history as well as social media metrics, all on a daily basis. Comparative statistics to the industry or selected artists, genres, retailers, geographies are created for benchmarking and highlight areas of opportunity.
What sets BuzzAngle Music apart is its ability to drill down on the data, answering very specific questions regarding a multitude of situations such as:
- “What are the best performing markets for on-demand audio streaming over the last six weeks?”
- “How did my label do in selling vinyl records released in the last three months at mom & pop stores in Des Moines, IA?”
- “How has the deluxe version of the album sold compared to the standard version each day after the launch of a Target advertisement featuring the deluxe version?”
- “What other songs on an album are receiving strong growth in sales and streams which could help the record label determine next single choice for radio airplay?”
- “As an artist, when should I conduct my social media promotion for a new album or song to maximize total consumption value?”
These types of questions can easily be answered utilizing BuzzAngle Music’s filtering system—along with its multitude of reports that create easy-to-read graphics.
BuzzAngle Music’s sources of data are comprehensive, with the majority of players from all supplier categories, including the large physical retailers, large digital retailers, large streaming services, radio airplay providers, independent music stores, artist’s e-commerce websites, venues (concerts, etc.), as well as non-traditional outlets such as restaurants, clothing stores, drug stores, etc.
The System
BuzzAngle Music is a tool that allows the user to interact directly with the data. Rather than provide pre-processed charts and data, the system allows users to create the reports, charts, and dashboard views that are specific to their needs. Each report has options and filters that allow for modifying the data parameters along with the date of the data search. This results in an exhaustive number of possible charts and dashboards, literally in the trillions of possible combinations.

Figure 16.13
Border City Media BuzzAngle Chart Offerings and Dashboard Summaries
The menu system provides the ability to choose the type of report they want to see, whether a ranking of albums, songs, artists, singles, music videos, or distributors. The sub-menu allows the user to select the criteria for the ranking, e.g., song-ranking report by streams.
Dashboards are available for artists, albums, songs, genres, geographical market areas, distributors, and industry-wide totals.
Definition of Project Units
Border City Media has already been revolutionary in the industry by providing the first daily total consumption report using a blended, weighted-value metric they call Project Units, which more accurately measures the success of an entire musical project, including album sales, song sales, song streams, and song airplay. BuzzAngle Music uses a weighted-value formula that converts each individual disparate consumption unit into a common project unit both for albums and sales. The default weighted-value equivalents are:
- 1 Album Sale = 1 Album Project Unit
- 1 Song Sale = 1 Song Project Unit
- 10 Songs Project Units = 1 Album Project Unit
- 150 On-Demand Streams = 1 Song Project Unit
- 300 Programmed Streams (Internet Radio) = 1 Song Project Unit
- 300 Radio Spins = 1 Song Project Unit
The system also provides users the ability to change the weighted-value equivalents so that they can do their own scenario analysis.

Figure 16.14
BuzzAngle Settings Window Allowing for Change in Weighted-Value Analysis
Reports
A sample look at the Album/Project chart reveals a comprehensive view of all matrices deriving a Top Project ranking for the week. You will see the total Project units that include album sales, song sales and song streams for each title. This graphic is unable to show all the columns that make up the total project unit number. but know this chart represents a total snapshot of an artist’s album/project as it ranks against others.

Figure 16.15
BuzzAngle Album Project Ranking Chart

Figure 16.16
BuzzAngle Action Buttons for Multiview of Data
Drill-down capability for each title is possible by clicking on an action-button menu that reveals multiple ways to view the data, such as album sales by UPC number, geography breakdown and a total performance snapshot for the songs on that album:

Figure 16.17 BuzzAngle UPC/EAN Breakdown: V by Maroon 5

Figure 16.18 BuzzAngle Geography Report: Dreams Worth More Than Money by Meek Mill
Report Filters
On each BuzzAngle Music report, there is an extensive selection of filters available to further refine the data set:

Figure 16.19
BuzzAngle Album Project Ranking
Table 16.11 BuzzAngle Dashboard Setting
| View Settings | # of total items to be ranked, rank criteria (units vs. growth over last period) |
| Timespan | Presets for Last Day, Week-to-Date, Last Week, etc. or a date range |
| Consumption Types | Filters for sub-elements of a consumption type; for example, album filters for CD or digital only, streaming filters for just audio or video streams, airplay filters for specific radio station formats or day parts. |
| Advanced Filters | Selecting releases by age of release or specific genres, artists, albums, songs, labels or distributors |
| Location | Selecting specific geographies or outlet types within those geographies (large physical retailers, large digital retailers, bookstores, venues, etc.) |
Dashboards
Dashboards are available for artists, albums, songs, genres, geographical market areas, distributors and industry-wide totals. On each dashboard, there are individual elements (widgets) that provide a specific view of the data pertinent to that artist, album or song. There are widgets for overall trends, song breakdowns, market area breakdowns, etc. Each widget has filters, which can order up a finer look at the data. The dashboard below shows an inclusive look at all of Maroon 5’s releases with the sales, radio, and streaming action of all releases for the band.
One click on Maroon 5’s V album hotlink, and the next dashboard reveals a deeper dive on just the V album’s sales, radio, and streaming.

Figure 16.20
BuzzAngle Artist Dashboard: Maroon 5


One more click on “Animals” gives the viewer a look at that song’s overall performance.
Clicking on the market breakdown link will show a very detailed report for that song’s individual consumption values across 200 market areas, including both a rank and an index number to compare market-by-market performance.

Figure 16.22 BuzzAngle Artist/Album/Single Dashboard: Maroon 5 V Animal

Figure 16.23
BuzzAngle Song Market Report: Maroon 5 “Animal”
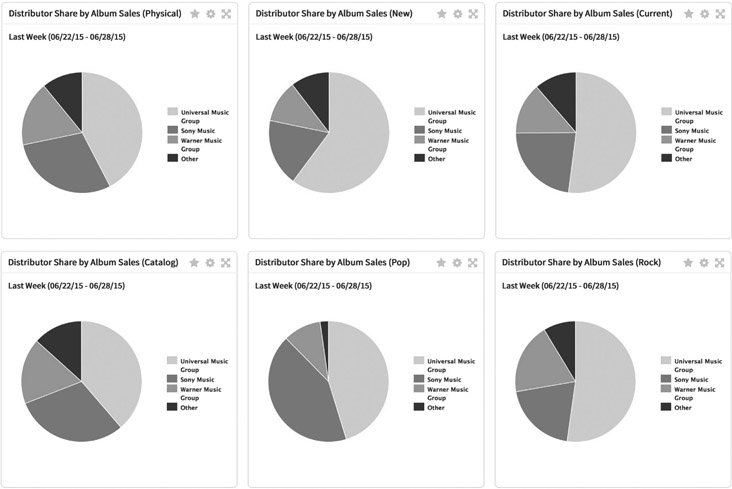
The following dashboard shows the distribution market share breakdown among the three major distributors for total albums sales during the previous week. Similar views are available for different consumption types, such as song sales, song streams and song airplay, as well as for varying time-frames such as year-to-date measurements.

Figure 16.24
BuzzAngle Distribution Company Market Share Report
A Deeper Look at All Data
Clearly, syndicated research summaries such as SoundScan and BuzzAngle are capable of revealing overall sales of music, a specific genre of music, a specific artist, a specific market, and many more aspects of the business as it pertains to sales of music. But by manipulating sales data beyond the scope of their pre-determined charts, marketers can better understand the marketplace and its drivers.
Seasonality and Record Sales
Like most products, there is seasonality to the sales of music. Every year, sales trends show a similar pattern with sales spikes at Valentines (second only to the end of year holidays), Easter, a lull through summer months, and then a steady rise through the fall going into the holiday selling season. Using the weekly sales charts of combined Album and Single sales, this overlay of years of weekly sales crystallizes seasonal sales trends. Note that every year, the volume of sales slips a little bit lower from year to year.

Figure 16.25
SoundScan Weekly Album and Single Sales
As students of the business, record company executives analyze when the best time of year would be to release new artist verses that of a platinum act. Strictly based on seasonality alone, most would say to release a new act shortly after the New Year to take advantage of the spring sales spikes and summer touring. And if the act has radio success or is a seasoned veteran, the fall selling season would be healthy window for a release to take advantage of the upcoming shopping season. As for the superstar act, a fourth quarter release would be perfect timing to capitalize on holiday shoppers while minimizing long-term advertising dollars.
Lifecycles
As discussed earlier in this text, there are four stages within the traditional product lifecycle: Introduction, Growth, Maturity, and Decline. As a product is adopted into use, and as others learn of its availability, its sales will grow. Eventually, the product will hit maturity, level off in sales, and decline. Either its maker will “reinvent” the product as “new and improved” and evolve it in some manner, or it will no longer exist.
Classic Product Lifecycles
Product lifecycles occur in music too. Although there is an occasional exception to the rule such as a second or third single from a release being the song that drives sales, most album releases have a similar sales pattern. Once an artist is established, sales patterns rarely vary, which is why the first month of a release is so critical to the success of a record. Historically, the sales success of a release has depended on how many units were shipped initially into retail, but with the burgeoning digital market, there is a never-ending supply of a particular title-on-hand-ready for delivery. Yet the number of units initially sold is usually dependent on the pent up demand felt from the marketplace. Brick-and-mortar retail music buyers also look at the track record of the artist and their previous sales as well as considering that as consumers shift from physical to digital consumption, the current trend is approximately 55% CD album, 4% vinyl, and the remaining 41% being a digital format purchase. But physical albums are only 32% of ALL music consumed with over 68% of the remaining music sales being digital sales. This data is based on single sales converted to album equivalents, and not on transaction count.
Looking at these examples, most of the releases show a similar pattern in sales even though they are different artists, genres, sales plateaus, and time of year. Yet the similarity in sales trend is unmistakable. An established artists’ sales trend shows an undeniable peak in sales early in the life cycle that tapers off within the first six weeks and three months. This is why most record labels pack their marketing strategies into this small window of time.

Figure 16.26
Classic product life cycle

Figure 16.27
Product Lifecycle for New Releases
The exceptions to the rule are the new artists that are “breaking.” Check out the first record of these now superstar acts. Most of their initial releases had a “slow boil” effect, meaning that sales did not catch on at street date but later, as consumers became more aware of the artist.
Example: Paramore started as a garage band in Franklin, TN after Hayley Williams moved into the neighborhood and met brothers Josh and Zac Farro. A big singer at the age of 13, she and the band caught industry eyes, but Williams was the only one signed to a major deal. Not getting along with the administration, Hayley was able to reformulate her agreement, and the new arrangement regrouped the neighborhood gang along with a new imprint label known as Fueled by Ramen. FBR was known for the grassroots approach to the marketplace, as well as their innovative 360 deals that enables start-up artists to hit the road with all the tools needed including booking and merchandise. Looking at their sales, the first album barely sold 2,000 units its initial week. It took two Warp Tours and the social media mojo of Fueled By Ramen to create the explosive sales that eventually happened for their second album RIOT, which also kicked the sales of their debut release “All We Know Is Falling” nearly two years after its street date.
Released in 2001, Room for Squares was John Mayer’s “official” first album release. The hit single “No Such Thing” peaked at radio, depending on the format, in mid 2002, with the bigger hit “Your Body Is A Wonder-land” driving sales even higher. Note the “slow boil” affect with the first release.
Any Given Thursday is the live album release that was to bridge sales demand while Mayer recorded the next album. Although a classic,

Figure 16.28
Comparison of Sales Patterns for Paramore Releases (Source: Nielsen SoundScan)

Figure 16.29
Comparison of Sales Patterns for John Mayer Releases (Source: Nielsen SoundScan)
“established” artist sales profile occurs, the actual volume was much lower than that of Mayer’s initial release. Heavier Things continued the sales trend of an established act, though showing a quick die-off in sales, mostly because of the lack of a big single at radio. Continuum sold well with over2.3 million units in the market, but Mayer’s summer 2008 release has not performed as well, with only 300,000+ units sold to date. To plot his cumulative solo album sales, there is a trend that vaguely shadows that of a classic product lifecycle. This is not uncommon for most artists to live a quote “product” lifecycle—it’s just imperative that artists plan for such an occurrence.
DMAs and Market Efficiencies
The Designated Market Area (DMA) is A.C. Nielsen’s geographic market design, which defines each television market. DMAs are composed of counties (and possibly also split counties) and are updated annually by the A.C. Nielsen Company based on historical television viewing patterns. Every county or split county in the United States is assigned exclusively to one DMA.
Radio audience estimates for DMAs are published in the Radio Market Reports of all Standard radio markets whose Metros are located within the DMA and whose names are contained in the DMA name. For example, radio audience estimates for the San Francisco-Oakland-San Jose DMA are reported in both the San Francisco and the San Jose Radio Market Reports; however, radio audience estimates for the New York DMA are reported in the New York Report, but not in the Nassau-Suffolk Report. (Katz Media Group Radio Resource Area)
The following data reflects the percentage of music sold in each of the DMAs. SoundScan lists the DMAs in order of population, with New York being the most populated area surveyed, Los Angeles being the 2nd largest populated area surveyed, and so on, with some variances based on radio or television markets. When looking at the markets, record labels should consider efficiency of the advertising dollars and marketing efforts.
Each genre of music contains a unique profile, for example: The percentage of music sold in the top 7 DMAs for Jazz equals 31.06%. Think about it—for every 100 Jazz records sold, 31 of them are sold in these top7 DMA markets. As a marketing department, advertising in these DMAs should have a big bang for the buck, considering the efficiency of targeting to the buyers in these markets. In contrast, to sell 30 records out of 100 in the Country genre, the top 19 DMA markets are needed to achieve that percentage. Thus, to reach buyers of country music, country record labels need to spread their marketing dollars and efforts thinner, and smarter, to effectively reach the same percentage of buyers of the genre.
Table 16.2 Year-to-Date Percentage of Sales by DMA/Genre 2013: Jazz v. Country
| YTD % of Sales by DMA/Genre 2013 | |||
| Mkt Rank | DMA | Jazz % | Country % |
|
|
|||
| 1 | New York | 9.44 | 2.8 |
| 2 | Los Angeles | 6.26 | 2.52 |
| 3 | Chicago | 3.42 | 1.96 |
| 4 | Philadelphia | 3.61 | 1.8 |
| 5 | San Francisco | 3.53 | 1.12 |
| 6 | Boston | 2.95 | 1.69 |
| 7 | Dallas - Ft. Worth | 1.85 | 2.38 |
| 31.06 | |||
| 8 | Detroit | 1.64 | 1.11 |
| 9 | Washington, DC | 3.25 | 1.77 |
| 10 | Houston - Galveston | 1.65 | 1.88 |
| 11 | Cleveland | 1.17 | 1.26 |
| 12 | Atlanta | 2.16 | 1.95 |
| 13 | Minneapolis-St. Paul | 1.54 | 1.62 |
| 14 | Tampa-St. Petersburg-Clearwater | 1.17 | 1.27 |
| 15 | Seattle-Tacoma | 2.29 | 1.43 |
| 16 | Miami-Ft. Lauderdale-Hollywood | 1.49 | 0.41 |
| 17 | Pittsburg | 0.88 | 1.12 |
| 18 | St. Louis | 1.1 | 1.1 |
| 19 | Denver-Boulder | 1.48 | 1.51 |
| 30.7 | |||
| 20 | Phoenix | 1.29 | 1.4 |
Best Selling Markets vs. Strongest Markets
It sounds confusing—why wouldn’t the best selling markets NOT be the strongest markets when looking at genre sales or title reports of a specific release? Let’s look at how record companies can manipulate Sound-Scan data to be smarter marketers.
The data in table 7.4 is a new sort of the same numbers in table X.X-1. By ranking the DMAs by percentage of sales, marketing experts can now view the best selling markets in order of per capita sales. (For this book’s example, only the Top 20 markets are being analyzed.) But are these the best markets for Jazz sales? To determine the strongest markets, using population data in the equation helps to determine where to place marketing efforts.
Here is another look at the same data. By adding 12+ population data and doing a simple ratio, the best markets emerge. The 12+ data comes from Nielsen DMA radio ratings information. The equation: sales percentage / 12+ population
Where New York and Los Angeles were ranked #1 and #2 based on population size, the strongest market for Jazz based on percentage of sales to the population of the DMA would be Philadelphia, with Boston close behind. Although Philadelphia does not sell as much Jazz as New York, the propensity of the population to buy Jazz in the Philly marketplace is over 35% greater than New York, making it a better or stronger market for Jazz music.
Table 16.3 Year-to-Date Percentage of Sale by DMA/Genre 2013 Ranked by Sale Percentage/Population
| YTD % of Sales by DMA/Genre 2013 | ||||
| Mkt Rank | DMA | 12+ Population | Jazz % | Ratio Sales %/Pop |
|
|
||||
| 4 | Philadelphia | 4558200 | 3.61 | 7.92E-07 |
| 6 | Boston | 4192800 | 2.95 | 7.04E-07 |
| 9 | Washington, DC | 4793400 | 3.25 | 6.78E-07 |
| 11 | Cleveland | 1774000 | 1.17 | 6.60E-07 |
| 15 | Seattle-Tacoma | 3638000 | 2.29 | 6.29E-07 |
| 1 | New York | 16157500 | 9.44 | 5.84E-07 |
| 19 | Denver-Boulder | 2546800 | 1.48 | 5.81E-07 |
| 2 | Los Angeles | 11271300 | 6.26 | 5.55E-07 |
| 5 | San Francisco | 6463500 | 3.53 | 5.46E-07 |
| 13 | Minneapolis-St. Paul | 2875600 | 1.54 | 5.36E-07 |
| 12 | Atlanta | 4549700 | 2.16 | 4.75E-07 |
| 18 | St. Louis | 2328700 | 1.1 | 4. 72E-07 |
| 14 | Tampa-St. Petersburg-C | 2531900 | 1.17 | 4. 62E-07 |
| 17 | Pittsburg | 2009200 | 0.88 | 4.38E-07 |
| 8 | Detroit | 3803600 | 1.64 | 4.31E-07 |
| 3 | Chicago | 7939500 | 3.42 | 4.31E-07 |
| 16 | Miami-Ft. Lauderdale-I | 3906200 | 1.49 | 3.81E-07 |
| 20 | Phoenix | 3419800 | 1.29 | 3.77E-07 |
| 7 | Dallas -Ft. Worth | 5633600 | 1.85 | 3.28E-07 |
| 10 | Houston -Galveston | 5362100 | 1.65 | 3.08E-07 |
This same type of analysis can be applied to artist DMA sales data. By looking at the sales of an artist’s specific record, labels can determine where to place marketing and dollars. See chapter appendix for more analysis on market information.
Other Tools Within the Industry
Other “big data” companies have emerged as partners with labels and artists in effort to help point the way to sales and other marketing opportunities to maximize revenue potential. That potential could include corporate partnerships, touring alliances, advertising exposure, and merchandising outlets. But all digital companies are trying to promote, engage, and measure a specific target market that will aid their client: the artist and the music.
Next Big Sound
As an extension to all the drivers that move listeners to consume, Billboard has partnered with Next Big Sound (NBS) and has created the “go-to” destination among indies and majors alike to measure social interaction along with sales and touring data, creating a “big picture” for artists and their teams to act on. Online, selected artist dashboard information can be customized to not only watch, but target specific goals. Impressions and sales can be tracked with benchmarks targeted. Similar artists can be viewed in comparison to selected artist and tour marketing and support can be viewed within context of this same data. Relevant social media can be prioritized as part of a strategic plan to motivate the market, all within a click’s view.
Via NBS’s matrixes, Billboard publishes two charts that reflect social behavior of various platforms. The Social 50 is a weekly chart that ranks the most popular artists who are online on all major music sites. The Next Big Sound chart identifies the Top 15 fastest accelerating artists across the Internet that will most likely become the Next Big Sound. Using various sources, from Facebook page “likes” to actual sales, this combined data creates context to help the modern music industry make decisions.
As part of an “in touch” component, NBS partners with artists and their managers to allow free access to listening data via Spotify. Information included shows how much time Spotify clients are listening to a specific artist, the most popular tracks, and listener demographics including age, gender and location.

Figures 16.30, 16.31, 16.32
Next Big Sound Charts, Dashboard, and Key Metrics
www.nextbigsound.com
http://www.spotifyartists.com/spotify-next-big-sound-artist-analytics/

Figures 16.33

Figures 16.34
Big Champagne
Big Champagne has blended all media elements into a “one stop” shopping service for those individuals looking for a snap shot of the action. Big Champagne mashes sales, broadcast, streaming, social and live events onto one interface allowing industry, as well as consumer insight into specific artist activities. To validate its information, Big Champagne sources its data from retailers, online and traditional broadcasters, major content companies, subscription services, social networks and venues for most accurate reporting. A subsidiary of LiveNation, one of the largest venue operators in the country, Big Champagne has one of the most comprehensive tools for gauging artist performance in the marketplace.
Charts can be genre or artist specific including Top 100, Country, and EDM, with artists isolated for listening of individual songs and videos via RDIO. Metrics of social media can be evaluated along with all indices of sales data accumulated and graphed. On a self-directed dashboard, individually chosen artists can be viewed and compared as to their progress and success on the various platforms exposure in the marketplace.
Direct to Consumer
TopSpin
This service company’s mission statement includes the idea of creating an “artistic middle class.” And its helping to do it. TopSpin aids the artist in creating an audience by building email lists, helping to communicate with them via geotargeting tactics, sells music, merch, concert tickets, and special access bundles through the artist website portal that is supported by TopSpin, and then TS delivers fulfillment of these items, shipping worldwide. Artists own their data and can analyze this information to better understand their consumer and potential markets. Other functions are available with an interesting app development component offered to artist who want to engage fans on a digital level.
Beats by Dre are a part of this company with promotional opportunities to integrate with the Beats Music App. Artists can also sell directly to fans while streaming on Spotify. And artists can land a page on MTV.com or CMT.com as part of their package with TopSpin, depending on their level of service.
TopSpin is available to labels and distributor as well as filmmakers.
BandCamp
Bandcamp plays to artists specifically who look to share their music with fans directly. To date, Bandcamp states the $87 million dollars has been driven through their site, with $3 million within recent days. This site is artist friendly, with no sign-up or monthly fee. The service is paid for by sales of music when purchased. Bandcamp states that every format of music is presented once a song is upload and engagement is mobile-friendly, including the sale of merchandise.
Bandcamp reports to SoundScan. The pricing of product is set by the artist and “free” is allowed. Playback widgets have been created so that easy imbedding can occur on social media sites such as Facebook. Capturing of emails is encouraged so that building a fan list is easy. Watching where music widgets are being imbedded and other “real time” stats is easily accessed. Bandcamp touts accurate metadata placement so that fan can find all artist info when seeking.
ReverbNation
ReverbNation works as a portal for independent musicians and labels to create traction in the digital marketplace. Co-founded by ex-record exec Lou Plaia of Atlantic and Lava Records and marketing software developer Mike Doernberg and Robert Hubbard, along with an MBA tech-head Duke grad Jed Carlson, ReverbNation offers web promotion, fan-relationship management, digital distribution, sentiment tracking, web-site hosting, and concert booking and promotion for the content creator while calculating and publishing a rolling “popularity” chart by zip code for consumers that is non-genre specific. As of August 2014, over 3.5 million musicians have created ReverbNation accounts, and the website receives over 30 million unique visitors per month.
Although ReverbNation creates its own traction, the site has learned to promote outside by creating links back to its site via widgets. Each artist can use ReverbNation as its backdoor “playback” streaming site, loading the newest music and updating the playlist as new music becomes available—all behind the scene. This “Promote It” widget allows for a seamless Facebook interface to the music, as well as other messaging through its “TuneWidget” link. The “Music For Good” allows for the sale of music via download with one half of the proceeds to be dedicated to one of 13 charities, including Fender Music Foundation, Oxfam America, World Vision, Heifer International, Zac Brown’s Camp Southern Ground and CARE. When a song is purchased for $1.29, 56 cents goes to the artist, 56 cents is sent to a charity the artist selects, 12 cents goes to PayPal to process the payment, and five cents goes to ReverbNation. Other features include a “Band Equity” measurement that looks at four metrics: reach, influence, access and recency with the top 100 of each genre being recognized. Musicians can also create the own mobile app for Apple and Android devices that are customizable to include music, bio, photos, tour dates and social links. Artists can also apply for touring and festival opportunities with music being constantly evaluated for licensing opportunities for synchronization usage including ESPN, MTV, Fox, Universal, and Electronic Arts.

Figures 16.35 AND 16.36
ReverbNation Charts and App Sampler
Charts
There are countless charts and lists that compiled in a variety of ways, here are a few that are considered a standard because of their clout and derivation of their information.
iTunes Chart
In a rolling 24-hour “real time” chart, the iTunes chart reflects consumer behavior in a more timely fashion than that of the Billboard chart. Remember that SoundScan data is reported on Wednesday and then gets published the following week. So consumers receive the “latest” chart data nearly 10 days after the fact of the best-selling album of the week. iTunes data is much more current, reflecting buyer activity within a 24-hour period. What is not clear is the algorithm that drives this chart: is it strictly downloads, is it plays, do reviews and ratings affect position of single or album? iTunes does not reveal its chart positioning formula and yet ranking in a top position within the industry is highly coveted. A better position on this chart gives the artist and its music company bragging rights, helping it grease the way onto various outlets, especially radio playlists, which require consumer acceptance.
Lastfm
Last.fm is a music recommendation service that helps a listener discover new music based on the music that they are currently playing, through an algorithm known as “The Scrobbler.” This proprietary method suggests new music based on the playlists of thousands of other’s whose listening habits resemble your own. Charts are then derived based on frequency and popularity of new music with Top Tracks vs. Hyped Tracks identified. Indie artists are encouraged to promote their music on Last.fm with an entire tab dedicated to their cause. Video “Sessions” with live musical moments are produced, festival insights, indie charts and trends are all highlighted as part of a dedicated New Artist commitment, with free downloads of new music and promotional tracks encouraged.
Appendix
The analysis of artist DMA sales data can be manipulated to reveal the best performing markets based on sales / population. By looking at the sales of an artist’s specific record, labels can determine where to place marketing and dollars.
This example is The Fray’s, “How To Save A Life” album that was released 9/13/05. Again, ranked by DMA, then ranked by sales, then ranked by sales / population ratio, look at the variance in market strength.

Figure 16.37
The Fray DMA cumulative sales and population ratio

Figure 16.38
The Fray DMA cumulative sales and population ratio ranked by sales

Figure 16.39
The Fray DMA cumulative sales and population ratio ranked by sales ratio
Based on sales per population, Denver, the band’s home town, emerges as the #1 strongest market for sales of The Fray’s, “How To Save A Life.” By concentrating on markets that have a stronger probability of sales, labels can better manage their marketing dollars through succinct activities which may include radio promotions, in-store events, touring, etc. The goal is maximize the market and sell records. This record also falls into the “slow boil” category, with the band being featured on the hit TV series and subsequent compilation of “Grey’s Anatomy.” By year end 2008, “How to Save a Life” had sold over 2 million copies.
Glossary
“Big Data” —used to describe a massive amount of both structured and unstructured data that is difficult to process using traditional databases and available software. This data holds the potential answers to help companies improve, from making better operational decisions to being more intelligent in the market place.
“Big Data Analytics” —Collecting, organizing and analyzing large sets of data that are actionable to specific business decisions is big business in today’s market space.
Designated Market Area (DMA) —A term used by Nielsen Media Research to identify an exclusive geographic area of counties in which the home market television stations hold a dominance of total hours viewed. There are 210 DMA’s in the U.S. These markets are listed in order of population density—meaning, stratified largest to smallest by size of city.
County Size —The classification of counties according to Census household counts and metropolitan proximity. There are four county size classes “A”, “B”, “C”, and “D”. In general, “A” counties are highly urbanized, “B” counties relatively urbanized, “C” counties relatively rural, and “D” counties very rural.
Geographic Regions —states are grouped by physical location which can lead to sales and marketing analysis based on geographic data.
Store Types —As an industry standard, stores have been identified by types to aid the industry in identifying source of sales. These store types include Mass Merchants, Traditional Retailers which include chain store and electronic super store, Independent Retailers, Non-traditional Outlets that include online and venue sales, and Digital portals.
Formats —The type of music format that consumer purchase continues to evolve—be it physical or digital. Physical formats include Compact Discs (CD), Vinyl (LP), Cassette, and DVD with Digital formats including Downloads and Streaming.
UPC Code —The Universal Product Code contains a unique sequence of numbers that identifies a product. GS1US standards recommend a GS1 company prefix number that identifies a unique code for a specific business.
GTIN (Global Trade Item Number) initial numbers, which can vary in size depending on the variety of products the company sells, identify the business, with the last digits identifying the products. The small digit is the “check” digit which validates the barcode equation.
ISRC Code —For digital product, the ISRC (International Standard Recording Code) is the international identification system for sound recordings and music video recordings. Just like the UPC Code, each ISRC has a unique and permanent sequence of numbers that identifies each specific recording that can be permanently encoded into a product as its digital fingerprint. The encoded ISRC provides the means to automatically identify recordings for royalty payments, key to publishers and songwriters alike.
SoundScan —Now owned by Nielsen, the company that infused the use of UPC codes to count and created the current Billboard charts, utilizing technology in helping identify where sales occurred, in which outlets, which format, etc.
Track Equivalent Albums (TEA) —which means that 10 track downloads are counted as a single album. This evaluation is based on a financial equivalent, being a $.99 download x 10 would equal a $9.99 album download or CD.
Streaming Equivalent Album (SEA) —introduced in 2013 to measure streaming consumption. To evaluate streaming equivalents, the current industry standard is 1500 streams of any songs from a particular album are counted as a single album. 1500 streams x the standard royalty generated by this airplay $.005 = $7.50, being the wholesale price of an album.
Lifecycle —term used to identify the four stages within the traditional product life-cycle: Introduction, Growth, Maturity, and Decline.
Direct-to-consumer —concept of bypassing the traditional wholesale/retail outlets and selling directly to consumers from the manufacturer. In the music business, this means the artist sells his/her music directly to their fans.
References
Bakula, D., Senior Vice President Analytics and Client Development – The Nielsen Company, Personal Interview, April 9, 2015.
“Bandcamp.” Bandcamp. N.p., n.d. Accessed September 25, 2014. http://www.BandCamp.com/.
Beal, V. “Big Data.” Webopedia. N.p., n.d. Accessed October 12, 2014. www.webopedia.com%2FTERM%2Fbig_data.html.
Bennett, J., Director, Music – The Nielsen Company, Personal Interview, April 8, 2015.
“BigChampagne Media Measurement.” BigChampagne Media Measurement Home. N.p., n.d. Accessed September 19, 2014. http://www.BigChampagne.com/.
“Create Amazing Marketing Reports That Also Make You Look Amazing.” Online Marketing Tools and Reporting Software. N.p., n.d. Accessed October 25, 2014. http://www.raventools.com/.
Dahan, C., Professor, Department of Recording Industry, Middle Tennessee State University, Personal Interview, November 4, 2014.
“Home, BuzzAngle Music.” BuzzAngle Music. N.p., n.d. Accessed October 25, 2014. http://www.buzzanglemusic.com/.
“iTunes.” Apple. N.p., n.d. Accessed September 25, 2014. http://www.apple.com/itunes/.
Kyle, G. A., Dr. “DMA Mapping of Columbia, MO.” University of Missouri School of Journalism, n.d. Accessed January 7, 2015.
“Last.fm.” Last.fm. N.p., n.d. Web September 25, 2014. http://www.lastfm.com/.
Lidestri, J., CEO - Border City Media, Personal Interview, October 25, 2014.
“Looking for Industry Knowledge? Our Range of Resources and Reports Cover Everything from Analysis on Digital Music, to How Labels Invest in Music.” Resources & Reports. International Federation of the Phonographic Industry, n.d. Accessed September 20, 2014. http://www.ifpi.org/content/section_resources/iarc.html.
Muratore, C., Chief Business Development Officer – Border City Media, Personal Interview, October 25, 2014.
“Next Big Sound: Analytics and Insights for the Music Industry.” Next Big SoundAnalytics and Insights for the Music Industry. N.p., n.d. Accessed September 20, 2014. http://www.NextBigSound.com/.
“ReverbNation: Artists First.” ReverbNation. N.p., n.d. Accessed September 24, 2014. http://www.ReverbNation.com/.
“Solutions.” Music Sales Measurement. Nielsen, n.d. Accessed October 12, 2014. http://www.nielsen.com/us/en/solutions/measurement/music-sales-measurement.html.
“Topspin Media.” Topspin Media. N.p., n.d. Accessed September 25, 2014. http://www.TopSpinMedia.com/.