
CHAPTER 6
CALL ADMISSION CONTROL IN FRACTIONAL FREQUENCY REUSE-BASED TWO-TIER NETWORKS
In a cellular network, CAC is responsible for admission or rejection of an incoming request from a UE into the network based on some predefined criteria while taking the network load conditions and QoS requirements of both incoming and existing users into account. To enable spectrum sharing between macrocells and small cells in OFDMA-based two-tier networks, one of the three access modes, namely, open, closed and hybrid access, can be employed. In the open access mode, the MUEs are allowed to connect to either their own macrocell base stations (MBSs) or SBSs. In contrast, in the closed access mode, in a two-tier macrocell–femtocell network, for example, only certain users (subscribers) belonging to the so-called Closed Subscriber Group (CSG) are allowed to connect to each FBS. For a typical hybrid access scheme, limited spectrum access at each small cell is granted for MUEs, which wish to establish connections. An efficient CAC policy is required in this case to coordinate spectrum sharing and admission control for both types of users, which should strike a balance between achieving high spectrum utilization and protecting QoS requirements for small cell users. Note that in this case both the connection-level QoS measures at the network layer (e.g., connection blocking and connection dropping probabilities) and the packet-level QoS measures (e.g., packet error rate and packet throughput) at the MAC layer need to be considered. Such spectrum sharing and admission control mechanisms for OFDMA-based two-tier networks based on cross-layer design need to be developed. By using these methods, the traffic loads among macrocells and small cells can be dynamically balanced to improve the network capacity significantly.
6.1 RELATED WORK
There have been a lot of work on the CAC problem for single-tier (or homogeneous) cellular wireless networks. In [1], a mobility-based CAC method is presented where various types of priority-based handoffs are investigated. Queueing-based analytical results are presented in [2] for different average call holding times for new and handoff calls for homogeneous networks.
There have been a few work on teletraffic modeling of hierarchical (or multi-tier) wireless networks. One of the advantages of layered network is that, the different layers may provide an alternate route for the admitted calls or handoff calls that are blocked due to congestion in a particular layer. For example, in an OFDMA-based two-tier macrocell–femtocell network, the ongoing traffic of the MUEs can overflow to neighboring femtocells (which are operating in either open access or hybrid access mode) when the macrocell is congested. Again, since the capacity of a femtocell is limited, blocked calls from femtocells can overflow to the macrocell [3]. Modeling the teletraffic performance in heterogeneous networks is challenging since it needs to consider different aspects such as, how to model new call and handoff calls at the different layers in a hierarchical layered architecture, how to model user mobility and traffic at the different layers, and how to model the radio network access performance [3,4].
In [5], a hierarchically overlaid layout network is considered where microcells cover the high teletraffic areas and macrocells cover low teletraffic areas and provide overflow channels for overlaid microcells. In order to reduce the forced termination of calls in progress, handoff calls are given priority to access the channels in both the microcell and macrocell levels. The basic structure of the proposed hierarchical overflow system is that the microcells receive input streams of new and handoff calls, whereas macrocells receive input streams of new and handoff calls as well as overflow traffic components from the neighboring microcells, that is, the system shall operate in such a manner that a call served at a given hierarchical level will not request handoff to a cell that is lower in the hierarchy. A mathematical framework is presented for hierarchical overlaid macrocell network using multi-dimensional birth–death processes to characterize system states and evaluate the teletraffic performance of the cellular network that considers call overflow from one hierarchical level to the next as well as the issue of resource availability for handoff calls. The overflow traffic is modeled as Poisson traffic and the mathematical framework analyzes call blocking, handoff failure, and forced termination probabilities derived from the state probabilities. The simulation results show that as more channels are allocated to the overlaid macrocell, the blocking probability is improved under low and moderate offered traffic. However, under high offered traffic, blocking probability in microcells increases. Also, it is observed that the cutoff priority for handoff calls can lower the forced termination probability but increases blocking probability in general. However, the proposed framework requires a huge state space, particularly when the number of channels in each macrocell becomes large.
To reduce the complexity, in [6], an analytical model for the performance evaluation of a hierarchical cellular system is presented where more realistic assumptions are considered that relate to the distribution of call time and the cell residence time. In this model, the call time is characterized by a hyper-Erlang distribution where the Laplace transform (LT) of the channel occupancy time distribution for each type of call (i.e., new call, handoff call, and overflow call) is derived as a function of the LT of the cell residence time distribution (i.e., general distribution). The channel occupancy time is modeled as a renewal process that captures the inherent overflow from a lower layer of cells to a higher layer of cells and quantifies the channel occupancy time of overflow calls in a tractable manner. However, the overflow from a macrocell layer to a microcell layer is not mentioned in the paper.
Some models in the literature capture the non-Poisson characteristics of the overflow traffic. In these models, the overflow traffic is usually characterized by the mean and variance of the offered overflow traffic intensity. The mean of a specific class of overflow traffic can be directly obtained as the equivalent blocked traffic of this class in its overflowed network group [3]. The ratio of variance to mean is defined as the peakedness, which indicates the bursty nature of the overflow traffic.
In a hierarchical network where all different tiers have identical statistical characteristics (e.g., OFDMA-based two-tier macrocell–femtocell networks), a specific class of overflow traffic from a low tier to a higher tier holds identical statistical moments in these two tiers. Heterogeneous networks also give rise to different statistical characteristics of input traffic, mobility model, and service time distribution at different network tiers. The statistical moments of the overflow traffic from one network tier to another tier are thus required to be modeled with general distribution and constitute a major technical challenge in layered teletraffic modeling. In addition to this problem, the speed-sensitive handoff and traffic overflow between layered cellular systems (e.g., macrocell overlaid with femtocells) are required to be incorporated in the model since cells of different sizes in a multi-tiered structure provide multiple service coverages of UEs of various mobility classes [3,7]. To tackle this problem, in [7], a speed-sensitive cell selection, cell re-selection, and handoff mechanism is proposed that assigns the UEs to the appropriate cell layer according to their speeds. Speed estimation can be based on the recent cell dwell time or the past dwell times. The basic mechanism of the proposed method is that, in a two-layer cell architecture, the lower cell layer comprises microcells primarily providing coverage for slow-moving UEs, while the higher cell layer consists of macrocells serving primarily fast-moving UEs. The authors provide a network-controlled speed-sensitive handoff control algorithm.
In [4], an analytical method that incorporates multiple overflow routes (i.e., correspond to the hierarchical multi-tier network) and non-Poisson behavior of the overflow traffic and at the same time handover and overflow of handover calls, is presented. In this model, the network performance is evaluated based on calculating the probability of call failure using a Markov chain model. In [3], an analytical framework is presented that attempts to solve the problem related with multiservice performance modeling for hierarchical network. The reason is that the previously mentioned multi-dimensional Markov chain model that aims to analyze the multiservice loss performance is somewhat intractable and requires complex computation. Here the authors consider the statistical heterogeneity in traffic and mobility models at different tiers when determining the statistical mean and variance of the inter-tier overflow traffic.
For multi-tier networks, in [8], the CAC problem is formulated as a semi-Markov decision process (SMDP) model and structural results on optimal cost function are presented for a network model where a WiMAX cell is overlaid with WLANs. A very recent work, presented in [9] addresses the joint resource allocation and admission control problem for OFDMA-based femtocell networks, where a power adaptation algorithm is proposed to adapt the transmission power of the HeNBs according to network dynamics.
The work presented in [8] does not consider all types of handovers (e.g., WLAN–WLAN) and does not take into account the link-level QoS requirements of the users. Also, no guideline for the selection of the cost value function is presented in [8]. The work presented in [9] considers an SMDP-based CAC, but the user mobility is not taken into account.
In this chapter, we will present a CAC method for a two-tier macrocell–femtocell network which uses a sector-based FFR for spatial channel allocation for macrocells and femtocells (see Chapter 5). The FFR parameters are optimized as discussed in Chapter 5. In this method, we consider all types of calls in a two-tier network along with random mobility of the UEs. Note that the existing work in the traditional setting (macro–microcell setting) usually assume that blocked calls from lower tiers (small cells) will be overflowed to higher tiers, and they do not explicitly capture interference in the network. We develop a CAC model that captures both co-tier interference and CTI. Also, the design of an overflow policy in our setting is different since calls from the macro-tier will actually be overflowed to the lower tier (femto tier).
6.2 CALL ADMISSION CONTROL MODEL
We assume that each of the MeNBs and HeNBs has an independent CAC unit that is capable of measuring the external call arrival rates. The admission control decision in each MeNB or HeNB is performed in a decentralized manner. We assume that an HeNB has the information about the total number of occupied sub-channels at an MeNB (and vice-versa). However, for an MeNB to make a call admission decision, we assume that it considers the average of the total number of sub-channels occupied by FUEs in HeNBs in each sector. The exchange of information may be done via backhaul or over-the-air. We assume that, at a given time instance, two adjacent HeNBs do not use the same sub-band and sub-channel.1 We assume that calls arrive to the BSs according to Poisson process and the call holding times are exponentially distributed. This assumption is essential in order to formulate the CAC problem based on the SMDP-model. We assume a random mobility pattern for the MUEs and FUEs. Therefore, the arrival processes for handoff calls (e.g., handoff from MeNB to HeNB, HeNB to HeNB, or HeNB to MeNB) do not follow Poisson processes. Hence, we consider “Hayward’s Approximation” to approximate the overflowed non-Poisson traffic by Poisson traffic.
We assume that each HeNB has a fixed transmission region where MUEs inside the region would request to establish connection with the HeNB. The HeNB admits an MUE based on an admission control policy (which depends on the number of available channels) and also if the MUE achieves the minimum rate requirement (or higher) when connected to the HeNB. We assume that the path-loss information is available at the BSs. We assume that the average transmission rate of a UE depends on the Euclidean distance between the UE and the BS.
The call arrival and handoff processes in a two-tier sector-based FFR are listed in Table 6.1. Due to a large number of call types, it would be very complicated to keep track of all the call arrival processes in the macrocell and would involve high computational complexity to obtain the CAC policy (e.g., by using a value iteration algorithm (VIA) for an SMDP-based model [9]). However, due to fixed channel allocation in sector-based FFR, we can obtain the admission control policy for any sector and use the same policy in all the sectors of the macrocell. Furthermore, in each sector, due to static frequency allocation in center-zone and edge-zone, we may obtain the policy for each zone/region separately. This will reduce the computational complexity of the VIA significantly.
Table 6.1 Different call types in sector-based FFR
| Call Type | Call Type |
| i. New calls to MeNB per sector: | v. Intra-sector macro–macro handoff: |
| 1. New calls at center-zone | 1. Handoff calls from edge-zone to center-zone |
| 2. New calls at edge-zone | 2. Handoff calls from center-zone to edge-zone |
| ii. New calls to HeNB per sector: | vi. Intra-sector femto–femto handoff: |
| 1. New calls at center-zone | 1. Handoff calls from edge-zone to center-zone |
| 2. New calls at edge-zone | 2. Handoff calls from center-zone to edge-zone |
| iii. Inter-sector macro–macro handoff: | vii. Inter-sector macro–femto and femto–macro handoff: |
| 1. Handoff calls from edge-zone to edge-zone | 1. Handoff calls from edge-zone to edge-zone |
| 2. Handoff calls from center-zone to center-zone | 2. Handoff calls from center-zone to center-zone |
| 3. Handoff calls from edge-zone to center-zone | 3. Handoff calls from edge-zone to center-zone |
| 4. Handoff calls from center-zone to edge-zone | 4. Handoff calls from center-zone to edge-zone |
| iv. Inter-sector femto–femto handoff: | viii. Intra-sector macro–femto and femto–macro handoff: |
| 1. Handoff calls from edge-zone to edge-zone | 1. Handoff calls from edge-zone to center-zone |
| 2. Handoff calls from center-zone to center-zone | 2. Handoff calls from center-zone to edge-zone |
| 3. Handoff calls from edge-zone to center-zone | |
| 4. Handoff calls from center-zone to edge-zone |
Figure 6.1 illustrates the call arrival and departure per sector of an FFR-6 based two-tier network. The basic call arrival/handoff processes along with their descriptions, arrival rates, and call rejection costs are presented in Table 6.2. The average call holding times for MUE and FUE are given by ![]() and
and ![]() , respectively.
, respectively.
FIGURE 6.1 Arrival and departure of different call types in a sector for FFR-6.

Table 6.2 Arrival rate and rejection costs for different call types

6.3 CALL ADMISSION CONTROL POLICY FOR FFR-BASED MULTI-TIER CELLULAR NETWORKS
6.3.1 Problem Formulation
The CAC policy in two-tier macrocell-femtocell networks corresponds to a decision theoretic optimization problem [10–12] that comprises long-term call admission decisions on whether to admit or reject the arriving calls in MeNB and HeNBs. The CAC decision is usually based on the available sub-channels at the BSs, the distribution and rate of the call arrival process and call rejection cost or acceptance reward associated with the admission decision. Our objective is to obtain a stationary admission policy for a multi-tier network that minimizes the total expected cost for new and handoff calls resulting from the admission control decision. Since the arrival and departure of different call types have Markov property, we can formulate this CAC problem as an SMDP [10]. We start the analysis by obtaining the CAC policy for a finite-horizon problem and later we will show that the structural results (i.e., the convexity and monotonically non-decreasing property of the cost function) also hold for an infinite-horizon CAC problem. We obtain the CAC policy based on a VIA. The obtained policy is a threshold-based policy and has a two-dimensional structure. We refer to this policy as a macro–femto threshold policy and show that this two-dimensional threshold-based policy can be considered as an optimal solution for a static FFR-based multi-tier newtork.
The SMDP-model comprises of the following five major components: decision epochs, state space, action space, expected cost value function, and state transition probabilities.
Decision Epochs: The decision epochs are considered at the occurrence of different call type events, that is, new call, horizontal handoff call, and vertical handoff call arrivals. However, no decisions are taken at the departure of the calls. Fictitious decision epochs corresponding to the departure events are considered to keep track of the departures. The fictitious decision epochs do not change the Markovian nature of the decision process since the call holding time for the UEs is exponentially distributed, thus having memoryless property [10]. Inclusion of fictitious decision epochs simplifies the formulation of the SMDP-model as it ensures that the system state only changes to adjacent states. As a result, the transition probability matrix has many zero terms which makes the VIA computationally less complex [8,10]. We introduce a fictitious call event of type “0” along with other six call arrival types as shown in Table 6.2.
State space: The state space consists of all possible combinations of occupied sub-channels for macrocell, femtocell and type of calls, within a particular zone of a sector. Note that this state space will be different for center-zone and edge-zone as the numbers of available sub-channels for MeNB and HeNB are different in center-zone and edge-zone. Consider state variable s=(i, j, k), where, i is the number of occupied macrocell sub-channels, j is the number of occupied femtocell sub-channels, and k is the call type. Let Kmaxm and Kmaxf denote, respectively, the maximum number of sub-channels allocated for MUEs and FUEs for a specific zone of a sector (i.e., for center-zone of any sector, Kmaxm=K(c)m/N and Kmaxf=K(c)f). Define the state space, ![]() , where
, where ![]() ,
, ![]() and
and ![]() . Let smax be the total number of states in the state space S.
. Let smax be the total number of states in the state space S.
Action space: At any state s=(i, j, k), for every call arrival event, either new or handoff (vertical or horizontal) call, two actions are possible: accept (denoted by 1) or reject (denoted by 0), that is,
![]()
The action state space can be defined as ![]() .
.
Expected cost value function: The expected cost value function cs(a) corresponds to the expected cost incurred until the next decision epoch if action a(s) is taken in the present state ![]() . The one-step expected cost value function is given by
. The one-step expected cost value function is given by
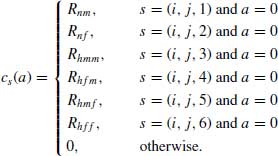
The rejection cost values can be based on the upper bound of the blocking/dropping probability constraints and the priority of the call types. For example, let us consider that the blocking/dropping probability constraints of different call types for a two-tier macrocell–femtocell network are given by ![]() . This signifies that the system prefers macro-to-femto handoff to femto-to-femto handoff and so forth. Thus, the rejection cost value associated with different call types can be set as follows:
. This signifies that the system prefers macro-to-femto handoff to femto-to-femto handoff and so forth. Thus, the rejection cost value associated with different call types can be set as follows: ![]() .
.
State transition probabilities: Let Pst(a) be the state transition probability from state ![]() to state
to state ![]() at the next decision epoch of the system if action a(s) is chosen. Now, considering the current state s=(i, j, k), if action a(s) is taken when
at the next decision epoch of the system if action a(s) is chosen. Now, considering the current state s=(i, j, k), if action a(s) is taken when ![]() , the state transition probability is given by
, the state transition probability is given by

where ![]() , and
, and

where ![]() . Here,
. Here, ![]() is the rate of going out of the state s=(i, j, k), and
is the rate of going out of the state s=(i, j, k), and ![]() is given by
is given by
![]()
The state transition probabilities for ![]() are tabulated in the Appendix.
are tabulated in the Appendix.
6.3.2 Optimal CAC Policy
We use a VIA [8] based on Bellman iterative equation (shown in Algorithm 6.1) to obtain the stationary admission policy for the SMDP-based CAC problem for two-tier macrocell-femtocell networks. In each iteration n of the VIA, we obtain a policy ![]() for state
for state ![]() that minimizes the total cost function Un(s). Based on a stopping rule2 and accuracy factor
that minimizes the total cost function Un(s). Based on a stopping rule2 and accuracy factor ![]() , we obtain the stationary policy and the optimal cost function. This CAC policy is obtained considering that the network dynamics remains constant.
, we obtain the stationary policy and the optimal cost function. This CAC policy is obtained considering that the network dynamics remains constant.
In [13], it is shown that for homogeneous network, the optimal CAC policy has a one-dimensional threshold structure and is independent of system states. However, since our system model comprises of MeNB and HeNBs, we may claim that the stationary policy has a two dimensional macro–femto threshold structure. In order to justify our claim, we consider an approach similar to that in [8,13]. First, we prove that, for infinite-horizon CAC problem the cost function is monotonically non-decreasing and convex. Then we show that the two-dimensional macro–femto threshold policy is an optimal solution to the CAC problem for a two-tier macrocell–femtocell network.
We start our analysis with a finite-horizon cost function. For an n-stage problem, let Un(i, j) refer to the optimal cost function for any call type k at the beginning of a decision epoch. Using uniformization technique [8,13], we can recursively write Un+1(i, j) as
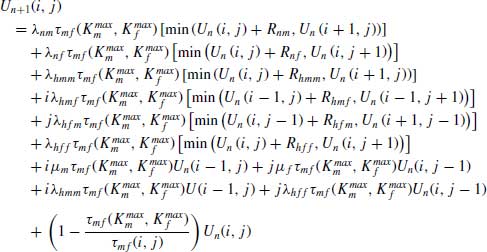
where the boundary conditions are given by
![]()
Here, ![]() is the uniformization parameter [8,10]. In (6.1), the first two terms correspond to new call arrival in MeNB and HeNB, respectively. The third and fifth terms correspond to horizontal handoffs involving MeNB and HeNB, respectively. The fourth and sixth terms correspond to vertical handoffs to HeNB and MeNB, respectively. The seventh to tenth terms correspond to departure events. The last term is due to the uniformization technique that corresponds to the probability of being in the same state. Let s=(i, j, k) be the current state of the system at the beginning of the decision epoch and a call type
is the uniformization parameter [8,10]. In (6.1), the first two terms correspond to new call arrival in MeNB and HeNB, respectively. The third and fifth terms correspond to horizontal handoffs involving MeNB and HeNB, respectively. The fourth and sixth terms correspond to vertical handoffs to HeNB and MeNB, respectively. The seventh to tenth terms correspond to departure events. The last term is due to the uniformization technique that corresponds to the probability of being in the same state. Let s=(i, j, k) be the current state of the system at the beginning of the decision epoch and a call type ![]() arrives at the system. From (6.1), it can be seen that the call is admitted only if
arrives at the system. From (6.1), it can be seen that the call is admitted only if ![]() , where
, where ![]() is the next state of the system and
is the next state of the system and ![]() is the rejection cost associated with the call type
is the rejection cost associated with the call type ![]() .
.
It is shown in [10] that for expected cost function problems with finite state and action spaces, the obtained admission policy is stationary. As Un(i, j) has a provision to remain in the same state due to uniformization technique, Theorem (6.6.2) in [10] holds. In other words, given a specific call type, for an irreducible and aperiodic Markov decision process, the difference between the upper bound (Hn) and the lower bound (Ln) of Un+1(i, j)−Un(i, j) converges to the optimal average cost per unit time as ![]() , [8,10]. This can be achieved by adjusting the stopping rule of the VIA by setting the accuracy factor to a small value. Hence, we may conclude that, the structural results obtained for finite-horizon Un(s) correspond to the infinite-horizon per unit time cost function. Therefore, if we can prove that the cost function of the finite-horizon problem is convex and monotonically non-decreasing (Lemma 6.1), then it can be concluded that the cost function has the same properties for two-tier infinite-horizon CAC problem.
, [8,10]. This can be achieved by adjusting the stopping rule of the VIA by setting the accuracy factor to a small value. Hence, we may conclude that, the structural results obtained for finite-horizon Un(s) correspond to the infinite-horizon per unit time cost function. Therefore, if we can prove that the cost function of the finite-horizon problem is convex and monotonically non-decreasing (Lemma 6.1), then it can be concluded that the cost function has the same properties for two-tier infinite-horizon CAC problem.
From Lemma 1,In a two-tier network, for a specific call type, the cost function is monotonically non-decreasing and convex in i (or j) for every fixed j (or i).
In order to prove Lemma 6.1, let us define two difference operators for Un(i, j) for specific call type k.
![]()
Here, ![]() and
and ![]() correspond to a sequence for every fixed j and i, respectively. Now, we need to show that, the sequences of
correspond to a sequence for every fixed j and i, respectively. Now, we need to show that, the sequences of ![]() and
and ![]() are (i) non-decreasing and (ii) convex in i and j, respectively. For proof, we refer to Appendix at the end of this chapter.
are (i) non-decreasing and (ii) convex in i and j, respectively. For proof, we refer to Appendix at the end of this chapter.
From Lemma 1, we can conclude that, for a given call type k, the sequence of ![]() is increasing in i for every fixed j. Hence, there exists an
is increasing in i for every fixed j. Hence, there exists an ![]() for every fixed j and call type k such that
for every fixed j and call type k such that ![]() and
and ![]() . In other words, for a given call type, for every fixed j, there exists an
. In other words, for a given call type, for every fixed j, there exists an ![]() , which is the threshold for admitting the call. Hence, for a given call type, we have a two-dimensional optimal macro and femto threshold based set, where the number of occupied channels in HeNB and MeNB (respectively) are taken into consideration to decide on the admission of a type of call. Executing the VIA, we can obtain these macro and femto threshold sets which are denoted by Tm and Tf, respectively. Algorithm 6.1 is executed independently in the BSs to decide on the admission or rejection of a call. The algorithm corresponds to a cross-layer framework where a call is only admitted at a BS depending on the availability of a sub-channel and the minimum rate requirement. In the next section, we will provide the performance evaluation results for the proposed CAC framework.
, which is the threshold for admitting the call. Hence, for a given call type, we have a two-dimensional optimal macro and femto threshold based set, where the number of occupied channels in HeNB and MeNB (respectively) are taken into consideration to decide on the admission of a type of call. Executing the VIA, we can obtain these macro and femto threshold sets which are denoted by Tm and Tf, respectively. Algorithm 6.1 is executed independently in the BSs to decide on the admission or rejection of a call. The algorithm corresponds to a cross-layer framework where a call is only admitted at a BS depending on the availability of a sub-channel and the minimum rate requirement. In the next section, we will provide the performance evaluation results for the proposed CAC framework.
6.4 PERFORMANCE EVALUATION
To evaluate the performance of the CAC method, we use an event-driven simulation using MATLAB R2010a to obtain the average arrival rates using Hayward’s approximation. Next, we use the average arrival rates to obtain the CAC policy based on VIA using MATLAB R2010a. Finally, the admission control policy is used in the
Algorithm 6.1 Value Iteration Algorithm

Algorithm 6.2Macro–femto Threshold–based CAC Algorithm

FIGURE 6.2 Snap shot of HeNB and UE locations for a two-tier cellular wireless network.
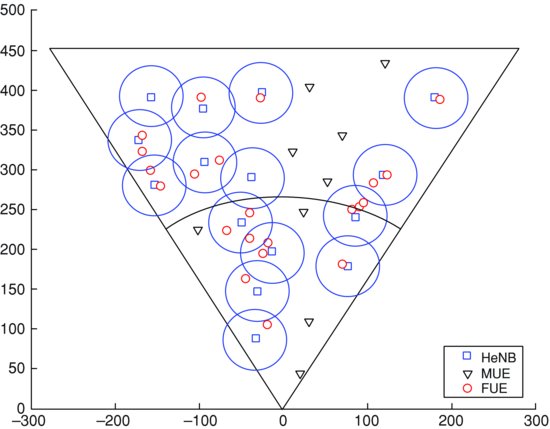
event-driven simulation. In the simulations, we consider that each UE is allocated one sub-channel to fulfill the minimum rate requirement. We consider the FFR-6 for the CAC problem. FFR-6 corresponds to high gain in throughput and less outage probability for edge-zone UEs in comparison to FFR-3 (see Chapter 5). In addition, since the system state space for FFR-6 is smaller than that of FFR-3, the complexity of the CAC problem and the running time of VIA are reduced. Figure 6.2 depicts a snap-shot of the simulation environment (i.e., network topology and UE location) during the event-driven simulation. The HeNBs are uniformly distributed within each sector. The locations of the MeNBs and HeNBs generating new calls are also uniformly distributed. The new call arrivals at the MeNB and HeNB are assumed to follow Poisson processes.
During the simulation runs, the UEs move randomly at different velocity and thus the horizontal and vertical handovers are superposition of Poisson traffic and non-Poisson overflow traffic. However, to obtain the optimal macro–femto threshold policy using an SMDP model, the call arrival rates have to be Poisson. Therefore, we have to approximate the offered load of different call types by Poisson processes. Hayward’s approximation [14,15] is one of the acceptable methodologies to approximate non-Poisson traffic by Poisson traffic. Using this approximation, the non-Poisson traffic with intensity ρ and peakedness A for a single sub-channel, can be approximated to Poisson traffic with intensity ![]() . Peakedness is defined as the ratio of the variance of the number of active calls to its mean. For Poisson traffic the peakedness is A=1.
. Peakedness is defined as the ratio of the variance of the number of active calls to its mean. For Poisson traffic the peakedness is A=1.
6.4.1 Optimal CAC Policy
We investigate the effect of call arrival rate and the values corresponding to normalized cost factors on the optimal CAC policy for different call types in a two-tier macrocell–femtocell network.3 As an example, we show the results for call type 2 (i.e., new femto call). Note that the priorities of the call types are set according to the system requirements, and the normalized cost factor is set according to blocking/dropping probability of different call types. In our model, we set the highest priority to the handoff calls from macro-to-femto, then femto-to-femto handoff and so forth.
Figure 6.3 illustrates the policy obtained from the VIA for normalized cost factor set-1 (Table 6.3) where the arrival rates for all call types are set to 0.3 calls/min. This figure also corresponds to the macro–femto threshold policy for a new femto call. For example, a new femto call will be blocked when the numbers of occupied sub-channels in MeNB and HeNB are 4 and 6, respectively. Figure 6.4 illustrates the obtained policy for new femto calls as we only increase the arrival rate of handoff calls from macro-to-femto (i.e., call type 4 ![]() ) to 0.7 calls/min. We can see that since the priority of handoff calls from macro-to-femto is set to be the highest, more new femto calls are blocked, resulting in higher blocking probability.
) to 0.7 calls/min. We can see that since the priority of handoff calls from macro-to-femto is set to be the highest, more new femto calls are blocked, resulting in higher blocking probability.
FIGURE 6.3 CAC policy for new femto call for normalized cost factor set-1: arrival rate 0.3 calls/min for all call types.

FIGURE 6.4 CAC policy for new femto call for normalized cost factor set-1: arrival rate of macro-to-femto handover calls is increased to 0.7 calls/min.

Table 6.3 Simulation parameters
| Parameter | Value |
| Number of HeNBs per sector | 15 |
| New call arrival rate (Poisson) to MeNB | 0.01–0.8 calls/min |
| New call arrival rate (Poisson) to HeNB | 0.01–0.8 calls/min |
| Inter-region MeNB–MeNB handover rate (Poisson) | 0.01–0.8 calls/min |
| Inter-region HeNB–HeNB handover rate (Poisson) | 0.01–0.15 calls/min |
| Inter-region MeNB–HeNB handover rate (Poisson) | 0.01–0.15 calls/min |
| Inter-region HeNB–MeNB handover rate (Poisson) | 0.01–0.15 calls/min |
| Average service rate for MUE | 0.25/min |
| Average service rate for FUE | 0.25/min |
| HeNB access mode | Open access mode |
| Maximum number of FUEs per HeNB | 8 |
| UE mobility | 0–3 m/s |
| Cost-weighting factor set-1, | 5:4:3:2:1:1 |
| Rhmf:Rhff:Rhfm:Rhmm:Rnf:Rnm | |
| Cost-weighting factor set-2, | 15:10:6:3:1:1 |
| Rhmf:Rhff:Rhfm:Rhmm:Rnf:Rnm | |
| Accuracy factor, |
10−3 |
| Event-driven simulation run time | 1 hour |
Figure 6.5 depicts the policy obtained for new femto calls for the normalized cost factor set-2 where the arrival rates for all call types are set to 0.3 calls/min. As we compare Figures 6.3 and 6.5, we can notice that more new femto calls are blocked as the number of occupied sub-channels in the HeNB increases. This is due to the fact that in the normalized cost factor set-2, the rejection cost for macro-to-femto handoff is proportionately higher than that in set-1. As the arrival rate of macro-to-femto handoffs increases to 0.7 calls/min (Figure 6.6), we observe that fewer new femto calls are admitted into the HeNB.
FIGURE 6.5 CAC policy for new femto call for normalized cost factor set-2: arrival rate 0.3 calls/min for all call types.

FIGURE 6.6 CAC policy for new femto call for normalized cost factor set-2: arrival rate of macro-to-femto handover calls increased to 0.7 calls/min.

6.4.2 Call Blocking/Dropping Probability Performance
The call-level QoS performance of the FFR-6 based two-tier network is illustrated in Figures 6.7–6.10. The CAC policy obtained from the VIA is used in the event-driven simulation to obtain these performance results. Figures 6.7 and 6.8 correspond to new call (macro and femto) blocking probability and handoff call (vertical and horizontal handoffs for MeNB and HeNB) dropping probability, respectively, for normalized cost factor set-1. It is notable that in general the handoff (both vertical and horizontal) calls have better QoS performance in the system at high arrival rates. This is due to the fact that more handoff calls are admitted into the network in comparison to new calls since the cost factor values for handoff call are higher in comparison to those for new calls. Specifically, the macro-to-femto handoff calls have better QoS performance in comparison to other call types. However, since the values of the cost factors are relatively close to each other, we see that the call blocking and dropping probability curves are relatively close to each other. In addition, the curves show a pattern in QoS performance that reflects the priority of the call types that can be associated with the system requirements and call blocking/dropping probability constraints. With the cost factor set-1, the system has call blocking/dropping probability ≤0.1 for all types of calls with arrival rate up to 0.45 calls/min.4 It is also notable from Figures 6.7 and 6.8 that, for the proposed framework, the maximum deviation of blocking/dropping probability for new macro and femto-to-macro calls is ![]() and
and ![]() , respectively.
, respectively.
FIGURE 6.7 New call blocking probability for normalized cost factor set-1.

FIGURE 6.8 Handoff call dropping probability for normalized cost factor set-1.
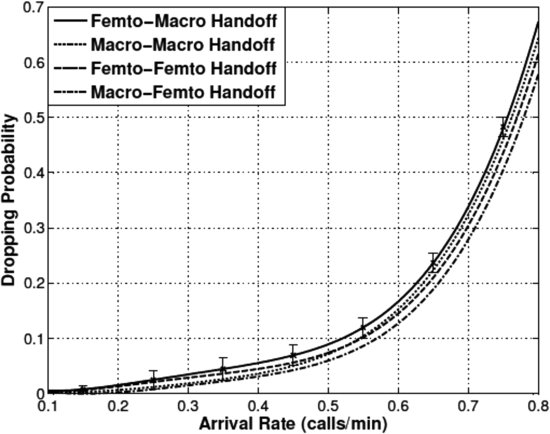
FIGURE 6.9 New call blocking probability for normalized cost factor set-2.

FIGURE 6.10 Handoff call dropping probability for normalized cost factor set-2.

Figures 6.9 and 6.10 show, respectively, new call blocking probability and handoff call dropping probability for cost factor set-2. Now, as the proportional values of the cost factors for handoff calls are relatively higher in comparison to those in set-1, more new calls are blocked at high mobility resulting in higher call blocking probability. However, we notice similar pattern and trend for the new call blocking probability (see Figures 6.7 and 6.9). This is due to the fact that in both the cost factor sets, the new calls for macro and femto have the same proportional values. On the other hand, the cost factor values for handoff calls in set-2 are proportionally higher in comparison to those in set-1. As a result, the call dropping probability curves (Figure 6.10) are not close to each other as they are in Figure 6.8. Therefore, unlike the previous case, the threshold arrival rates are different for each call type to ensure that the call blocking/dropping probability requirement is satisfied within the system. For example, if we consider that the system requires call blocking/dropping probability ≤0.1, then the threshold arrival rates for new calls (both macro and femto) and macro-to-femto are approximately 0.33 and 0.6 calls/min, respectively.5 It is also notable from Figures 6.9–6.10 that, for the proposed framework, the maximum deviation of blocking/dropping probability for new macro and macro-to-macro calls is ![]() and
and ![]() , respectively.
, respectively.
Thus we can see that, the system QoS performance depends on the priority of the call type and the values assigned to the normalized cost factors. If the system requires a steady QoS for all types of calls, then we may choose the cost factor values as in set-1. If the system requires to maintain a strict QoS performance for specific call type, the cost factor values can be chosen similar to those in set-2.
6.4.3 Comparison of Call-Level QoS
Figures 6.11–6.13 depict the comparison between the proposed framework and a reference model in terms of blocking/dropping probability of MUEs considering the target SNR at MUEs and minimum rate requirement as 15 dB and 275 kbps, respectively. In these figures “ch. unavail” refer to the case where call blocking is due to the unavailability of channels during the CAC process. For the reference model, we consider a non-optimal configuration where the radius of cell center-zone is half of the macrocell radius and the number of allocated sub-channels is in proportion to the areas of center-zone and edge-zone. Since the FFR design parameters for the reference model are not optimal, we notice an increase in the call blocking/dropping probability for MUEs. For example, from Figure 6.11, we can notice that, the average increase in new macro call blocking probability for the reference model is approximately 26.54%.
FIGURE 6.11 Comparison between the proposed model and the reference model in terms of new macro call blocking probability for normalized cost factor set-1 and target SNR at MUE = 15 dB.

FIGURE 6.12 Comparison between the proposed model and the reference model in terms of macro-to-macro handoff call dropping probability for normalized cost factor set-1 and target SNR at MUE = 15 dB.

FIGURE 6.13 Comparison between the proposed model and the reference model in terms of femto-to-macro handoff call dropping probability for normalized cost factor set-1 and target SNR at MUE = 15 dB.

Figures 6.14–6.16 depict the comparison between the proposed framework and the reference model in terms of blocking/dropping probability of the MUEs considering the target SNR at the MUEs and the minimum rate requirement as 20 dB and 275 kbps, respectively. In this case, we also notice from Figure 6.14 that, the average increase in new macro call blocking probability for the reference model is approximately 29.91%. Also, since the FFR design parameters for the reference model are not optimized, the average increase in new macro call blocking probability is also very high.
FIGURE 6.14 Comparison between the proposed model and the reference model in terms of new macro call blocking probability for normalized cost factor set-1 and target SNR at MUE = 20 dB.
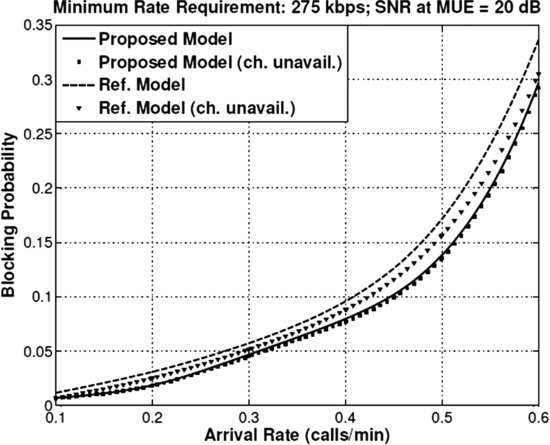
FIGURE 6.15 Comparison between the proposed model and the reference model in terms of macro-to-macro handoff call dropping probability for normalized cost factor set-1 and target SNR at MUE = 20 dB.

FIGURE 6.16 Comparison between the proposed model and the reference model in terms of femto-to-macro handoff call dropping probability for normalized cost factor set-1 and target SNR at MUE = 20 dB.

6.5 SUMMARY AND FUTURE RESEARCH DIRECTIONS
For FFR-6, we have presented a decision-theoretic framework to model and solve the CAC problem in a two-tier macrocell-femtocell network. The problem has been formulated as an SMDP and a VIA has been used to obtain the optimal macro–femto threshold policy. In the process of obtaining the admission policy, we have shown that the cost function is monotonically non-decreasing and convex, and hence the structural results obtained holds for an infinite-horizon CAC problem to ensure long-term QoS performance. To facilitate the application of the SMDP framework under user mobility, we have used “Hayward’s Approximation” to approximate the non-Poisson traffic by Poisson traffic. We have shown how the mobility and cost factor values of call types affect the admission policy obtained from the VIA. The normalized cost factors and the FFR design parameters can be chosen according to call blocking/dropping probability thresholds (for different call types) as determined by the system requirements.
In the context of handoff management and admission control, it is important to develop realistic models for input traffic and overflow (or handoff) at the different tiers of the network in presence of user location, mobility, and different service classes with prioritization among them, as well as an access mode of the small cells. A multi-tier network model will give rise to different statistical characteristics of input traffic, mobility model, and service time distribution at different network tiers [16,17]. Tractable performance analysis models for handoff management and admission control need to be developed considering this statistical heterogeneity at different tiers along with the physical-layer models for spectrum sharing.
The overflow policy may be designed differently if there are more than two tiers in the network. When there are multiple (>2) tiers, the resource allocation among tiers will also impact the admission control design since it determines how many channels (e.g., RBs) are available at each tier to support new and handoff calls from different tiers.
The design of CAC policies for multi-tier networks should also consider the multiple radio access technology (multi-RAT) scenarios where an MUE or an FUE is also equipped with 3G and/or Wi-Fi radio in addition to the OFDMA radio and a seamless handoff is possible among the different RATs. In this context, microeconomic and game-theoretic models can be developed to model the RAT selection as well as the BS selection problem in multi-tier networks.
For efficient CAC and handoff management, cross-layer methods need to be developed with the following considerations. Since the interference structures in the UL and DL in the multi-tier networks are very different, constraints at the physical layer will depend on whether the arriving/handoff calls need to establish communication in both UL and DL or in only one direction as well as the access mode in use. For DL communications, the MUEs may not be able to connect to a nearby SBS in the closed access mode, or the MUEs could be highly mobile which require them to be connected with the MBSs. Then, to avoid excessive interference from nearby SBSs, some channels should not be used by the nearby SBSs, which are reserved for MUEs. Therefore, the problem of joint selection of network tier and resource allocation will need to be investigated for both UL and DL communications.
APPENDIX
State Transition Probability
The state transition probabilities from state ![]() to state
to state ![]() at the next decision epoch of the system for action a(s) when
at the next decision epoch of the system for action a(s) when ![]() are as follows:
are as follows:
- For k=2, 6

where
 .
.
where
 .
. - For k=4

where
 , and
, and
where
 .
. - For k=5

where
 , and
, and
where
 .
.
Proof of Monotonically Non-Decreasing Property of Cost Function
We use a mathematical induction method on n to show that the cost function is monotonically non-decreasing and convex in i (or j) for every fixed j (or i). In other words, we consider Un(i, j) to be monotonically non-decreasing and convex in i (or j) for every fixed j (or i). Now, we need to show that Un+1(i, j) is monotonically non-decreasing and convex in i (or j) for every fixed j (or i).
In this proof we consider the center-zone of a specific sector and hence the parameters presented are associated with the center-zone specification. We consider the hypothesis that Un(i, j) is monotonically non-decreasing in i for every fixed j, that is, ![]() . Now we need to show that,
. Now we need to show that, ![]() .
.

where

In order to show that ![]() , we consider part-by-part analysis of 6.2. In this analysis, first we note that for a specific call type, for every fixed j, the following initial conditions apply:
, we consider part-by-part analysis of 6.2. In this analysis, first we note that for a specific call type, for every fixed j, the following initial conditions apply:
Now, let us consider ![]() of 6.2:
of 6.2:
(6.4) 
Since we are using the method of induction on variable n, the hypothesis that Un(i, j) is monotonically non-decreasing in i (or j) for every fixed j (or i) holds true. Therefore, for a given call type for every fixed j, ![]() . Concurrently, it also signifies that
. Concurrently, it also signifies that ![]() and
and ![]() . However, the term,
. However, the term, ![]() , since
, since ![]() . Therefore, we can conclude
. Therefore, we can conclude ![]() . Similarly, it can be proved that,
. Similarly, it can be proved that, ![]() . Now, let us consider
. Now, let us consider ![]() :
:

Similarly, it can be proved that ![]() . Since
. Since ![]() , it can be readily shown that,
, it can be readily shown that, ![]() . In order to ensure that the summation of the rest of the terms in 6.2 is non-negative, we first expand
. In order to ensure that the summation of the rest of the terms in 6.2 is non-negative, we first expand ![]() as follows:
as follows:

Let us consider ![]() :
:

Similarly, it can be proved that ![]() . Now, consider the summation of
. Now, consider the summation of ![]() of 6.2 and
of 6.2 and ![]() of 6.5,
of 6.5,

Similarly, it can be proved that ![]() . Finally, consider the summation of
. Finally, consider the summation of ![]() of 6.2 and
of 6.2 and ![]() of 6.5:
of 6.5:

Therefore, it can be concluded that ![]() . Similarly, it can be shown that
. Similarly, it can be shown that ![]() . Hence, for a given call type the cost function is monotonically non-decreasing in i (or j) for every fixed j (or i).
. Hence, for a given call type the cost function is monotonically non-decreasing in i (or j) for every fixed j (or i).
Proof of Convexity of Cost Function
In order to prove that for a given call type, Un+1(i, j) is convex in i for every fixed j, we need to show that ![]() , that is,
, that is, ![]() , where the initial conditions in (6.3) hold. Now,
, where the initial conditions in (6.3) hold. Now,

where ![]() .
.
Now, we consider part-by-part analysis of (6.6) to prove the convexity of Un+1(i, j) in i (or j) for every fixed j(or i) for a specific call type k.

Now, with the hypothesis that Un(i, j) is convex in i (or j) for every fixed j (or i), we can justify that, ![]() and
and ![]() . In addition, since
. In addition, since ![]() , we can conclude that,
, we can conclude that, ![]() . Similarly, it can be proved that, each of the terms
. Similarly, it can be proved that, each of the terms ![]() ,
, ![]() ,
, ![]() ,
, ![]() ,
, ![]() ,
, ![]() is
is ![]() .
.
Now, let us consider expanding ![]() as follows:
as follows:

First, let us consider Z2(i+1, j) as follows:

Similarly, it can be proved that the terms Z4(i+1, j), Z6(i+1, j) is ![]() . Now, consider the summation of
. Now, consider the summation of ![]() in (6.6) and Z1(i+1, j) in (6.7) as follows:
in (6.6) and Z1(i+1, j) in (6.7) as follows:

Finally, let us consider the summation of ![]() in (6.6) and Z3(i+1, j) in (6.7) as follows:
in (6.6) and Z3(i+1, j) in (6.7) as follows:

Since Un(i, j) is convex in i (or j) for every fixed j (or i), ![]() , and
, and ![]() . In addition, since
. In addition, since ![]() , the summation of both the terms is greater than or equal to 0. Hence,
, the summation of both the terms is greater than or equal to 0. Hence, ![]() . Similarly, it can be shown that
. Similarly, it can be shown that ![]() . Hence, the cost function is convex.
. Hence, the cost function is convex.
REFERENCES
1. J. Hou and Y. Fang, “Mobility-based call admission control schemes for wireless mobile networks,” Wireless Communications and Mobile Computing, vol. 1, no. 3, pp. 269–282, July–September 2001.
2. Y. Fang and Y. Zhang, “Call admission control schemes and performance analysis in wireless mobile networks,” IEEE Transactions on Vehicular Technology, vol. 51, no. 2, pp. 371–382, March 2002.
3. Q. Huang, K. T. Ko, and V. B. Iversen, “Performance modeling for heterogeneous wireless networks with multiservice overflow traffic,” IEEE Globecom 2009, pp. 1–7, November 30–December 4, 2009.
4. P. Fitzpatrick, C. S. Lee, and B. Warfield, “Teletraffic performance of mobile radio networks with hierarchical cells and overflow,” IEEE Journal on Selected Areas in Communications, vol. 15, pp. 1549–1557, October 1997.
5. S. S. Rappaport and L. R. Hu, “Microcellular communications systems with hierarchical macro overlays: Traffic performance models and analysis,” Proceedings of the IEEE, vol. 82, pp. 1383–1397, September 1994.
6. K. Yeo and C. Jun, “Modeling and analysis of hierarchical cellular networks with general distributions of call and cell residence times,” IEEE Communications Magazine, vol. 51, no. 6, pp. 1361–1374, November 2002.
7. B. Jabbari and W. F. Fuhrmann, “Teletraffic modeling and analysis of flexible hierarchical cellular networks with speed-sensitive handoff strategy,” IEEE IEEE Journal on Selected Areas in Communications, vol. 15, pp. 1539–1548, October 1997.
8. A. Farbod and B. Liang, “Efficient structured policies for admission control in heterogeneous wireless networks,” ACM/Springer Mobile Networks and Applications, vol. 12, no. 5, pp. 309–323, December 2007.
9. L. B. Le, D. Niyato, E. Hossain, D. I. Kim, and D. T. Hoang, “QoS-aware and energy-efficient resource management in OFDMA femtocells,” IEEE Transactions on Wireless Communications, vol. 12, no. 1, pp. 180–194, January 2013.
10. H. C. Tijms, A First Course in Stochastic Models. John Wiley and Sons Ltd., 2003.
11. M. Puterman, Markov Decision Processes: Discrete Stochastic Dynamic Programming. John Wiley & Sons, Inc. New York, NY, USA, 1994.
12. S. M. Ross, Applied Probability Models with Optimization Applications. Dover Publications, 1992.
13. R. Ramjee, D. Towsley, and R. Nagarajan, “On optimal call admission control in cellular networks,” Wireless Networks, vol. 3, no. 1, pp. 29–41, 1997.
14. A. Kumar, D. Manjunath, and J. Kuri, Communication Networking: An Analytical Approach. Morgan Kaufmann Publishers, May 2004.
15. A. A. Fredericks, “Congestion in blocking systems: A simple approximation technique,” Bell System Technical Journal, vol. 59, no. 6, pp. 805–827, 1980.
16. K. Yeo and C. Jun, “Modeling and analysis of hierarchical cellular networks with general distributions of call and cell residence times,” IEEE Transactions on Vehicular Technology, vol. 51, no. 6, pp. 1361–1374, November 2002.
17. Q. Huang, K.-T. Ko, and V. B. Iversen, “Approximation of loss calculation for hierarchical networks with multiservice overflows,” IEEE Transactions on Communications, vol. 56, no. 3, pp. 466–473, March 2008.
1. In Chapter 5, in Figure 5.3 we have seen that an HeNB in center-zone and edge-zone has ![]() and N usable sub-bands, respectively. Hence, two neighboring HeNBs using the same sub-band and same sub-channel at a given time instance may have very low probability.
and N usable sub-bands, respectively. Hence, two neighboring HeNBs using the same sub-band and same sub-channel at a given time instance may have very low probability.
2. Let Bn denote the difference between the upper bound (Hn) and the lower bound (Ln) of Un(t)−Un−1(t) at nth iteration where ![]() . The stopping rule is defined as:
. The stopping rule is defined as: ![]() [10].
[10].
3. We consider the minimum rate at the UEs to be 100 kbps and the target SNR at the MUEs to be 15 dB, unless otherwise specified. The simulation results are obtained according to the design parameters presented in Table 5.3.
4. We refer this setup as configuration-1.
5. We refer this setup as configuration-2.