Sometimes while developing the Data model for a Business Intelligence application, one comes across dimensional values that tend to change with time. Such dimensions are known as Slowly Changing Dimensions. For example, an employee joins a company at a Junior Executive level and stays at the same position for 1 year. After one year, the designation changes to Senior Executive and then changes to Project Manager after 3 years. The position field in this case will be treated as a Slowly Changing Dimension.
Such Slowly Changing Dimensions can be represented in Qlik Sense, provided the historical data is stored at the source with a proper "Position Start Date" and "Position End Date".
In order to match the discrete date values to the date intervals, we will make use of the intervalmatch function. At the same time, we will match the values of the primary key. This will help us to build an optimized Data model and properly link the transactions to the Slowly Changing Dimensions.
The following recipe assumes a hypothetical situation wherein an HR department is trying to track the Employee Journey within an organization that is tracking the various positions the employee has held within his or her tenure with the company and the related compensation against each position. For this purpose, we will create the following Inline tables within Qlik Sense:
- 2 Dimension Tables:
EmployeeandPosition - 1 Date Intervals table to track changes in position for the employee:
Employment - 1 Fact table:
EmpSalary
The steps to do so are as follows:
- Create a new Qlik Sense application.
- Load the following script in Qlik Sense:
// ============ Load the Employee table ============
Employee:
LOAD * INLINE [
    EmployeeID,EmployeeName
    11,Susan Sayce
    22,Adam Holliaoak
    33,Rod Marsh
    44,Alex Gerard
    55,Pete Cox
];
// ============ Load the Position table ============
Position:
LOAD * INLINE [
PositionID,Position
1,HR Analyst
2,HR Director
3,HR Executive
];

// ==== Load the Employee table with the Date Intervals ====
EmployeeInt:
LOAD *,
    Autonumber(EmployeeID & '-' & PositionFrom & '-' & PositionTo) as DatePositionKey;
LOAD DATE(Date#( PositionFrom,'DD/MM/YYYY')) as PositionFrom,
DATE(Date#( PositionTo,'DD/MM/YYYY')) as PositionTo, PositionID, EmployeeID
 INLINE [
    PositionFrom, PositionTo,PositionID,EmployeeID
    01/09/2009, 31/10/2010,2,11
    01/08/2008, 31/08/2009,1,11
    10/08/2008, 15/03/2010,1,22
    03/03/2008, 08/12/2008,2,33
    15/02/2008, 15/03/2010,3,44
    01/06/2008, 08/12/2008,3,55
];

// ============ Load the Employee Salary table ============
EmployeeSalary:
LOAD EmpID ,DATE(Date#( DateInToPosition,'DD/MM/YYYY')) as DateInToPosition, EmployeeSal INLINE [
    EmpID,DateInToPosition,EmployeeSal
    11,01/09/2009,90000
    11,01/08/2008,50000
    22,10/08/2008,45000
    33,03/03/2008,100000
    44,15/02/2008,60000
    55,01/06/2008,55000
];- Open the Data model viewer. The Data model is shown in the following figure. We can see that the
EmpSalarytable is not linked to the Data model. If we try to link the table through theEmpIDfield, then the employees who have changed their positions would reflect the same salaries for each position, which is not correct.
- Open the App overview and create a new sheet. Drag a Table object onto the content area.
- Add the following dimensions to the table: EmployeeID, EmployeeName, Position, PositionFrom, and PositionTo.
- Under Sorting, promote EmployeeName to the top. Promote PositionFrom to the second position and set the sort order as numeric and ascending.

- In the preceding script, Susan Sayce has changed her position from HR Analyst to HR Director. There is a
DateInToPositionvalue associated with each position, which comes from theEmployeeSalarytable. - We will make use of the
IntervalMatchfunction, which will match theDateInToPositionto the date interval ofPositionFromandPositionTo. - Load the following script on a separate section:
// === Link Table using the IntervalMatch prefix ===
LinkTable:
IntervalMatch (DateInToPosition,EmpID)
Load distinct PositionFrom, PositionTo, EmployeeID AS EmpID Resident EmployeeInt;

Left Join (EmployeeSalary)
Load
EmpID,
DateInToPosition,
Autonumber(EmpID & '-' & PositionFrom & '-' & PositionTo) AS DatePositionKey
Resident LinkTable;

// ============ Cleanup ============
Drop Table LinkTable;
Drop Field EmpID;
- On the final load, the Data model should look like this:

-
Open the App overview via the navigation
 dropdown on the top-left corner. Go back to the sheet created in step 2.
 - In the Table object, add the following measure and label it
Salary:Sum(EmployeeSal)
- Make sure that the sorting order remains same as mentioned in step 4, that is, to promote
EmployeeNameto the top. PromotePositionFromto the second position and set the sort order as numeric and ascending. - The resultant table would look like this:

- Select a particular employee to see all the associated positions, start dates, end dates, and salaries.
The dimension tables are loaded first. A composite key comprising EmployeeID, PositionFrom, and PositionTo is created in the EmployeeInt table.
The fact table EmployeeSalary is loaded with the EmployeeID value represented as EmpId.
Under LinkTable, an interval is assigned to each combination of EmpID and DateInToPosition using the intervalmatch function.
Finally, a key is created in LinkTable with the same combination of EmployeeID, PositionFrom, and PositionTo. The LinkTable is joined back to the EmployeeSalary table.
The problem of slowly changing dimensions can be solved using the extended intervalmatch syntax explained in the preceding steps. The employee, positions, and salaries will all be properly linked.
In the preceding example we have joined LinkTable to the EmployeeSalary table. However, one should bear in mind that this can only be done if there is a Many-One relationship between the Employee and Position. If this doesn't hold true, that is, if an employee knowingly or unknowingly has more than one position for the same start and end dates in the source data, then the join between the link and the EmployeeSalary table will result in an increase in the number of records. In such a situation, the left join should be avoided.
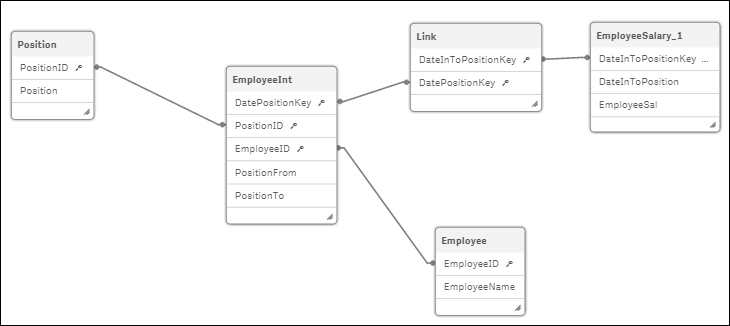
Instead LinkTable must simply be linked through the DatePositionKey composite key to the EmployeeInt table. Another composite key comprising DateInToPosition and EmpID must be created which should link back to the same key in EmployeeSalary.
The resident load for the Link table would be as follows:
Link:
Load
Autonumber(EmpID & '-' & DateInToPosition)AS DateInToPositionKey,
Autonumber(EmpID & '-' & PositionFrom & '-' & PositionTo)
AS DatePositionKey
Resident LinkTable;
The resident load for the Employee table would be as follows:
EmployeeSalary_1:
Load
*,
Autonumber(EmpID & '-' & DateInToPosition)AS DateInToPositionKey
Resident
EmployeeSalary;
DROP TABLE EmployeeSalary;
On loading the script, the resulting Data model would be like this: