
A set modifier contains one or several field names that make up the set expression. We can define a range of values within the selection made in the set modifier. The following recipe makes use of search strings to calculate the sales for customers within a specified date range.
For the purpose of this recipe, we will be using an inline data load which contain shipment details for each customer. Load the following script within the Qlik Sense data load editor:
Sales:
LOAD DATE(Date#(DeliveryDate,'DD/MM/YYYY')) AS DeliveryDate,
DATE(Date#(ShipmentDate,'DD/MM/YYYY')) AS ShipmentDate,
Customer,Month,Volume,Sales,Supplier INLINE [
Customer,Month,DeliveryDate,ShipmentDate,Volume,Sales,Supplier
ABC,Jan,01/01/2015,29/12/2014,100,10000,DEF
ABC,Feb,02/02/2015,25/01/2015,100,10000,DEF
ABC,Mar,03/03/2015,02/03/2015,400,12000,DEF
ABC,Apr,04/04/2015,24/01/2015,100,10000,GHI
DEF,Feb,03/02/2015,03/02/2015,200,25000,GHI
DEF,Mar,25/03/2015,21/03/2015,300,25000,GHI
DEF,Apr,18/04/2015,14/04/2015,200,25000,ABC
GHI,Jan,24/01/2015,18/01/2015,200,8500,ABC
GHI,Mar,14/03/2015,09/03/2015,200,7000,ABC
GHI,Jun,11/06/2015,07/06/2015,200,5000,ABC
];
- Drag across the Table object from the Assets panel on to the sheet.
- Add Customer as dimension.
- Add the following measure, which calculates the sales for delivery dates ranging between
14/01/2015and14/04/2015. Label the measure asSales:Sum({< DeliveryDate = {'>=$(=DATE(Date#('14/01/2015','DD/MM/YYYY')))<=$(=DATE(Date#('14/04/2015','DD/MM/YYYY')))'} >} Sales) - Click on Save and
 .
. - The resultant table will be as following. Note that we get a subset of the
Salesvalue based on the date range specified in the set modifier: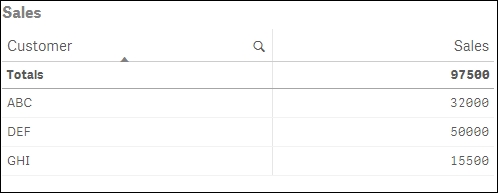
- Drag across the Filter pane object onto the sheet and add the DeliveryDate as dimension.
- Select any random delivery dates. Observe that the Sales figure for each customer remains unchanged.
In the set modifier we specify two dates enclosed within single quotes (''). The first date is the start date of the range and it is preceded by a >= sign, while the second date is an end date of the range and is preceded by a <= sign. We use a date function in order to interpret the strings as date. The $ sign expansion evaluates the expression inside the bracket.
The preceding recipe considers two static dates for the date range. We can also make the date range dynamic by tweaking our Set Analysis expression the following way:
Sum({<DeliveryDate = {">=$(=min(ShipmentDate))<=$(=max(ShipmentDate))"} >} Sales )Here we are comparing the delivery date to the shipment date and calculating sales for the delivery dates lying between the range of shipment dates.
For example:
- Add ShipmentDate as a new dimension in the Filter pane object.
- Select the shipment dates from 18/01/2015 to 25/01/2015.
- The resultant table shows the sales value only for the delivery date, as 24/01/2015:
