In general, the processes and tools we use for debugging can serve multiple purposes. The most immediate purpose is always that of identifying the causes of errors and then resolving those errors. There are two categories of production errors (which may also occur during development) and NAV 2015's Debugger module is very well suited to addressing both of these. The NAV debugger smoothly integrates developing in the Development Environment and testing in the Role Tailored Client.
The first category is the type that causes an error condition which terminates processing. In this case, the immediate goal is to find the cause and fix it as quickly as possible. The new debugger is an excellent tool for this purpose. The second category is the type that, while running to completion successfully, gives erroneous results.
We often find that debugging techniques can be used to help us better understand how NAV processes work. We may be working on the design of (or determination of the need for) a modification or we may simply want to learn more about how a particular function is used or outcome is accomplished in the standard NAV routines. It would be more appropriate to refer to these efforts as analysis or self-education, rather than debugging, even though the processes we use to dissect the code and view what it's doing are very similar. In the course of these efforts, less sophisticated approaches are sometimes useful in understanding what's going on. We'll quickly review some of these alternate approaches before studying use of the NAV 2015 Debugger.
Using a developer license, we are allowed to export objects into text files, where we can use a text editor to examine or even manipulate the result. Let us take a look at an object that has been exported into text and imported into your favorite text editor. We will use one of the tables that is part of our WDTU development, the Playlist Item Rate table, 50004 as shown in the following screenshot:
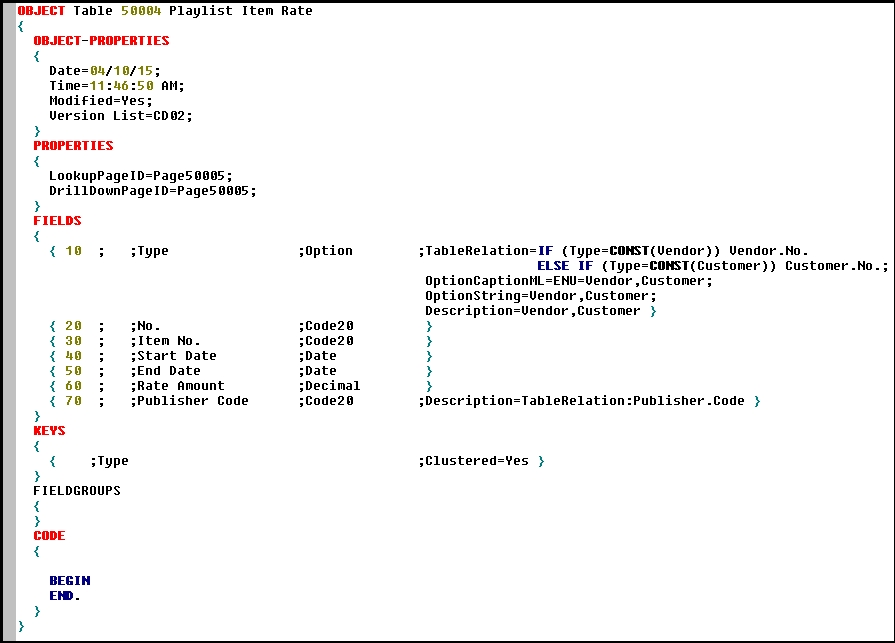
The general structure of all the exported objects is similar, with just those differences that we would expect for the different objects. This particular table contains no C/AL-coded logic, as those statements would be visible in the text listing. We can see by looking at this table object that we could easily search for instances of the string Code throughout the text export of the entire system, but it would be more difficult to look for references to Playlist Item Rates because it is only referenced by page ID, Page50005. While we can find the instances of Code with our text editor, it would be quite difficult to differentiate those instances that relate to the Playlist Item Rate table from those in any other table. This includes those that have nothing to do with our WDTU system enhancement, as well as those simply defined in an object as Global Variables.
If we are determined to use a text editor to find all instances of "Playlist Item Rate"."Rate Amount", we can do the following:
- Rename the field in question to something unique. C/SIDE will rename all the references to this field to this new name.
- Export all the sources to text followed by using our text editor (or even Microsoft Word) to find the new, unique name.
- Either return the field in the database to the original name or work in a temporary copy of the database, which we will then discard. Otherwise, we will have quite a mess.
One task that needs to be done occasionally is to renumber an object or to change an internal object reference that refers to a no longer existing element. The C/SIDE editor may not let us do that easily or, in some cases, not at all. In such a case, the best answer may be to export the object into text, make the change there, and then import it back in as modified. Be careful. When we import a text object, C/SIDE does not check to see if the incoming object is valid. C/SIDE makes that check when we import a compiled fob object. If we must do object renumbering, we should use the functionality built into Mergetool (available at http://www.mergetool.com/default.html). Many years ago, Mergetool was the recommended Upgrade support tool for Navision and once again it's the best answer.
There are occasions when it is very helpful to simply view an object "flattened out" in text format. In a report or XMLport where we may have combinations of logic and properties, the only way to see everything at once is in text format. We can use any text editor we like, Notepad or Word, or one of the visual programming editors; the exported object is just text. We need to cope with the fact that when we export a large number of objects in one pass, they all end up in the same text file. This makes the exported file relatively difficult to use. The solution is to split that file into individual text files, named logically, one for each NAV object. There are several freeware tools to do just that, available from the NAV forums on the Internet.
Note
Two excellent NAV forums are http://www.mibuso.com/ and http://dynamicsuser.net/
Sometimes the simpler methods are more productive than the more sophisticated tools, because we can set up and test quickly, resolve the issue (or answer a question), and move on. All the simpler methods involve using one of the C/AL DIALOG functions such as MESSAGE, CONFIRM, DIALOG, or ERROR. All of these have the advantage of working well in the RTC environment. However, we should remember that none of these techniques conform to Testing Best Practices in the Testing the Application Help. These should only be used when a quick, one-time approach is needed or when recommended testing practices won't easily provide the information needed and one of these techniques will do so.
The simplest debug method is to insert the MESSAGE statements at key points in our logic. It is very simple and, if structured properly, provides us a simple "trace" of the code logic path. We can number our messages to differentiate them and display any data (in small amounts) as part of a message such as the one shown following.
MESSAGE('This is Test 4 for %1',Customer."No.");A big disadvantage is that the
MESSAGE statements do not display until processing either terminates or is interrupted for user interaction. If we force a user interaction at some point, then our accumulated messages will appear prior to the interaction. The simplest way to force user interaction is to issue a CONFIRM message in the format as follows:
IF CONFIRM ('Test 1',TRUE) THEN;If we want to do a simple trace but want every message to be displayed as it is generated (that is, have the tracking process move at a very measured pace), we could use the CONFIRM statements for all the messages. The operator must then respond to each one before our program will move on, but sometimes that is what we want. However, if we make the mistake of creating the situation where hundreds of messages are generated, the operator will have to respond to each one individually in what could be a very time consuming and inefficient process.
Another tool that is useful for progress tracking is the DIALOG function. DIALOG is usually set up to display a window with a small number of variable values. As processing progresses, the values are displayed in real time. Some ways we might use this are listed next:
- Simply tracking progress of processing through a volume of data. This is the same reason we would provide a
DIALOGdisplay for the benefit of the user. The act of displaying slows down the processing somewhat, so we may want to update theDIALOGdisplay occasionally, not on every record. - Displaying indicators when processing reaches certain stages. This can be used as a very basic trace with the indicators showing the path taken so we may gauge the relative speed of progress through several steps.
- We might have a six-step process to analyze. We could define six tracking variables and display all of them in
DIALOG. We would initialize each variable with values dependent on what we are tracking, such as A1, B2000, C300000, and so on. At each process step, update and display the current state of one or all the variables. This can be a very helpful guide for how our process is operating. To slow things down, we could put aSLEEP(100)orSLEEP(500)after theDIALOGstatement (the number is milliseconds of delay).
We can build a very handy debugging tool by outputting the values of critical variables or other informative indicators of progress to either an external text file or to a table created for this purpose. We need to either do this in single user mode or make it multiuser by including the USER ID on every entry.
This technique allows us to run a considerable volume of test data through the system, tracking some important elements while collecting data on the variable values, progress through various sections of code, and so on. We can even timestamp our output records so that we can use this method to look for processing speed problems.
Following the test run, we can analyze the results of our test more quickly than if we were using displayed information. We can focus on just the items that appear most informative and ignore the rest. This type of debugging is fairly easy to set up and to refine, as we identify the variables or code segments of most interest. We can combine the approach of using text output to track activity with the ERROR statement approach (described following). To do so, we output to an external text file, and then close it before invoking the ERROR statement, so that its contents are retained following the termination of the test run.
One of the challenges of testing is maintaining repeatability. Quite often, we need to test several times using the same data, but the test changes the data. If we have a small database, we can always back up the database and start with a fresh copy each time. But that can be inefficient and, if the database is large. If we are using the built-in NAV Test functions, we can roll back any database changes so the tests are totally repeatable. Another alternative is to conclude our test with an ERROR function to test and retest with exactly the same data.
The ERROR function forces a run-time error status, which means that the database is not updated (it is rolled back to the status at the beginning of the process). This works well when our debugging information is provided by using the Debugger or by use of any of the DIALOG functions just mentioned prior to the execution of the ERROR function. If we are using MESSAGE to generate debugging information, we could execute CONFIRM immediately prior to the
ERROR statement and be assured that all the messages are displayed. Obviously, this method won't work well when our testing validation is dependent on checking results using Navigate or our test is a multi-step process such as order entry, review, and posting. In this latter case, only use of the built-in Test functions (creating Test Runner Codeunits, and such) will be adequate. But in some situations, use of the ERROR function is a very handy technique for repeating a test with minimal effort.
When testing just the posting of an item, it often works well to place the test-concluding ERROR function just before the point in the applicable Posting codeunit where the process would otherwise be completed successfully. In order for the Rollback function to be effective, we must make sure that there aren't any COMMIT statements included in the range of the code being tested.
As defined in the Help Debugging (which should be studied), debugging is the process of finding and correcting errors. NAV 2015 has a powerful built-in debugger. The user interface for the NAV 2015 Debugger is written in C/AL. The Debugger objects can be identified by filtering in the Object Designer, All objects, on *Debug*. Reviewing the structure of the Debugger objects in C/SIDE may help better understand its inner workings.
The new Debugger can be activated in multiple different ways including from within the Development Environment, from within the RTC, from a command line, and by means of a C/AL function. The latter two options attach to a session at the same time as they activate. The best choice for activation method depends on the specific situation and the debugging technique being utilized by the developer.
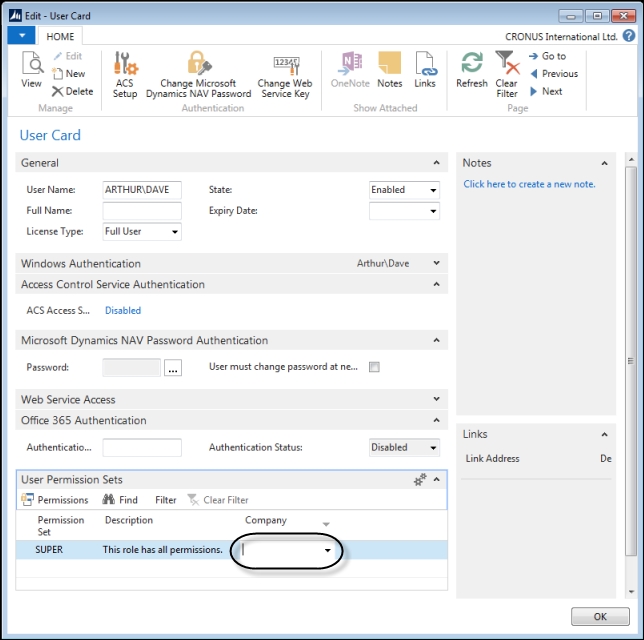
Only a user who has SUPER permissions for all companies is allowed to activate the debugger. The user permissions setup should have an empty Company field as we can see in the circled space in the following image:
Activating the Debugger from the Development Environment is a simple matter of clicking on Tools | Debugger | Debug Sessions… (or Shift + Ctrl + F11). The initial page that displays when the Debugger is activated will look like the following screenshot (typically with each session having a different User ID). Multiple sessions can be debugged in parallel:

If we activate the Debugger by means of any method that does not specify a session, this same screen will appear. The Debugger can also be activated from within the RTC as follows:
- Enter
Sessionsin the Search box. - Select the link displayed (Administration/IT Administration/General).
- In the General section, click on Sessions.
We can also get to this same point by clicking on the Departments button in the Navigation pane, then IT Administration | General, followed by Sessions in the Tasks section.
However we activate it, the Debugger runs as a separate independent session, which can be attached to an operating session. The Help Activating the Debugger describes activating the Debugger to debug a Web Service. The Help Configuring NAS Services has information about using the Debugger with a NAS Service.
From the Edit – Session list screen, we have two options for attaching the Debugger session to a session. One way is to highlight a Session and then click on the Debug icon:

The other way is to click on the Debug Next icon, then initiate a new Session. The Debugger will be attached to the new Session:
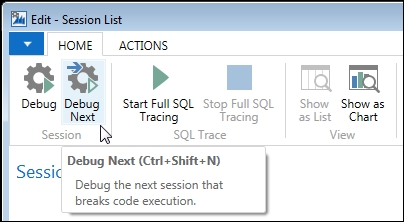
When we click on Debug Next, an empty View – Debugger page will open, awaiting the event that will cause a break in processing and the subsequent display of Code detail, Watched variables, and the Call Stack.
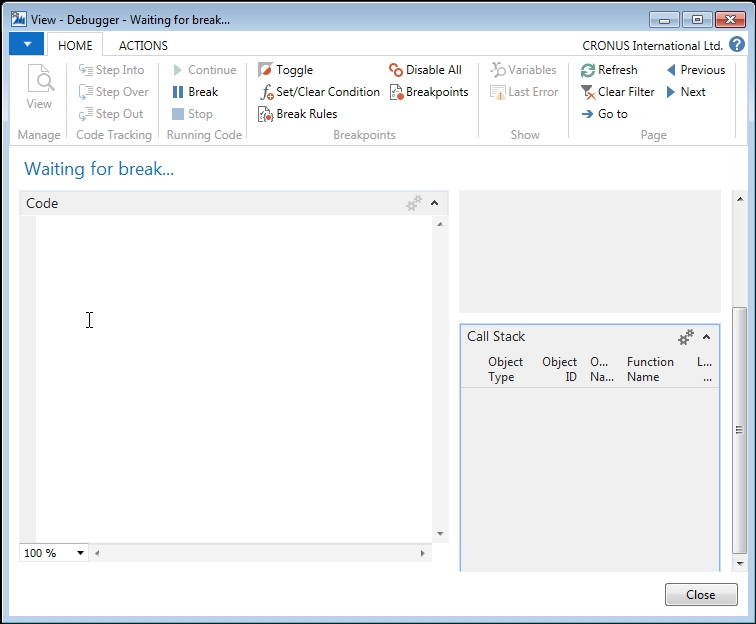
Once the Debugger is activated and attached to a session, some break event must occur to cause the debug trace and associated data display to begin. Break events include (but are not limited to) the following occurences:
- An error occurs that would cause object execution to be terminated
- A previously set Breakpoint is reached during processing
- The record is read when Break on Record Changes Break Rule is active
- The Break icon in the Running Code group is clicked in the ribbon of the View – Debugger page
- A Breakpoint Condition, which has been set in the Breakpoints group in the ribbon of the View – Debugger page, is satisfied during processing
Of the preceding events, the two most common methods of starting up a debug trace are the first two, an error or reaching a previously set breakpoint. If, for example, an error condition is discovered in an operating object, the debugging process can be initiated by:
- Activating the debugger.
- Attaching the debugger session to the session where the error will occur.
- Running the process where the error occurs.
When the error occurs, the page parts (Code, Watches, and Call Stack) in the debug window will be populated and we can proceed to investigate variable values, review code, and so forth.
Breakpoints are stopping points in an object which have been set by the developer. Breakpoints can be set in a variety of ways including in the Development Environment, in the View – Debugger Code page, and in the Edit – Debugger Breakpoint List.
While the latter two locations for setting breakpoints may be very useful while we are in the middle of a debugging session, those breakpoints only display while the Debugger is active. Once we exit the debugging session, those breakpoints that were set in the Debugger will disappear from view, while the breakpoints that were set from within the applicable C/SIDE Designer will remain visible and available for use until removed.
The result may be somewhat confusing because when we can only see all of the breakpoints when we are in the Debugger. If we try to set a breakpoint in the Development Environment and a breakpoint has already been set on that line of code while in the Debugger, we will get an error message:
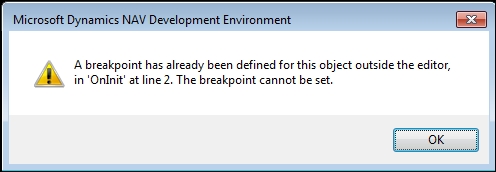
For this reason, it may be better practice to set all our planned testing breakpoints in the Development Environment. When we set breakpoints within the Debugger, we should clear them before ending our test session. Otherwise we may later run into breakpoints we didn't remember existed and which we can't see in the Designers.
Active breakpoints are represented in code by a filled in circle. Disabled breakpoints are represented by an empty circle. Examples are shown in the following code:

When viewing the C/AL code in a Designer, breakpoints can be set, disabled, or removed by pressing the F9 key. When viewing the C/AL code in the Code window of the Debugger, breakpoints can only be set or removed by pressing the F9 key or clicking on the Toggle icon. Other Debugger breakpoint controls are shown in the following image.
The following screenshot shows the debugger window:
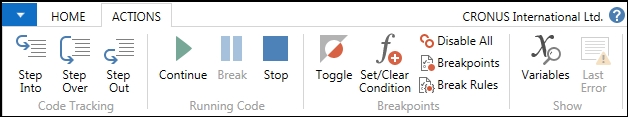
The ribbon actions in the Debugger window are as follows:
- Step Into: Designed to trace into a function.
- Step Over: Designed to execute a function without stopping, and then break.
- Step Out: Designed to complete the current function without stopping, and then break.
- Continue: Continue until the next break.
- Break: Break at the next statement.
- Stop: Stop the current activity but leave the debugging session active.
- Toggle: Set or clear a breakpoint at the current line.
- Set/Clear Condition: Set or clear a conditional (based on C/AL expression) breakpoint at the current line.
- Disable All: Disables all checkpoints in the attached session.
- Break Rules: Displays the following screen:

- Break On Error default is on
- If Break On Record Changes is on when a debug session is attached to an operating session, the debugging will start immediately
- Skip Codeunit 1 default is on, allowing all the Codeunit 1 processing to normally be processed without tracing
- Breakpoints displays a list of the active breakpoints and provides action options to enable, disable, or delete breakpoints individually or in total.
- Variables displays the Debugger Variable List where we can examine the status of all variables that are in scope. Additional variables can be added to the Watch list here.
- Last Error displays the last error message shown by the session being debugged.

Variables can be removed from the Watch list in the Debugger Watches page part.
There are quite a number of valuable Help sections on use of the Debugger including the following (and many others):
- Debugging
- Debugger Keyboard Shortcuts
- Breakpoints (this one is especially good)
- Closing the Debugger
- How to: Add Variables to the Watches FactBox
- How to: Debug a Background Session
- How to: Manage Breakpoints from the Development Environment
- How to: Set Conditional Breakpoints
- Walkthrough: Debugging the Microsoft Dynamics NAV Windows Client
While a debugger session is active, we can open the object being debugged in an appropriate Designer, change the object, save, and recompile it. The revised object will immediately be available to other sessions on the system. However, the version of the object that is being executed and in view in the debugger is the old version of the object, not the changed one. Furthermore, if we refresh the view of the code in the Debugger Code window, the new version will be displayed while the old version continues to be executed, leaving potential for significant confusion. Therefore, it's best not to change an object and continue to debug it without starting a new session.