
Chapter 13
Using Reports, Portals, and Dashboards
What's in this chapter?
- Understanding Team Foundation Server data stores
- Understanding the available reporting tools
- Creating and customizing reports using Excel
- Creating Report Definition Language (RDL) reports with Report Designer and Business Intelligence Development Studio (BIDS)
Capturing information throughout the project is critical not only to project managers but to all team members. Equally important is the capability to analyze the information that was captured and understand it. With Visual Studio Team Foundation Server 2013, the mundane tasks associated with capturing are mostly automated, and give crucial time back to the team to focus on building software rather than capturing information associated with building it.
The agile planning tooling discussed in Chapter 12 shows ways in which you can use the real-time data from work items to help track work and plan sprints, but Team Foundation Server also provides powerful features used to analyze the data and understand it. All types of data are captured about the software development process, not just work progress but data about version control, builds, tests, and feedback. Tracking a project and monitoring it throughout its lifecycle is made easy with Team Foundation Server reporting and the dashboards.
This chapter examines the reporting capabilities of Team Foundation Server, including working with reports, customizing reports, and reviewing reports shipped out of the box. Dashboards serve the purpose of providing useful information in an easy-to-consume form to all stakeholders, even to those outside the core software development team. This chapter also shows how to customize the team project portal as a way to keep everyone up to date with the status of the project and the team.
Let's start with the reporting capabilities of Visual Studio Team Foundation Server 2013.
Team Foundation Server Reporting
Reporting is one of the most powerful features of Team Foundation Server. Right from the first release of Team Foundation Server (that is, Team Foundation Server 2005), the central repository and the reports have been cornerstones for software development teams and the management team alike. You can view any data stored in the Team Foundation Server repository as a report, which enables you to view and organize project metrics very easily. This includes work item tracking, build reports, version control stats, test results, quality indicators (performance and code coverage), and overall project health reports. Team Foundation Server ships with a set of reports out of the box (more on that later), but you can also create custom reports.
The reporting tools are not only useful for project managers, but also for team members in every role. For example, a developer can look at test results and hone in on specific bugs. Testers can look at a report to identify the work complete for testing, and so on.
Before looking into the details of reports, how to create custom reports, or the tools available to create reports, let's first look at how Team Foundation Server stores data. As you see in Figure 13.1, there are essentially three data stores that Team Foundation Server uses:
- Team Foundation Server operational store
- Team Foundation Server data warehouse
- Team Foundation Server OLAP cube

Team Foundation Server Operational Store
The Team Foundation Server operational store is the set of databases that stores all the data to run the Team Foundation Server application, including source control, build reports, test results, work item tracking, and so on. These are the relational databases that handle all live data. Hence, they are optimized for speed and performance. Multiple databases serve as the operational store, including the Tfs_Configuration database and the various databases for each team project collection. Typically, you don't have to deal with (or understand) the structure of this set of databases. You should never modify the data in this store directly, as you can very easily corrupt your TFS installation in doing so and render your server unsupportable by Microsoft. You will not target this store when reporting, due to the performance impact that you could very easily have on the running Team Foundation Server application. In addition, the schema of the operation store frequently changes between releases of Team Foundation Server (even between service pack releases), making any reports against the operation store fragile. If you cause a performance issue by creating reports directly against the operational store, you will be asked to remove those reports before Microsoft will support your server.
Team Foundation Server Data Warehouse
The Team Foundation Server data warehouse is specifically designed for querying and reporting, unlike the operational store, which is designed for transactions. The schema of the warehouse is much easier to understand; it has a star schema and includes all historical data designed in a manner to be used for analysis. Despite the fact that the schema of the operational store changes significantly between releases (and so changed greatly between the 2010 and 2012 release), the relational schema in the warehouse remains pretty much unchanged since the Team Foundation Server 2010 release. This is by design as it allows reports written against the data warehouse to have much greater resilience when the server is upgraded. The only schema changes in the 2012 release to the relation warehouse were the addition of start and end dates to iterations and the removal of some fields in 2010 that were used for configuration only. In the 2013 release there were no changes.
The Team Foundation Server data warehouse gets the data from the operational stores on regularly set intervals. There are adapters for each of the databases in the operational store that take care of pushing the data into the warehouse. In Team Foundation Server 2013, the update from the operational store to the warehouse is based on various events. When an event fires up, the corresponding adapter is scheduled to execute and refresh the data in the warehouse. The interval for this execution is configurable.
In Team Foundation Server 2013, you use the warehouse control service to change the refresh interval. Go to http://<TFS Server Name:port>/tfs/TeamFoundation/Administration/v3.0/WarehouseControlService.asmx. You must have permission to update the warehouse setting in order to access this service. The WarehouseControlWebService has the following operations:
BringAnalysisProcessingOnlineBringWarehouseProcessingOnlineChangeSettingGetJobPropertiesGetProcessingStatusGetSettingsProcessAnalysisDatabaseProcessDefaultDimensionsForExpandedCapacityProcessWarehouseSetAnalysisJobEnabledStateSetWarehouseJobEnabledStateTakeAnalysisProcessingOfflineTakeWarehouseProcessingOffline
In the WarehouseControllerService page, if you choose the operation GetSettings, it will show you the various processing jobs, their default values, and their current values. As you can see, the frequency with which the warehouse data refresh jobs are running is set to 120 seconds (or 2 minutes).
Team Foundation Server OLAP Cube
The star schema of the warehouse is suitable for analyzing the data. But as you get into reports that require aggregated values, the warehouse may not be the best choice. The aggregation of values can become slow, depending on the volume of the rows.
Enter the Team Foundation Server OLAP cube. This is a multi-dimensional database that aggregates data for better analysis. Hence, you can correlate data based on the different metrics (that is, work items, build, tests, and so on). Team Foundation Server OLAP cube gets the data from the warehouse at preset intervals. By default, a scheduled job runs every two hours to refresh the data in the cube from the warehouse. Note that a full processing of the analysis database is scheduled to run on a daily basis, as indicated by the interval of 86,400 seconds (or 24 hours) for the FullProcessIntervalSeconds setting.
The data in the cube can then be used by a variety of client tools, including Microsoft Excel, and SQL Report Designer.
The cube consists of measures and dimensions. A measure is a numeric value that can be aggregated. Dimensions provide a way to summarize measures and categorize them based on additional metrics.
Working with Team Foundation Server Reports
Team Foundation Server includes two sets of reports in most process templates: Microsoft Excel Reports and SQL Reporting Services Reports. There are about 40 reports in the three process templates that ship with Team Foundation Server. From a project management perspective, one of the great advantages of using Team Foundation Server is that you don't have to manually correlate data from a host of third-party sources. The reports are readily available in a dashboard (or portal).
You learn more about the reports shipped with the three process templates later in this chapter. But first, let's start by looking at the tools you use to create Team Foundation Server reports.
Tools to Create Reports
You can use any tool that can connect to a data warehouse or an analysis database to create a report. Following are the two primary types of reports that you create from Team Foundation Server by connecting to either the Team Foundation Server data warehouse or the Team Foundation Server OLAP cube:
- Excel reports
- RDL reports
Figure 13.2 shows a map of these two report types and shows which is appropriate against which Team Foundation Server data store.

As you see, you can use the work item queries and the Team Foundation Server OLAP cube with Microsoft Excel or use Team Foundation Server OLAP Cube and the data warehouse with the RDL reports.
To understand this better, let's dive in and create some reports.
Working with Microsoft Excel Reports
As mentioned earlier, you can use Microsoft Excel to create reports from either the Team Foundation Server OLAP cube, or by using work item queries. Using Excel to create reports is a very approachable and rapid way to understand the data inside your Team Foundation Server databases, and so the majority of the rest of this chapter focuses on explaining the various ways to use it.
Let's first look at the steps to create a Microsoft Excel report from the cube. Whichever store you are querying data against, the key advantage with Microsoft Excel reports is the simplicity of using the tool—regardless of whether you are connecting to a pivot table and the cube or using work item queries.
Creating Microsoft Excel Reports Using Data in the OLAP Cube
First, ensure that you have read access to the OLAP cube. Follow these steps to create a quick pivot table report using Microsoft Excel:
- Open Microsoft Office Excel.
- Select the Data tab from the ribbon.
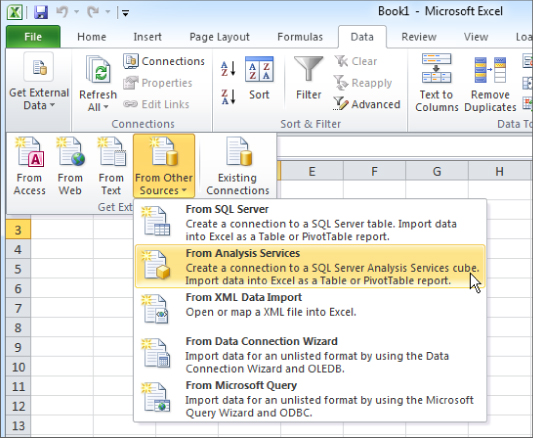
- Click From Other Sources and select From Analysis Services, as shown in Figure 13.3. The Data Connection Wizard displays.
- Provide the server name and credentials and then click Next. The Select Database and Table dialog displays, as shown in Figure 13.4.
- From the Select the Database That Contains the Data You Want drop-down, select
Tfs_Analysis. The interesting part is the list of perspectives and cubes. As you see in Figure 13.4, theTfs_Analysisdatabase has a cube named Team System. It is essentially a representation of the entire warehouse, and contains about 15 measure groups and 23 dimensions. That is one powerful (but complex) cube. If you have SQL Server Enterprise Edition installed (and separately licensed) then five additional perspectives are also available, which can simplify the data access. However, because the license for SQL Server Enterprise Edition is not included with a standard installation of TFS, we show the standard case and continue by selecting the Team System cube then clicking Next. - In the next dialog, click Finish to see the Import Data dialog. Leave the selection as PivotTable Report and click OK.
- You are now in the workbook with a list of fields from the Team System cube. You can build a report using any of these fields.

Next, we walk through an example that shows you how to create a report that answers the question, “How many active product backlog items or task work items are there in my project?” The example uses a project created using the Scrum process template.
To answer this question, you must know the number of work items of type Product Backlog Item or Task that also have a state of New, To Do, Committed, or In Progress. You can then list this data by the team member the work items are assigned to by showing the fields related to Work Item. Then add Work Item Count to the Values area by dragging and dropping it. Add WorkItem.System_WorkItemType and WorkItem.System_State to the Report Filter area and WorkItem.System_AssignedTo to the Row Labels area. Figure 13.5 shows the selection in the PivotTable Field List window.

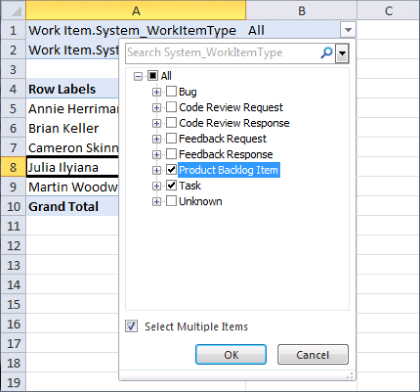
In the pivot table itself, select the drop-down for Work Item.System_WorkItemType, check the Select Multiple Items box, and then select both Product Backlog Item and Task, as shown in Figure 13.6. For the Work Item.System_State report field, perform the same procedure to select the desired work item states.
This results in a simple report that shows the active user story and task work items by team members, as shown in Figure 13.7.

This is not a particularly impressive looking report, but it demonstrates the point. By choosing the appropriate fields that you need for the pivot table, you can create a report in a very quick and simple manner. The focus should be on choosing the right source and then drilling down on data that you find surprising so you can understand the issue you have uncovered.
Customizing a Microsoft Excel Report
You don't necessarily start with a new report every time. In many cases, you may simply modify an existing report to get the data that you are looking for. In Team Explorer, you find existing Microsoft Excel reports in the team project under Documents ⇒ Excel Reports. The example reports you find in that directory vary by process template type. To customize a report, first choose the Microsoft Excel report that you want to modify. Open the report in Microsoft Excel by double-clicking the report file name in Team Explorer.
After you have the report open in Microsoft Excel, click the report cell to open the PivotTable Field List window and the toolbar. You use this field list to make necessary changes to the report. After you are finished making changes, you can either save them locally or publish them so others can see the updated report. You learn about the different publishing options later in this chapter.
Creating Microsoft Excel Reports Using Work Item Queries
Work item queries provide an easy way to retrieve information about work items in Team Foundation Server. The Shared Queries folder contains queries shared by everyone in your team project. The My Queries folder contains queries that only you can use. Chapter 11 provides more detail on work item queries.
In Team Foundation Server, you can use these work item queries to create a Microsoft Excel report, and do so quickly. Not only can you create Microsoft Excel reports, but you can also share them with the team by publishing them. It provides a quick and easy way to turn work item queries into reports. These report types are also available on a Team Foundation Server instance that does not have Reporting Services enabled—even the hosted Visual Studio Online (http://tfs.visualstudio.com), which lacks many of the other reporting features found in an on-premises Team Foundation Server instance.
Let's look at how to create a report in this way. In Team Explorer, go to the Work Items page. To create a report out of a team query, expand the Shared Queries node. Right-click a work item query to view the menu shown in Figure 13.8.
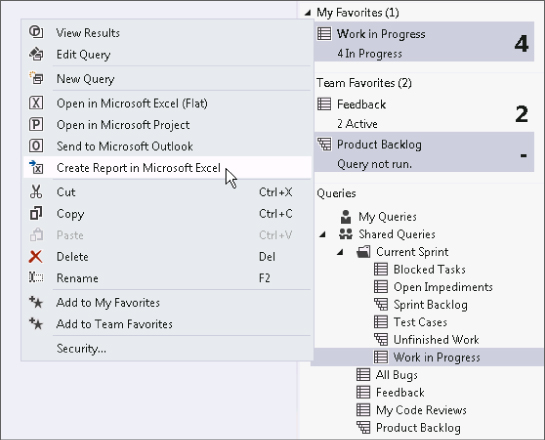
Click the Create Report in Microsoft Excel option, which then launches Excel. The first thing that happens is that Excel translates the work item query into data that it can use to generate reports. After that, it presents a New Work Item Report window, as shown in Figure 13.9.

There are two buckets of reports—Current Reports and Trend Reports—in this example, with six reports in each. However, the reports available depend on the type of work item query that you select. To understand where these reports come from, let's look at the query and the results shown in Figure 13.10.
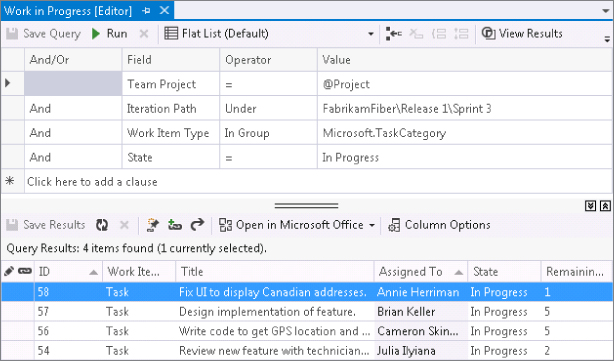
The Work In Progress query from the Scrum process template is selected in this example. The result of this query returns the following fields:
- ID
- Work Item Type
- Title
- Assigned To
- State
- Remaining Work
You get reports on the values that can be aggregated, such as Remaining Work, and the default Work Item count. Each of these reports also has variations based on attributes, such as the Work Item Type, Assigned To, and State—hence, the six reports that you see in Figure 13.10. The trend reports are based on the work item history data.
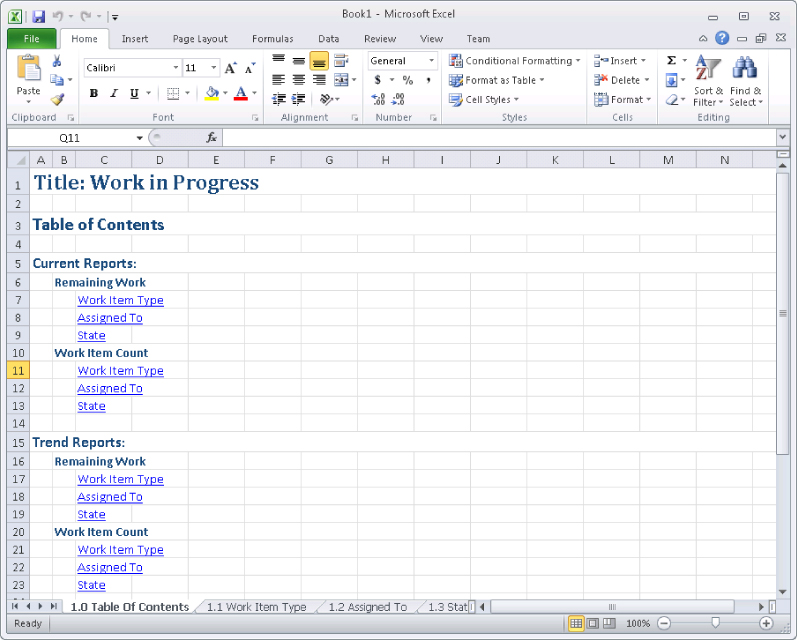
Now, return to Microsoft Excel to generate the reports. From the New Work Item Report window (Figure 13.9), select the reports you want to see generated, or select them all. Click Finish and Microsoft Excel begins working on the reports. When the report generation is completed, you see an Excel workbook with 13 worksheets—one worksheet with the table of contents (as shown in Figure 13.11), and 12 worksheets for each of the 12 reports.
Each of these reports is a pivot table report. You can customize these reports by modifying the fields using the PivotTable Field List window, as shown in Figure 13.5.
Publishing Microsoft Excel Reports
Now that you understand the basics of creating and customizing Microsoft Excel reports that are based on the data from Team Foundation Server OLAP cube and the work item queries, let's look at the options you have to publish them. Obviously, you do not have to worry about publishing if you don't have to share the reports you create. In that case, you can simply save them locally. But it is highly likely that you will be sharing reports with the rest of the team.
The publishing options for Microsoft Excel reports depend on whether you have SharePoint Enterprise running your dashboard/portals, or SharePoint Standard/Foundation for your portals. Table 13.1 summarizes the capabilities for SharePoint Enterprise users versus SharePoint Standard/Foundation users.
Table 13.1 SharePoint Server Enterprise versus SharePoint Foundation
| Feature | SharePoint Enterprise | SharePoint Standard/Foundation |
| Team site | Portal with six dashboards. | Portal with two dashboards. |
| Reports | Dashboard uses Excel reports. | Dashboard uses Report Definition Language (RDL) reports. |
| Viewing Microsoft Excel reports | Viewable as Web parts. | Open in Excel from the document library. |
| Microsoft Excel reports are available in: | Team Explorer under Documents ⇒ Excel Reports. | Team Explorer under Documents ⇒ Excel Reports. |
| Creating new Microsoft Excel reports | From Excel, create a new report and publish it to Excel Services. Make it available on the dashboard using the New Excel Report button from the dashboard. | From Excel, create a new report and save it to the document library. |
| Publishing Microsoft Excel reports | Publish to Excel Services and make the report available in the dashboard by using the Excel Web Access Web part. | Save the report to the document library and view it in Excel. |
| Dashboards | A set of dashboards (for example, Work Progress, Product Quality, Test Progress, and so on) are created as part of the Team Project setup. | Excel reports are not available. RDL reports are presented in Web parts. |
Publishing to a Document Library
You can publish a report to the shared documents from Team Explorer, or you can use the SharePoint Portal and upload the document.
To upload it from Team Explorer, navigate to the folder you want to upload the new report to. This example uploads a new report called “Current Work Item count by state.” To do that, first find the Excel Reports folder under Team Explorer ⇒ Documents ⇒ Excel Reports. Then, right-click the Excel Reports folder and select Upload Document from the menu.
You can then select the Excel report that you have saved locally and upload it. After you have done so, refresh Team Explorer and the new report appears in the Documents page.
You can also upload the Excel report from outside Team Explorer. To do that, open the Team Project portal. When you're in the project portal, click the Excel Reports link on the right navigation bar and upload the report to this folder.
Publishing to Excel Services
A project portal is a SharePoint site. If you are running SharePoint Server 20102013 Enterprise, then you have access to Excel Services. You can publish Excel reports to Excel Services. Doing so provides the option to display the Excel report using the Excel Web Access Web part in the dashboard. This enables you to easily and quickly create Excel reports and share them broadly with the team using dashboards.
First, start with an Excel report. Create an Excel report following the steps described earlier in this chapter, or open an existing report.
Click File ⇒ Save & Send ⇒ Save to SharePoint, to open the familiar dialog that enables you to Save As on the server. Verify that the path information is correctly set to the team's portal path. If not, change it to the correct path. Then, click the Publish Options button.
Now you are in the Publish Options dialog, as shown in Figure 13.12.

In this window, there are two tabs: Show and Parameters. You are only using the Show tab here. The Parameters tab is used to specify cells that you can provide value to while viewing the Excel report.
In the drop-down, select Items in the Workbook because you want to publish the Excel report to Excel Services and have the chart show up in the dashboard using the Excel Web Access part. You don't want the entire spreadsheet to show up in the dashboard; you just want the short version. Selecting Items in the Workbook in the drop-down changes the view in the box below the drop-down. Now you have the capability to select all charts or individual charts, as well as all pivot tables or individual pivot tables. In this example, you have only one chart and one pivot table. Select the 1.2 Assigned To chart, as shown in Figure 13.12.
Click OK in this window and then click Save to publish the report. Now you are finished with the publishing.
The next step is to add the report to the dashboard. To launch the dashboard, in the Team Explorer Documents page, click the Show Project Portal link to open the project portal in the browser. Select Excel Reports from the left navigation to see the list of Microsoft Excel reports, including the new report you just published.
You now want to get this report onto the dashboard. From the Dashboards list, select the dashboard to which you want to add this report. You can choose between My Dashboard and the Project Dashboard. In this example, select the Project Dashboard.
To add the new report to this dashboard, click Site Actions on the top-right corner and select Edit Page.
If you have worked with SharePoint sites and Web parts, then the next few steps will be very familiar to you. You add a new Web part to this page by clicking the Add Web Part button in the Footer section.
The Add Web Parts to Footer window displays. Select the Excel Web Access Web part and click Add.
The Excel Web Access Web part is added to the dashboard page. Select a workbook that you want to display in this Web part. You do that by specifying the details in the tool pane. There is obviously lots of information that you can provide in this tool pane. The following are the two fields that you will update here:
- Workbook
- Title
Click OK on the tool pane window and exit the edit mode to see this report displayed in the dashboard.
Microsoft Excel reports make it truly easy for team members to get the data and metrics that they want from Team Foundation Server, and for the team to keep their project portal up to date with the most useful information to them. The capability to create a report from a work item query is a great addition to the reporting capability in Team Foundation Server. Couple that with the Microsoft Excel services and dashboards, and no one will be able to complain about not having the right information at the right time.
Working with RDL Reports
This section briefly examines the tools available to create and customize Report Definition Language (RDL) reports. Team Foundation Server 2013 includes a set of RDL reports out of the box, and the reports vary by the type of process template you choose to use for your project.
There are two main tools available to work with RDL reports:
- SQL Server Report Builder
- SQL Server Business Intelligence Development Studio (BIDS)
SQL Server Report Builder
The Report Builder tool has full support for SQL Reporting Services and provides a Microsoft Office-like-report-authoring environment. SQL Server 2012 SP1 includes Report Builder 3.0. This version includes many improvements over previous versions that make it a compelling choice for report authors. It's designed for business analysts and developers who want to create custom reports quickly and easily. You can download the tool from http://aka.ms/sql2012rb. With this tool, you can work with RDL files, make necessary changes, and save it as an RDL file. This file can then be accessed, for example, using the Report Designer.
After you have the tool installed, launch the Report Builder and start by connecting the report server. (For example, http://![]() Server instance name/reportserver
Server instance name/reportserver![]() .) It is probably easier to start with an existing report and customize it than it is to create one from scratch.
.) It is probably easier to start with an existing report and customize it than it is to create one from scratch.
To edit an existing report, select the reports folder in the report server, then the team project collection, followed by the actual team project. The folders with the reports display, and you can choose the report you want from one of these folders.
The report data pane has the parameters, data set, and the built-in fields that you work with to modify the report.
SQL Server Business Intelligence Development Studio
Business Intelligence Development Studio (BIDS) is an integrated environment for developing cubes, data sources, and reports. It is a much more complex tool than Report Builder, but it gives you the ability to create highly complex and rich reports. To install BIDS, run the setup program for SQL Server, and select the Client Components check box when you specify the components to install. BIDS is actually an add-on to Visual Studio 2010; therefore, if you don't already have this older version of Visual Studio installed on your machine, then BIDS installs a Visual Studio 2010 shell just for the BIDS tooling. This can live happily alongside your Visual Studio 2013 installation. For help, refer to “Create a Report Server Project for Visual Studio ALM” on http://aka.ms/reportstfs.
Summary
In this chapter, you read about the various data stores in Team Foundation Server that provide the data for the various reports. You also learned about the tools that are available to create reports. This chapter examined how to create and customize Microsoft Excel reports, and the tools available to create and customize RDL reports (that is, Report Builder and BIDS), as well as the options available for publishing reports.
Reporting is a powerful feature in Team Foundation Server. It breaks down the usual barrier within teams caused by a lack of information. Team Foundation Server provides a powerful set of reports out of the box and provides the capability to add reports based on your needs. All this is coupled with the capability to quickly share the information using dashboards and portals.
Chapter 14 looks at how to understand the architecture of the software that you are building, what Microsoft's approach is to software architecture, and the tooling that's available in the Visual Studio 2013 release.