
Understand the different types of tests supported by Visual Studio 2010
Learning about how to create, organize, and run tests within Visual Studio
Publishing test results to Team Foundation Server
The next several chapters will introduce the testing functionality supported by Visual Studio 2010. Visual Studio provides support for authoring a wide range of tests, all designed to help you identify bugs in your software before your users do.
One of the most substantial investments Microsoft has made in Visual Studio 2010 is improved support for software testing. Microsoft has also focused considerably on better integration of those testing activities into the rest of the software development lifecycle, such as the handoff of detailed bug reports from a tester to a developer.
Perhaps the most notable addition to Visual Studio 2010 is the completely revamped support for authoring, executing, and managing manual tests. Manual testing — essentially just a form of testing that requires human input and validation — is usually performed by generalist testers, and is by far the most common type of testing conducted in the software development industry. Hence it's a natural extension of the Visual Studio family of products to support the generalist tester with better tools and testing frameworks. Manual testing is covered in detail in Chapter 14.
Visual Studio 2010 also introduces support for managing virtualized testing environments. Visual Studio Lab Management 2010 makes it possible to automatically spin up virtual machines for testing your software under a variety of configurations.
As testers discover them, they can easily file bugs, along with a pointer to a snapshot of the virtual environment that the developer can use to quickly analyze the state of the machine when the test case failed. Lab Management is covered in greater detail in Chapter 16.
The testing tools in Visual Studio 2010 are tailored for different testing-oriented roles generally found within software development and testing teams. Some individuals may perform more than one role, in which case a team member may use multiple tools.
Visual Studio Test Professional 2010 — The Test Professional product is primarily targeted at generalist testers who will be authoring, executing, and managing manual tests. It includes the Microsoft Test Manager and Microsoft Test Runner tools. These tools are introduced in more detail later in this chapter, and covered extensively in Chapter 14.
Visual Studio 2010 Premium and Visual Studio 2010 Ultimate — The Premium and Ultimate editions of Visual Studio 2010 include functionality that is designed for specialist testers. A specialist tester is usually a software developer who focuses on writing software that is responsible for testing other software. Examples of duties that this role might perform include authoring tests that simulate large-scale load against a Web application, or converting manual test cases into automated tests that can be run without requiring human intervention. Visual Studio 2010 Premium includes the capabilities to write coded user interface (UI) tests. Visual Studio 2010 Ultimate includes all of the functionality from Premium, in addition to the capability to author Web performance tests and load tests. Visual Studio 2010 Ultimate also includes the functionality found in Visual Studio Test Professional 2010, effectively making Ultimate a superset of both Premium and Test Professional.
You will learn about the aforementioned test types next. For now, it is just important to know that testers who focus on manual testing can likely just purchase the less-expensive Test Professional product, whereas testers responsible for developing automated tests should look into either Premium or Ultimate. Team members responsible for managing and monitoring test plans (for example, test leads) may also use the Test Professional product to do so.
Note that Visual Studio 2010 Professional, Premium, and Ultimate all include the capability to author unit tests (see Chapter 7), as well as generic tests and ordered tests (covered later in this chapter). Premium and Ultimate also provide the capability of authoring database unit tests (see Chapter 10). For more information on the overall Visual Studio 2010 family of products, see the Introduction at the beginning of this book.
Visual Studio 2010 provides support for authoring and executing a variety of test types, each with its own purpose for testing your applications. A successful test plan will likely include a mix of multiple types of tests from the following list:
Manual test — A manual test simply requires a human to interact with an application, verify some expected result, and report on whether or not a test was successful. As you will see later, a manual test is the only type of test that is represented as a Visual Studio Team Foundation Server 2010 work item (a test case), instead of as a source code file. Manual tests are covered in detail in Chapter 14.
Manual test (text/Word format) — This is a legacy test type from earlier editions of Visual Studio. It is simply a document containing a list of manual test steps that a tester should execute. If you have tests in this format, they will continue to work with Visual Studio 2010, but in order to benefit from the new manual testing tools and framework, you should consider migrating them to test cases, described in Chapter 14.
Coded UI test — A coded UI test provides the capability to author tests that automatically interact with the user interface of an application, verify some expected result, and file bugs if an error is encountered. Since this whole process is automatic, it can be run very frequently, and without human interaction, but it is typically more expensive to author and maintain than a manual test would be. Coded UI tests are detailed in Chapter 15.
Unit tests — These are low-level tests verifying that target application code functions as the developer expects. Unit tests are essentially code that tests other code. Unit testing is described in detail in Chapter 7.
Database unit test — Visual Studio 2010 also provides the capability to write unit tests against database code (for example, T-SQL code within a SQL Server database). Database unit tests are covered in Chapter 10.
Web performance test — A Web performance test is used to verify functionality or performance of a Web application. For example, you may create a Web performance test to verify that a user can create a new account on your site. This Web performance test could be one of a suite of Web performance tests that you run periodically to verify that your Web site is working as you expect. For more information on Web performance tests, see Chapter 13.
Load tests — These tests verify that a target application will perform and scale as necessary. A target system is stressed by repeatedly executing a variety of tests. Visual Studio records details of the target system's performance and automatically generates reports from the data. Load tests are frequently based on sets of Web performance tests. However, even non-Web applications can be tested by selecting a number of unit tests to execute. For more information, see Chapter 13.
Generic tests — These tests enable calling of alternative external testing systems, such as an existing suite of tests leveraging a third-party testing package. Results of those tests can be automatically parsed to determine success. This could range from something as simple as the result code from a console application to parsing the XML document exported from an external testing package. More information on working with generic tests can be found in the product documentation.
Ordered tests — Essentially containers of other tests, these establish a specific order in which tests are executed, and enable the same test to be included more than once. For details, see the section "Using Ordered Tests," later in this chapter.
Sometimes, more than one test can be used to verify that a given piece of an application is behaving correctly. For example, both coded UI tests and Web performance tests can be used to verify the functionality of a Web application. But, as you become more familiar with coded UI tests versus Web performance tests, you will see that the former is better suited for validating functionality and UI layout, whereas the latter is better suited for checking performance and scalability (when used within a load test). You will get a better sense of which test to use in different situations in the detailed chapters for each test type.
A key challenge with software testing is that of providing developers with enough information about a failing test so that the developer can adequately debug and fix the problem. How often have you seen bugs get resolved as "No Repro" because a developer wasn't able to reproduce a bug discovered by a tester? Unfortunately, the phrase "It works on my machine" has become an all-too-common part of the software development pop culture.
One of the major ways in which Microsoft is attempting to eliminate the "No Repro" problem in this release of Visual Studio is with diagnostic data adapters. A diagnostic data adapter is responsible for collecting information about one or more machines under test. The information collected from these diagnostic data adapters can then be attached to a bug, providing the developer with a rich amount of information with which to diagnose a problem.
Visual Studio 2010 ships with several diagnostic data adapters that can be enabled during test runs, including the following:
Action log and action recording — This adapter is useful for manual tests. It can capture a log of exactly what steps testers took when they encountered a bug. For example, a developer studying the action log can determine that a tester clicked the Username textbox, typed "Brian," and then pressed the Enter key. A developer no longer has to guess about what testers were doing when they encountered a bug. Action recordings can also be used to fast-forward pieces of a manual test during subsequent test runs (see Chapter 14). The action recordings can even be used to automate a manual test by turning it into a coded UI test (see Chapter 15).
ASP.NET Profiler — This data adapter can be used on remote machines when conducting a load test. It provides granular profiling information about an ASP.NET application, which can be used to more accurately diagnose performance bottlenecks. This data diagnostic adapter is available for use only with ASP.NET load tests.
Code coverage — Code-coverage information can be used to determine which code paths are executed during an automated test. This can be analyzed later to determine if there are sections of code that are not being touched by your test plan, possibly indicating that additional test coverage is necessary. Code coverage is only available for automated tests, not for manual tests.
IntelliTrace — IntelliTrace is a powerful way of capturing granular debugging information about a .NET application being tested. This information can then be loaded into Visual Studio 2010 Ultimate by a developer to analyze exactly what was happening when a bug was encountered. For more information about working with IntelliTrace, see Chapter 11.
Event log — This adapter can capture events that were written to the event log while a test was executing.
System information — This adapter will gather system information and attach it to a bug. Now a developer no longer has to guess about the operating system version, 32- versus 64-bit, how much RAM, what version of browser, or other such critical information about the machines involved in a test run.
Test impact — Test impact analysis is a powerful new feature of Visual Studio 2010 that analyzes which blocks of code are exercised by your tests. This data can later be used to help you determine which tests need to be re-run based on which blocks of code were changed in your application since the last time those tests were run. Test impact analysis can, therefore, help your test team focus on running the most important tests, based on which pieces of your application are churning. You will explore the benefits of test impact analysis with manual testing in Chapter 14, and with automated tests later in this chapter in the section "Test Impact View."
Video recorder — The video recorder data adapter captures a recording of an application under test. This recording can help a developer diagnose problems with an application's UI, and can be used with both manual and automated tests (such as a coded UI test).
A diagnostic data adapter can also be used to impact a machine during a test. Visual Studio 2010 ships with one such adapter:
Network emulation — The network emulation data adapter doesn't collect any data, but instead can be used to force a machine into behaving as if it had a slower network connection. For example, you may wish to simulate the experience that users in remote locations will have when connecting to your corporate network over a 56K modem link.
You can also create your own custom diagnostic data adapters. For example, you might be interested in capturing inbound network traffic on a given port that may be relevant to the behavior of your application. Or, you might want to author a custom adapter that impacts a machine, such as by rapidly reading from and writing to the hard disk in order to simulate heavy hard disk activity during a test. For information on creating a custom diagnostic data adapter, see the product documentation topic "Creating a Diagnostic Data Adapter to Collect Custom Data or Impact a Test System" at http://msdn.microsoft.com/en-us/library/dd286743%28VS.100%29.aspx.
Note
There are limitations with using some diagnostic data adapters in certain configurations. For example, the code coverage adapter may not be used with manual tests, and may not be run in conjunction with the test impact or diagnostic trace adapters. For more information, consult the product documentation topic "Setting Up Machines and Diagnostic Information to be Collected Using Test Settings" at http://msdn.microsoft.com/en-us/library/dd286743%28VS.100%29.aspx.
Using the right set of adapters can dramatically reduce the amount of time required to diagnose and solve a problem and can also reduce the back-and-forth communication required between a developer and a tester. You will discover how to configure diagnostic data adapters for manual tests in Chapter 14. Configuring diagnostic data adapters for automated tests within Visual Studio is covered later in this chapter.
Microsoft Test Manager is a new tool provided as part of the Visual Studio 2010 family of products. It provides a single environment from which to author and manage test cases, manage test plans, and define and manage your physical and virtual test environments (if using Lab Management). Figure 12-1 shows a typical view within Microsoft Test Manager.

You will become familiar with using Microsoft Test Manager in Chapters 14 and 16.
Note
Even if you aren't making use of the manual testing or lab management capabilities of Visual Studio 2010, you may wish to use Microsoft Test Manager to create and manage your test plans. As you will see in Chapter 14, test plans can include automated tests (for example, unit tests, coded UI tests, and so on), in addition to manual tests. Organizing automated tests into test plans is an effective way of tracking the overall status of your testing efforts.
With the exception of manual tests (which are represented as work items within Team Foundation Server), all other test types within Visual Studio are stored as source code files. These tests are usually authored with Visual Studio, stored within source control (such as Team Foundation Server), and are tracked as essential artifacts of your development project. As your project grows, so should the suite of tests you write, which can help you verify the expanded functionality of your software.
Because these tests are so critical to project success, it is not uncommon for projects to have dozens, sometimes even hundreds or thousands, of tests. Fortunately, Visual Studio offers ways to organize and execute tests. In this chapter, you will learn how to use those features to work effectively with your application's tests, whether you have 5 or 5,000 tests to manage.
You will begin by learning about test projects, a special project type that you can use to contain your automated tests. You will learn about the creation of test projects, as well as the various options you can specify when a new test project is created.
Then, you will discover the Test View window and how to group your tests into test categories. Test categories offer effective ways to organize and execute the tests contained in your solutions.
You will learn about the management of test results. The Test Results window is described in detail. The files used to store test run results, called TRX files, are also discussed. You will learn how to export and import test run results and how to publish test run results to Team Foundation Server for tracking and reporting purposes.
Finally, an additional test type called an ordered test is introduced. Ordered tests are essentially containers of other tests, offering a convenient way to group and execute tests in a specified order.
Visual Studio offers a project template called a "Test Project." Projects of this type provide a convenient way to store automated tests. You may decide to have all of the tests in your test project be of one type, or you may mix different types of tests within the same test project.
Placing your tests in a test project has the additional benefit of keeping them separate from your implementation code, reducing the risk that you'll accidentally deploy test code to your production environment.
There are a number of ways to create a new test project. You can create a test project before you create any tests, or you can create one as you are creating a new test.
To create a new test project within Visual Studio you can right-click on an existing solution and choose Add

Under Installed Templates, choose the Test category under the language you wish to use for your tests (either Visual Basic or Visual C#). Select Test Project from the Templates list, and assign a name to your project. If you do not already have a solution, you will be able to create one here.
When creating tests, Visual Studio will offer to automatically create a test project for you if you do not already have one.
When your test project is created, Visual Studio adds three files to your solution's Solution Items folder. Two of these files are default test settings. These files have an extension of .testsettings. These files contain the various settings that determine how your tests will be executed. You can double-click on these file to display those settings. Test settings are covered later in this chapter in the "Test Settings" section.
The other file, known as the test metadata file, is also XML-based and is named <ProjectName>.vsmdi. This file stores information about your solution's test lists and links to any contained tests. Double-clicking this file will open the Test List Editor. Note, however, that test lists have been deprecated in this version of Visual Studio and replaced by test categories. Test categories are covered later in this chapter.
Note
The one area of Visual Studio 2010 where test lists are still required is when working with Team Foundation Server check-in policies, which require test lists. If you find that you need to create a test list, see the product help topic titled "How to: Create a Test List."
You may notice that the test project you have created is not empty. By default, a sample unit test file is included with your test project, and you can configure templates for other test types to be included by default as well. These can serve as a helpful starting point as you add your tests, but you can safely delete them if you choose. To change what types of files are added to a new test project, select Tools

You may set the default language for new test projects using the drop-down list at the top. This setting will save you some time later, because you will not need to choose the language each time you create a new test project, though you always have the option to override this setting.
Below that, you will see a list of file types organized by test project language. Notice that several file types are already selected for you. The types of files that are automatically included can be specified by language type. For example, you may wish that Visual Basic test projects are always created empty, while your C# test projects include a sample unit test file. Select which files you wish to include, if any, and click OK.
As you start to use the variety of test types supported by Visual Studio, you may quickly find yourself with many tests in your solutions. Visual Studio projects can have hundreds or thousands of unit tests alone. Add suites of Web performance, load, and other tests and you could quickly have difficulty finding the right tests at the right time.
Fortunately, Visual Studio allows you to organize your tests using test categories. The Test View window is your main interface for organizing and executing your tests using test categories.
To access Test View, select Test

By default, Test View does not display the test categories property that you will use to classify your tests. To add this column, right-click on a test (or in the whitespace of this window), and select Add/Remove Columns. Add the Test Categories column and click OK.
The Test Categories column should now be visible within the Test View, but unless you have previously categorized your tests, this column will be empty. Categorize your first test by highlighting it from the Test View list and examining the Properties window (or right-click the test and select Properties, if your Properties window isn't already open). Find the Test Categories row and click the dotted ellipsis to open the Test Category editor shown in Figure 12-5.

Type BVT into the Add New Category textbox, and click on Add to define your first category. Click OK and notice that the test you selected now has a value of BVT in the Test Categories column of the Test View window. Note that you can assign a test to multiple categories if you wish.
Note
The term BVT is short for "built verification test." A BVT should be an automated test that can run fairly quickly without user interaction or additional set-up work. BVTs can be used to help you quickly determine whether basic functionality is working. These can be run locally by a developer and can also be scripted to run as part of an automated build (see Chapter 21).
Double-click on that test to open the test within the code editor. You should notice that the test now has a new attribute denoting that it is part of the BVT category, such as the following:
[TestCategory("BVT"), TestMethod]
public void TestDivision()
...
You can also categorize a test by manually adding this attribute to the desired tests. If you use this approach, you must first save the file and then click the Refresh button within Test View for changes to take effect.
Selecting and executing tests in Test View is simple. Just highlight one or more tests and click the Run Tests button. You can also right-click and choose Run Selection. To select multiple tests, hold down Ctrl while clicking on each test. To select a group of consecutive tests, click the first test, hold down Shift, and click on the last test.
The Run button also has a drop-down to select Debug Selection. Running your tests in debug mode can be helpful for debugging possible errors in your test logic. You can set breakpoints, add variables to your watch window, and perform all of the same debugging operations that you would against your actual application.
You can also filter the Test View by clicking the drop-down labeled [All Columns] and selecting the column you wish to filter by. Next, type the keyword that matches the filter you wish to apply. For example, you can select the Test Categories column, type BVT, and press Enter to show just the tests which are in a BVT category.
As the number of tests in your solution grows, test categories can be an effective means of focusing your test runs on the most important set of tests to run as you make routine code changes. Be sure to run all of your tests occasionally, but running all of your tests with every change can be time-consuming, and can interrupt your flow while programming. Later in this chapter, you will also learn how to discover which tests to run based on the most recent changes you made to your project (see the section, "Test Impact View").
Note
You can also use the Test List Editor window to view, sort, filter, and manage your tests using test categories or test lists. But since test lists are deprecated in this release of Visual Studio, the recommended approach is to stick with the Test View window.
This section shows how the Test Results window displays the progress and final outcome of test runs. You'll also learn about the secondary uses of the Test Results windows, including exporting and publishing test results.
When a test run is started, the Test Results window is shown, displaying the current status of the run. Each test will update automatically, and you can use the control buttons to affect the run, even before it is complete. Click the Pause button to temporarily suspend test execution, or click Stop to abort the test run. Whether you pause or stop a run, you will be able to view the results of any completed tests.
As an example, Figure 12-6 shows the Test Results window for a sample test run of four unit tests.
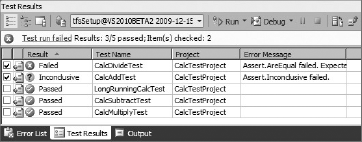
In Figure 12-6, the summary text says, "Results: 3/5 passed. Item(s) checked: 2." You can access additional details about the test run by clicking on the Run Details button on the Test Results toolbar (the fourth icon from the left). The Run Details will show details about the run start and stop time, the test settings used, and the user who submitted the run.
Simply double-click any test to see the detailed results for that test run. For tests that did not pass, you may see additional details such as the error message and a stack trace for the test failure. You can also right-click and choose Open Test to edit each test.
As you have seen with the Test View window, the Run button has a drop-down to select other options, including Debug.
You may notice that the Failed and Inconclusive test results automatically have their checkboxes checked, while the two tests that passed do not. This is to enable the quick rerunning of tests that did not pass. Simply click the Run button and the checked tests will be executed.
The Test Results window supports exactly the same functionality for sorting, grouping, and filtering results that the Test View window does.
Click on any column header to sort by ascending value, and again for descending. You can also right-click and choose Add/Remove Columns to modify which columns are displayed.
You can use the Group By, Filter Column, and Filter Text fields on the right-hand side of the Test Results window's toolbar. For example, you might choose to filter your test results based on a particular test category.
By default, whenever a test is run, statistics on that run are automatically stored in a file on disk. These files are XML files with an extension of .trx. These files are used to store information about which tests were run, when they ran, statistics on that run, and details about the results.
You can use the Test Results window to manually export test run results. To export all results from the current run, click the Export Results button. (By hovering your mouse cursor over the icons on the toolbar, you can see the tooltips indicating the names of each button.) You can choose to export a subset of test results, perhaps only for tests that failed, by pressing the arrow on the Export Results button and choosing Export Selected Test Results.
Note, however, that these files can contain a lot of data, especially if you have many tests or have any long-running load tests.
Test Results XML (or TRX) files contain all of the details for selected test runs. Visual Studio establishes a Windows file association for the .trx extension, so double-clicking on such a file will automatically load those results into Visual Studio, where the details can be viewed.
In this way, you can easily copy TRX files between systems to view results with full details on a machine other than the one that originally executed the tests. For example, you may find this useful for transferring details from your testers to your developers.
You can also use the Test Results window to manually import a TRX file to view its contents. Click the Import Test Results button on the Test Results toolbar and then select the correct TRX file. If the contained run is already loaded in the IDE, then you will see an error message. Otherwise, you will be able to view the results and details from that exported test run.
The following section describes a more powerful option available to you: publishing.
Exporting test results will store the data in a local TRX file. However, if you have a Team Foundation Server instance configured, you can send those test results to it through a process called publishing.
Publishing your run data is vital to your project's success, because it enables your team to view and track testing metrics over time. Published data can be queried through various reports, such as Quality Indicators, Code Coverage Details, and Test Run Details. Publishing test results also allows you to create bugs that reference the results of your tests, including any diagnostic data collected during your test run.
Before you can publish results, you must be connected to a Team Foundation Server instance. In addition, that instance must have at least one Team Build definition configured because published results are associated with a specific build. Because run data is associated with a specific build, you can determine the quality of each build by reviewing the test run data for each to identify trends. Team Build is described in detail in Chapter 21.
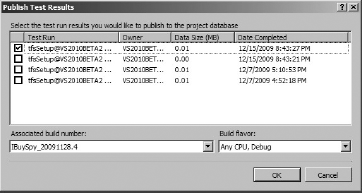
To publish a test run, click the Publish button located near the center of the toolbar in the Test Results window. When you click this button, you will see the Publish Test Results dialog shown in Figure 12-7.
Note
If the Publish button is disabled, ensure that you are connected to a Team Foundation instance, and that your team project has at least one build definition.
Choose one or more test runs to publish. You can then select the build with which to associate the run data. Finally, you can choose to include any code coverage data. Click OK and your results will be published. You will see the Publish View mode of the Test Results window, with details about each publication, including the status and any error message.
When your publication shows a status of Completed, your data has been saved to the operational store for your team project.
Note
Published data is not immediately available for reporting. The data can be queried once it has been pulled into the data warehouse. This is done automatically at a frequency you can set in your Team Foundation Server instance.
You can also publish test run data from the command line using the MSTest console application. See Chapter 13 for more details on command-line testing.
You've already seen how test categories can be used to easily organize your tests. However, sometimes you need more control over the members of a test group. Another type of test that Visual Studio supports is the ordered test. An ordered test is simply composed of other logically related tests. You can add one or more tests as members of an ordered test. You can also arrange those tests to execute in a specific sequence. In addition, the same test can be added to an ordered test multiple times.
Note
Don't feel constrained by the term "test" when creating your test suites. There may be perfectly valid cases when a "test" doesn't actually test anything. Perhaps you've created a utility method that erases your customer table. Create a unit test to call this method and add it to your ordered test wherever you need that table reset.
Being able to specify the order of test execution (as well as including a test more than once) has a wide variety of applications. For example, you may have a Create User test that, after execution, adds a new user to your database. Your next test, Log User In, may rely on the existence of that new user. By ordering your tests, you ensure that the first test successfully creates the user before the second test attempts to log in that user.
An ordered test is simply another type of test, so you create ordered tests much the same way as other tests. Right-click on your test project and select Add
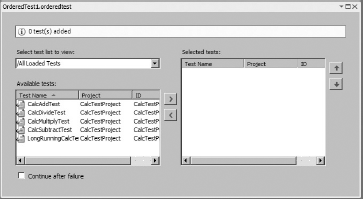
Using the right and left arrow buttons, add one or more of the tests to the ordered test. The list of tests includes the tests from all projects in the current solution. Multiple tests can be added at the same time by holding the Ctrl key while clicking on each test. As mentioned before, the same test can be added more than once.
You may order the execution of the contained tests by adjusting their position with the up and down arrow buttons. The test at the top of the list will be executed first, proceeding sequentially down the list.
One of the key features of an ordered test is that tests run one at a time in a specified sequence. Using the "Continue after failure" checkbox, you can indicate whether the ordered test continues to process remaining tests if a test should fail. By default, this is unchecked, indicating that the ordered test will abort when any test fails. Check the box to cause the ordered test to always execute all contained tests, regardless of success.
Find your ordered test in Test View. Right-click and select Properties. You will see the Properties window containing the values for your ordered test, similar to what is shown in Figure 12-9.
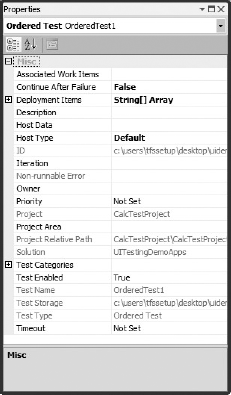
You can set the test's Description and temporarily disable the test via the Test Enabled property. Other properties include Timeout (which indicates how long the test should run before failing) and the Continue After Failure property, described in the previous section.
An ordered test is executed just like other tests. You can use the Test View window. You can also use the command-line tool, MSTest.exe, as described in Chapter 14.
When executed from Visual Studio, the Test Results window will activate, displaying progress as the test is executing, and results when it is complete. The following example has an ordered test with four contained tests. As shown in Figure 12-10, the test has been run, but failed.

Notice that the Test Results window indicates "2/5 passed." The ordered test contained four inner tests, but the ordered test itself counts as a test with regard to success or failure. Right-click on the ordered test in the Test Results window and select View Test Results Details. The main window will display Common Results and Contained Tests.
The Common Results show the overall status of the ordered test, including the start and end time and the ultimate result.
However, in this case, you might be interested in finding out what happened with the individual tests contained in the ordered test. The Contained Tests section displays each of the contained tests, along with their type, name, result, and how long the test ran.
You can see that the first two tests have passed. However, the third test, CalcDivideTest, did not pass. Because the test's Continue After Failure property was set to False, the remaining fourth test was not executed. Double-click on any inner test to see details for that test. In this example, it probably would have been better to enable "Continue after failure," since these tests aren't strictly dependent on one another. However, if you are using ordered tests to represent (for example) a Web site workflow of account creation, account login, account activity, and account logout, then the rest of the tests in the sequence probably don't need to be run if the initial account creation fails.
When you are ready to run the test again, you can repeat the selection process via Test View, or use the Test Results' Run button.
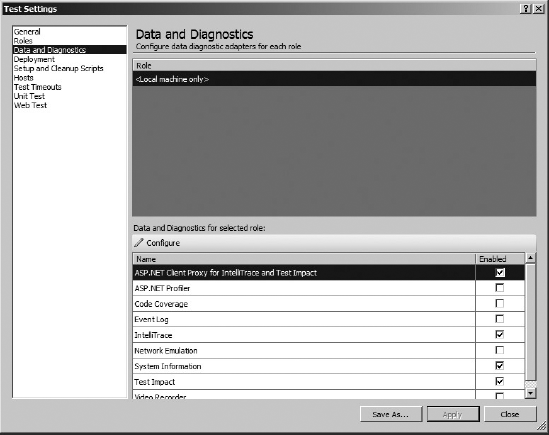
Test settings provide a way of defining how tests are executed within Visual Studio. Such settings include timeout values, remote execution settings, and the diagnostic data adapters you wish to enable (see the section "Diagnostic Data Adapters," earlier in this chapter).
You can maintain multiple test settings files and switch among them based on the type of testing you wish to conduct. When you created your test project, Visual Studio created two default test settings files. Click Test
The Local test setting is designed to run with minimal overhead and produces smaller TRX files, but does not collect any diagnostic data. The Trace and Test Impact test setting enables the System information, Trace impact, and IntelliTrace data adapters. Consider using the Local test setting for everyday testing, and switch to the Trace and Test Impact test setting if you need to file a bug from test results. This way, additional diagnostic data will be available, along with the bug you are filing.
You can create your own test settings file by right-clicking on Solution Items within Solution Explorer and selecting Add
You can edit test settings files by clicking Test
You can also configure test settings to collect data from remote machines that are part of your test environment. For example, you might be running a test locally that makes a call to an application running on a remote Web server. You can configure Visual Studio to collect data from both the local and remote machines. To do this, you would install a Test Agent on the remote machine(s) and connect these to a Test Controller. Then, use the Roles tab within the test settings editor. You will learn more about configure Test Controllers and Test Agents in Chapter 13.
As the number of tests in your project grows, so will the amount of time it takes to run those tests. Running all of your tests every time you make changes to your code can hinder productivity. But choosing to not run tests frequently enough can cause code defects to go unnoticed.
One solution to this tradeoff lies in a new feature available in Visual Studio 2010 called test impact analysis. Test impact analysis can analyze managed code execution (such as C#, Visual Basic, managed C++) and keep track of which methods are executed when each test is run. By keeping track of which methods get called for each test, test impact analysis can then present a list of tests that you should consider running again when a given method or methods have changed.
To utilize test impact analysis you must first run your tests with the Test Impact diagnostic data adapter enabled in your test settings. See the previous section, "Test Settings," for more details on working with test settings and diagnostic data adapters. You should next run all of your tests with test impact analysis enabled in order to establish a baseline of test impact data.
Now, open the Test Impact View within Visual Studio by clicking Test

In this example, the CalcAdd() method has changed, and test impact analysis has detected that there are three tests within your solution that you should consider running again. You can choose to run only the impacted tests by clicking on the down arrow next to the Run Tests icon (the fourth icon from the left), and selecting Run All Impacted Tests. This will reset the baseline of test impact analysis data to indicate that all impacted tests have been run since the last time you made changes.
Note
Test impact analysis is a powerful feature that can help improve code quality and developer productivity. But it shouldn't be used as a substitute for occasionally running all of the tests within your solution. Test impact analysis can't always catch all of the changes that may lead to entropy within your software project. For example, you may have tests that are driven by external data sources, or that interact with other systems outside of your solution. Since test impact analysis only aware of the changes within the managed code in your solution, it is a good idea to routinely run the rest of your tests even if they don't appear in the Test Impact View.
In Chapter 14 you will learn how to utilize test impact analysis when deciding which manual tests to run.
This chapter covered details about testing in Visual Studio 2010. You learned about the various types of tests, diagnostic data adapters, and tools for working with tests. You learned about test projects and how to configure the defaults for test projects you create.
You then learned about the Test View window and how to use test categories to group your tests.
You also learned how to work with the Test Results window, how to export and import test run results to TRX files, as well as how to publish those results to your Team Foundation Server instance for reporting and bug-filing purposes.
You learned about how to use ordered tests to group other tests together to be run as a unit. Contained tests are executed in a specified order, and you can optionally indicate that you want the test to abort when any test fails.
You learned about the important role that test settings play in determining how tests are run, and which data gets collected during test runs.
Finally, you learned how test impact analysis can help you focus on running the tests that are most likely to have been impacted based on recent changes to your source code.
The details covered in this chapter should prepare you to effectively manage and orchestrate the testing of your Visual Studio projects. Whether your project has just a few or many hundreds of tests, using the tools and techniques described in this chapter will help you to achieve success.
In Chapter 13, you will learn about how Web performance tests can be used to help speed up your Web applications. You will also learn how to simulate the results of hundreds (or even thousands) of users interacting with your Web application by using Visual Studio's load-testing capabilities.