
Exploring the new IntelliTrace feature
Understanding the events view and the call tree view
Working with breakpoints
Using the pinnable data tips
Many developers resent the fact that debugging has become one of the key traits in software development. Many developers have been known to spend a considerable amount of time simply on debugging. Adding salt to the wound are programming bugs where the behavior is not reproducible. In many instances, developers may wish there was a way to travel back in time to capture what happened, and then be able to wave a magic wand to debug the issue. That wish has now come true in Visual Studio 2010 Ultimate. (Not the magic wand part — that feature did not make the cut.)
Visual Studio 2010 introduces several new capabilities to help with the debugging experience, and to prevent bugs from getting into the system in the first place.
This chapter examines the feature called "IntelliTrace," which has debuted in Visual Studio 2010 Ultimate. In this chapter, you will learn how to use this feature to aid in your debugging effort, and to get to a faster resolution. This chapter also discusses the new capabilities for breakpoints and a cool sticky data tip feature.
In many cases, as a developer, you have discovered that debugging is a regular activity. It is also a task that could become monotonous. For example, you may have encountered a bug that the tester passed on to you, but one that you cannot reproduce. You may also have experienced the agony of stepping through one step past the point where the issue occurs, only to discover that it is time to start all over again. These are just a couple of common occurrences, and there are no doubt plenty more.
Visual Studio 2010 Ultimate includes new capabilities to address issues such as the famous "no repro" bug status. A key feature in this capability is the IntelliTrace feature. The key tactics used to address the non-reproducible bug are to capture as much information as possible while the bug is encountered, and to use the capability to leverage this information while debugging. The one feature that could top this would be for the bug to automatically resolve itself.
Let's take a deeper look at this new debugging feature.
In this chapter, examples will use "The Beer House" sample application to demonstrate the debugging features. You can download this sample application from the http://thebeerhouse.codeplex.com Web site. The sample application is used as an example in this chapter. You can use your own application to follow along and learn about the new debugging features.
In Visual Studio 2010 Ultimate, the Debug menu has a new member called IntelliTrace, as shown in Figure 11-1. You use this new menu option to enable the intelligent tracing.

Let's start by looking at the Options and Settings dialog for configuring the IntelliTrace feature. Open the Debug Options window by clicking Debug

You should notice the following four configuration sections within the IntelliTrace option node:
General
Advanced
IntelliTrace Events
Modules
Let's look at the configurations available in each of these sections.
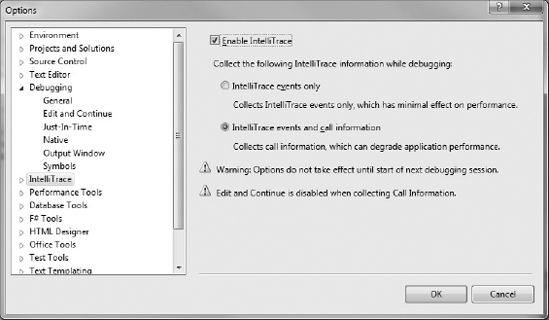
In the General section, you can enable IntelliTrace by clicking the checkbox labeled "Enable IntelliTrace." This checkbox allows you to enable (check) or disable (uncheck) IntelliTrace. In this window, you can also choose between the options to record events only or collect additional information that includes events, diagnostics, calls, and method level tracing. Of course, collecting more information means that a larger log file will be generated. As you can see in the Options window shown in Figure 11-2, collecting more information would have an impact on performance more so than merely collecting events.
Also, note that the "Edit and continue" option is disabled with the latter option. The option dialog will prompt you with this warning when you change the setting.
The Advanced option provides two settings. As shown in Figure 11-3, you can set the location to store the generated log file, and specify the maximum size that the log file should be.

In addition, a checkbox at the bottom of the screen allows you to turn on or off the navigation gutter in Visual Studio. You'll learn more about the navigation gutter later in this chapter.
As shown in Figure 11-4, the IntelliTrace Events section lists all the diagnostic events that are collected while debugging an application. The list of events is broken down by framework categories. Here you can select (that is, choose to collect) or deselect (choose not to collect) the diagnostic events shown on this list.

As shown in Figure 11-5, this section enables you to manage the list of modules for which data is collected during debugging.

Here you can add new assemblies to collect debugging information, as well as exclude and remove assemblies for which you don't want to collect debugging information.
As you have learned, by enabling IntelliTrace and choosing the "events only" option, you have the option of recording several of the events occurring in your application, including user gestures, system calls, and exceptions. These events that are captured as they happen are presented in a history window.
To load the IntelliTrace window shown in Figure 11-6 with a list of events recorded, select Debug

As you can see, the history shows events associated with several different modules, including application code. The highlighted event in Figure 11-6 shows a gesture, which, in this case, is a user action. The user has clicked a button to add an item to the shipping cart. As you would expect, exceptions will also be recorded in a similar fashion.
Note that this list is from a live debugging session. The last event in the list is a "Live Event." The history shows that the execution hit a breakpoint in Line 36 in file ShoppingCart.aspx.cs. At this juncture, you have the option to continue on with the live debugging to capture additional events.
When you click on a particular event recording in this list, the associated source file will be loaded in the source window with the corresponding line highlighted. This becomes very handy when you are debugging an exception.
To locate a particular event or shorten the list of events, you can use the tools available in the IntelliTrace window. At the top of the window, you can find a search box. You can use this search box to short-list the events displayed in the window.
Additionally, you can incorporate a filter by using the All Categories and All Threads drop-down lists. The All Categories list shows the framework categories you saw in the Option window under the Diagnostic Events category discussed earlier in this chapter. If you select a framework category, you will see that the list of diagnostic events only displays the events associated with that framework category. Similarly, you can use the All Threads drop-down list to filter the diagnostic events.
Because of its low overhead (compared to recording the call information), the "events only" option is the default choice in Visual Studio 2010.
Now that you understand what goes on when you choose to record events only, let's explore what goes on when you select the option to collect information about diagnostic events and call information (the second option presented to you on the Options screen shown in Figure 11-2).
If you are a sports fan, you may keep your DVR full of all sorts of recorded sports events. By recording the events on the DVR, you are able to pause, step back, and forward during the program to answer a phone, to take care of any distractions, or even to go back and watch a fantastic play that just took place.
A similar situation occurs in a live debugging session when you utilize IntelliTrace. You can now pause a live debugging session and review the events or calls. This new feature also allows you to play back the execution of an application from a past debugging session, which is certain to change the debugging experience once and for all. For example, a bug filed based on a test run of your application can now be attached with debugging information recorded during that test run. When you receive the attached debug file, you can run through the debugging file to review the events and calls, which could provide the missing information to identify and resolve a bug.
This section examines two new capabilities:
Breaking, stepping back, or stepping forward a live debugging session
Playing back a recorded debugging session
As shown in Figure 11-7, when you check the Enable IntelliTrace radio button in the Options window and select the second option to collect "IntelliTrace events and call information," you will get two warning messages. The first warning informs you that the changes won't take effect until you start a new debugging session. The second warning alerts you that the capability to "Edit and Continue" is disabled while capturing call information.
Note
Selecting to collect diagnostic events and call information has an impact on the performance. So, use the "Events only" option if you don't need the playback capability.
Once you select "Events and Call Information," you are then ready to take advantage of the playback capability.
In Visual Studio, open "The Beer House" solution (or, alternatively, your own application). Set up the debugging option as described earlier to capture both events and call information.
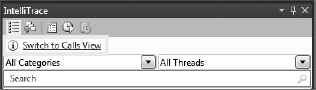
Start a new debugging session in Visual Studio. You will see the IntelliTrace window, as shown in Figure 11-8. While the debugging is in progress, IntelliTrace is capturing the data. To view the data, you must pause the debugger. Click the "Break All" link to pause the debugger.

You should now see a new navigation bar in Visual Studio, as shown in Figure 11-9. The navigation bar contains icons that have the following five associated actions. (This list is ordered to match the order of the icons in the navigation bar.)

When pausing the debugging session, the IntelliTrace window shows a list of diagnostic events by default. This window should be familiar to you (see Figure 11-6 earlier in this chapter). But there is one important addition to this window. When you are capturing both events and calls information (that is, in the playback mode), there is an option at the top of the window, "Switch to Calls View," as shown in Figure 11-10.
With this option, you now get an additional view that shows the call tree, as shown in Figure 11-11.
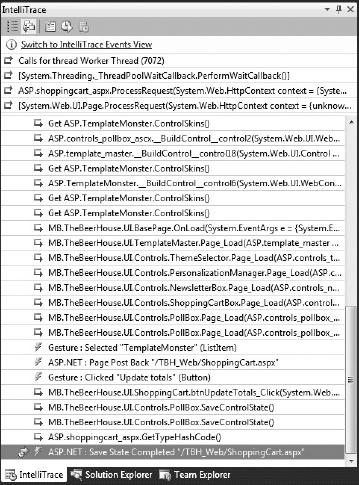
The call tree view shows the sequence of execution steps in a tree view that you can now navigate through to get an understanding of what methods were called. This view also shows the entry and exit of functions, from the start of the application to the last step of the debugging session.
The IntelliTrace Event view (Figure 11-6), and the calls history view (Figure 11-11) provide you with the capability to step back and analyze the execution history. The information presented by IntelliTrace in these two views is stored in a trace log file. As you learned earlier in this chapter, you specify the path to store this trace log file when you configure the Advanced area of the Options window (Figure 11-3).
As you can imagine, there are plenty of opportunities to make the debugging activity more productive. Some of the common scenarios include attaching the trace log file to a bug work item, to the build report on a failed build, and on a functional test run. When a trace log file is opened in Visual Studio, it shows a summary view, contains the threads list, and contains the exceptions list. For debugging a particular exception, you can double-click on the exception from the list to start debugging from the point this exception was thrown.
Breakpoints are a developer's friend when it comes to debugging. A breakpoint tells the debugger to stop executing at a certain point in the code. This enables the developer, for example, to get a handle on the various parameters, or to watch the execution carefully by going through the program one step at a time. Of course, most developers have gone "one step too many" while stepping through the code on several occasions. The "Debugging and Playback" section earlier in this chapter provided a glimpse of the new "time travel" capability that allows you to step back when this happens.
With breakpoints, you are stepping through the code and are able to debug the issues that you are trying to resolve. But there are invariably instances when you are at a loss in finding the cause of an issue that you are debugging.
When occasions like this crop up, you call for help. When you do that, you want to provide as much information as you can about the issue you are debugging and, if possible, hand off the breakpoints you have set as well. In Visual Studio 2010, you can now do just that.
The Breakpoints window has now been enhanced to enable you to export and import breakpoints. Exporting breakpoints generates an XML file that can be shared with the rest of the team members.
To export or import breakpoints, you must first call up the Breakpoints window shown in Figure 11-12. You can do that by clicking Debug
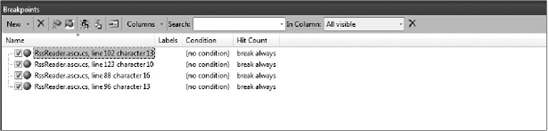
Click the "Export all breakpoints" menu item (the fifth icon from the left) from the Breakpoint window to open a Windows dialog to save all the breakpoints within the solution in a file with .xml extension.
You can share this file via email, on a shared drive, and so on, with the rest of your team, or you can attach it to the bug work item that you are investigating in the first place. If you attach it to the bug work item, whoever picks up this bug to work on will have the associated breakpoints file that you have just attached.
Note
It would be convenient and useful to be able to export breakpoints and attach the file to the work item directly without having to do it in multiple steps. This is not possible to do in the 2010 version, but it may be a feature request for the next version of Visual Studio.
To get the breakpoints added to the project, select the "Import breakpoints from a file" (the sixth icon from the left) menu item in the Breakpoints window and choose the file. This will add the breakpoints to the corresponding files within the solution.
This is indeed a nice little feature to help you share the breakpoints and possibly save some time for the developer who will be debugging an issue.
Labeling breakpoints is similar to tagging. This will come handy if you have many breakpoints in your file and want to look at only a select few of the breakpoints.
You can label breakpoints from within the Breakpoints window shown in Figure 11-12. This window shows a list of breakpoints you set in the project. Right-click on a breakpoint to which you want add a label and select "Edit labels." This launches the "Edit breakpoint labels" window shown in Figure 11-13.
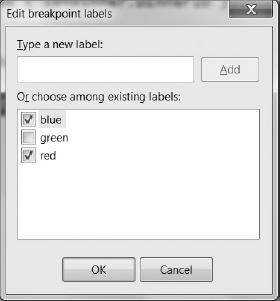
In the "Edit breakpoint labels" window, start by providing text for a new label and click the Add button to attach this label to the breakpoint. Note that you can add as many labels as you want to a breakpoint. You can also choose a label from the existing labels. Figure 11-13 shows three existing labels, with two of them associated with the selected breakpoint (as indicated by the checkmarks).
Now that you have set the labels, you can use them with the new search capabilities. In the Breakpoints window, type a label (for example, "red") in the Search box and press Enter. This will bring up only the breakpoints that have the labels "red."
You may want to label certain breakpoints that you are using to debug a particular bug with that bug work item ID or a description. Note that you can also export only breakpoints that were results of a label search. This will come in handy when you have numerous breakpoints and only want to export a subset of those breakpoints.
Breakpoints are definitely a key tool for debugging. Another often-used technique is physically watching variables, expressions, and more, during the debugging. Developers do this by using a watch list, a quick list, and a locals window. During the observation, the developer may track some of these by writing them down on a piece of paper and looking for values as they progress through the execution of code.
Instead of having to physically write down this tracking history, with Visual Studio 2010, developers may take advantage of the IDE automatically recording this information in the form of pinnable data tips.
In Visual Studio, if you hover over a variable or an expression, you will see a tool tip, as shown in Figure 11-14. This is called a data tip.
Note the pin icon to the right end of the tool tip in the Figure 11-14. This is new in Visual Studio 2010 and provides the capability to either stick the data tip on the screen, or let it float with the line of code with which it is associated.
To get a data tip pinned to the source, click the pin icon on the data tip. This results in the data tip being pinned to the right of the line of code, and a pin icon added to the gutter in the Visual Studio 2010 IDE.
Another way to get a data tip pinned to the source is by right-clicking on the expression you want to track, and selecting Expression '<<Name>>'

If you pin the data tip like this, the data tip will stay visible all the time (not simply when you hover over the variable or expression), and will stay in line with the line to which it is pinned. When you scroll up or down on the source file, or when you switch to another file in the IDE, the data tip will disappear from the view.
In cases where you need to see the data tips at all time, instead of pinning the data tip, you want to unpin it. You do that by selecting the "Unpin from source" button from the data tip management menu bar, as shown in Figure 11-16. Hovering over a pinned data tip will bring the data tip management menu bar.

That will result in the data tip turning yellow (similar to a conventional sticky note). Now, even if you move around the source page, or move to another file, the data tip will be in sight for you.
You can also move this data tip outside the code window or to a second monitor. With this capability, you can have a collection of data tips (or watch lists) on a second monitor while you are working in a debugging session, essentially getting rid of the manual paper notes to keep track of variables.
Note that you can add expressions to a data tip by right-clicking on the data tip and choosing Add Expression. This will be useful if you want to track multiple dependent variables.
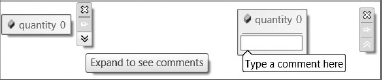
You can add a comment to the data tip by using the comment feature in the management menu bar, as shown in Figure 11-17. Adding a comment to the expressions you are tracking may prove to be helpful, especially when you share the data tips with your team members.
You can clear data tips (either all of them in the project or in the current file) by using the Clear All DataTips menu command in the Debug drop-down menu, as shown in Figure 11-18.

Similar to breakpoints, in Visual Studio 2010, you can export and import data tips. You do so by using Export DataTips and Import DataTips menu commands in the Debug drop-down menu shown in Figure 11-18. Like breakpoints, exported data tips are stored in an XML file format.
This chapter took you on a quick tour of some of the new debugging capabilities in Visual Studio 2010. You learned how to configure the IntelliTrace feature, which lets developers travel back in time to analyze the execution history from a debugging session. This new capability is available in the Visual Studio 2010 Ultimate. You learned about the capability to record diagnostic events, and the capability to play back events from a live or previously executed debugging session.
This chapter also previewed the new features added to the Breakpoints window, such as labeling and the capability to export and import breakpoints. This neat little utility helps developers share breakpoints with fellow team members.
Finally, you learned about the enhancement of the data tip feature in the form of pinned data tips and sticky data tips. Coupled with the capabilities to add comments to data tips and to add expressions to data tips, this feature is going to save many sticky notes.
In Chapter 12, you will be introduced to the testing capabilities in Visual Studio 2010. You will learn about the various test types, diagnostic test adapters, and tools for working with tests. You will also learn about working with test results, ordered tests, and the test settings. Finally, you will learn about a cool new feature called "test impact analysis."