
So, you've got your website all set up and running, you've written your CSS, and everything worked exactly right the first time, right? Unlikely. With any type of scripting or programming there is a degree of trial and error involved in reaching your goals. This equally applies to CSS. When writing CSS, developers typically flick back and forth between the code and the browser (or browsers), writing or amending code, and refreshing to check the results. If there are any more complicated steps in between—building, uploading, compiling, and so on—the productivity of the developer is impacted with every edit.
Once the code is complete, it is necessary to ensure that it works as expected in all the browsers to be supported by the website. Testing like this takes time and effort—CSS often impacts large portions of a website—and everything that could be affected must be tested.
Whenever issues or bugs are found, they need to be fixed quickly, and with minimum impact and maximum confidence that they have not caused new issues (or re-created old issues) throughout the rest of the website.
This chapter will be concerned with tools and methods to help you achieve all this in the most productive manner and more. Many of the tools we will discuss have functionality we will not mention, since it is more of use to JavaScript or server-side developers; we will focus on the parts of interest to the CSS developer. You will learn about the following:
When you start out with web development, you tend to work on small static projects. These kinds of sites run equally well from a folder on your computer as from a server on the Internet. Development is simple and quick as you flick back and forth between your editor and your browser, with no worries of external dependencies, third-party code, or other developers and CMSs screwing with your CSS. However, in the world of high-traffic websites, it is safe to assume that your development practices are considerably more affected by your environment. There are likely to be several environments your code can exist on and extra steps necessary to deploy your code and test it. This goes against the grain for many CSS developers who are used to making small, iterative changes and testing these changes frequently. So, how can you get back the rapid development cycle and instant gratification you love so much?
The first step is to isolate the things that are impacting your productivity.
If you are using a build script that concatenates multiple CSS files together—and we certainly recommend that you do—this process can take a while and get in the way. Of course, for production code this is the correct thing to do, but for development environments the speed and performance gains of doing this are negligible, since the servers you are running from are likely to be on the same network that your development machine is on.
A good solution is to use a debug style sheet. Let's assume the build script runs as some kind of shell script that includes all the files we want to concatenate. There would probably be a configuration file that tells the shell script which files we want it to load and in which order. Our resulting file might be called "main.css". Instead of using that configuration file, you could consider using a CSS file, since you have the @import directive, which allows you to achieve the same thing but using multiple files. If you have a file called "main-debug.css", this could contain something like the following.
@import url(reset.css);
@import url(global.css);
@import url(login.css);
@import url(feature.css);
Using a few clever regular expressions, it's not hard to make our shell script read this file and use the @import directives to build "main.css". This gives us two significant benefits:
The list of files is maintained in just one place.
You can use "main-debug.css" to emulate the behavior of "main.css", but without needing to run the build script.
If you then modify your pages to accept a querystring of (for example) ?debugCSS=true and use this parameter to insert "-debug" in the file name for the included CSS, turning on and off this behavior becomes something simple. Now it is easy to modify the file and see the results immediately.
If you've followed our recommendations, you are also compressing your CSS. If the build script is compressing your CSS into a resulting file called, for example, "main.css", the same issues will present themselves as with concatenation. If you name the original files with "-debug" within the file name, you can use the aforementioned querystring trick to access the uncompressed file. Of course, if you are concatenating as well as compressing, the method of dealing with concatenated CSS that we mentioned in the previous section works equally well in this instance.
If you are working on sections of a website that require information to be posted to them or that have secure connections, it is possible that refreshing these pages will show you different content or redirect you to a different page. This means that every time you change the CSS used by these pages, you need to browse back to the page, possibly logging in again or going through some other time-consuming process.
However, there are methods to reload the CSS for that page, without reloading the rest of the page, assuming that the CSS hasn't been modified by JavaScript or is contained within the page itself. If you are using a browser with the ability to directly modify the HTML or an add-on with the same ability such as Firebug,[100] you can locate the link to the external file and modify the URL to include a querystring with a unique value. For example, if your code contains something like this:
<link rel="stylesheet" href="/css/main.css" />
You could modify it to be as follows:
<link rel="stylesheet" href="/css/main.css?12345" />
This should then make a new request for the file. Your URL might already include a querystring for some reason, such as the following:
<link rel="stylesheet" href="/css/main.css?hello=goodbye" />
Then you just need to append a new parameter on the end of it to force the refresh and leave the request unbroken:
<link rel="stylesheet" href="/css/main.css?hello=goodbye&12345" />
However, if you keep using this method, your appended strings will not be as unique as you might like! No matter how random your strikes on the keyboard, you will repeat yourself pretty quickly and begin returning files from the cache instead of new requests. To solve this, it is better to append the time and date, since those will always be unique. Entering these ourselves, though, is no fun, so you can use the console within Firebug, Web Inspector, IE Developer Tools, or Opera Dragonfly to run a little bit of JavaScript that does it for us, like this:
var date = new Date().getTime();
var links = document.getElementsByTagName('link'),
for (var i=0,j=links.length; i<j; i++){
   var link = links[i];
   link.href += (link.href.indexOf('?') == −1 ? '?' : '&')+date;
};
This script will make these changes for every link tag it finds on the page. It is also possible to make this into a bookmarklet, which is a small snippet of code that can be run from the favorites menu of your browser (including IE) to achieve the same thing in a friendlier and quicker fashion.
Tip
This block of code does have some limitations, but Antony has written a fuller-featured version at http://zeroedandnoughted.com/bookmarklet-to-de-cache-css-and-images-version-2/. His version will also refresh images and background images, and works within the current document and frames or iframes within it, but does not currently support files using the @import directive.
Since caching files is not usually helpful during development, we would recommend disabling the caching mechanism in your browser while developing, but don't forget to re-enable it when checking performance.
Although not strictly impacting upon your productivity, developing within Internet Explorer is enough to make most developers want to give in and take up a career in plumbing instead. We recommend working in a standards-compliant browser first and then fixing everything in older versions of IE and other browsers second. This ensures you reach a good working point quickly and will help maintain your sanity. Of course, it helps to be aware of the limitations of the browsers you intend to support so that you don't build things that you will not be able to make display correctly in them. We talk about this more in Chapter 3.
On occasion, there will be an issue with your code that is hard to pin down. Possibly one rule will be overriding another, or a file that is being included could be affecting something unexpected. If a selector does not seem to be being applied, setting a background color to something strong like red, green or blue with !important is often enough to prove that the selector is working,[101] but if it is a property you are having issues with, it is unlikely to be this simple to resolve. However, there are tools to help us deal with this. The following is a list of some tools either built-in to browsers or available as add-ons. Many others are available.
Firebug was the first really useful front-end web debugger. The first public version (0.2) was released in January 2006, and it has come on in leaps and bounds since then, inspiring and pushing browser vendors to develop and provide their own equivalent tools. Since Firebug is an extension for Firefox, many other extensions exist that plug into it, and further enhance its functionality such as add-ons to monitor cookies, HTTP headers, and more. Although Firebug (and the other developer tools discussed later in this chapter) provides methods to monitor and debug all aspects of front-end web development, we will concentrate on the CSS, HTML, and HTTP portions.
Firebug can be "snapped" to the main window of our browser, but we will look at it in its "popped out" windowed view. First, the HTML view (shown in Figure 10-1).

This view encompasses all kinds of useful information and functionality. In the main window, it shows the HTML document for the current page, and allows you to expand and contract any node with child nodes. Some possible actions in this view are the following:
Hovering the mouse over an element will highlight that element in the page.
Hovering the mouse over an image will show the image in a small window with its dimensions (none of the other browser tools do this).
Clicking an element will select that element.
Next to the Edit button in the toolbar, the ancestry of the selected element is shown as breadcrumbs. Clicking any of these will highlight that parent element instead.
Clicking any element attribute will allow you to rename that attribute; clicking any attribute value will allow you to change the value of the attribute.
Pressing the Tab key while editing attributes allows you to cycle to the next attribute name or value (Shift-Tab will cycle to the previous one), and when you reach the last value for that element, tabbing again will allow you to enter a new attribute and value.
Clicking a text node will allow you to amend the text in that node.
Performing any of these actions results in immediate changes to the Document Object Model (DOM) and the page, and you can see these changes straight away.
Tip
You can also select elements within the webpage by right-clicking them and choosing Inspect Element (which will automatically show Firebug). Alternatively, you can click the icon next to the Firebug logo and then click the element—this is useful since as you hover over elements blue borders are shown around them, which demonstrates the layout and space taken up by elements in a rapid visual fashion.
Clicking the Edit button in the toolbar will allow you to edit the HTML for that element (including the outer HTML) in its entirety, in a built-in, simple text editor (see Figure 10-2). Again, these changes will take effect immediately. Clicking the Edit button again will return you to the previous view.
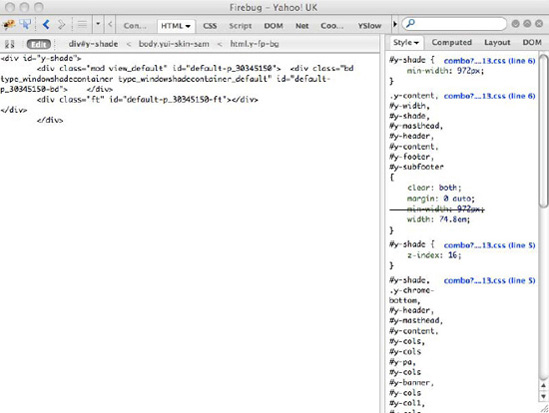
On the right side, all the author CSS selectors that apply to the highlighted element are displayed, in descending specificity from top to bottom. Inherited values are shown below. Next to each rule is a link to the style sheet it is declared in, with the line number shown in brackets. On the line beginning with "Inherited from" is a link—hovering over the link will highlight matched elements in the page, and clicking it will highlight these in Firebug and switch focus to them in the HTML.
For any of these rules, you can click any property or property value to change it and immediately see those changes in the page. When hovering over them, a circle with a line through it is shown on the left of the property; clicking this will disable that property for that rule. Tabbing out of the last property value for a rule will allow you to enter a new one, or you can double-click anywhere on the selector or next to properties to achieve the same thing. When entering new properties, Firebug adds the colon and semicolon for you, so omit those or they will be treated as part of the parameter name or value.
Any property that is overridden in another selector of greater specificity is visually struck through.
By default, this view does not show the user agent CSS (rules that are applied by Firefox itself). By clicking the down arrow next to Style you can choose to show them and therefore where they are applied in the cascade. User agent CSS is shown with "<system>" in red alongside the rules to make the differentiation clear. The Computed tab will show the computed values of any CSS applied to the element (for example, the actual pixel font size) broken into sections for text, background, box model, layout, and other (you can read more about computed values in Chapter 3). If you want to quickly add a property to just one element, you can right-click the selector and choose "Edit Element Style..."—this is the equivalent of adding a style attribute to the element, which we do not recommend, of course, but is useful for rapid testing.
Tip
Other useful options are accessible in Firebug by clicking the down arrows next to the Active tab such as methods for viewing and editing :hover or :active states of links, which would be difficult to access otherwise.
The Layout tab exposes the size, padding, border, and margin for the selected element, as well as the position and z-index (see Figure 10-3). Hovering over any of them will show them visually in the page, and clicking any of the values allows you to edit them and see the changes immediately. These changes will only affect the selected element, as they will manifest themselves as inline styles on the element in the HTML.

Tip
Any time in Firebug you find yourself amending a numerical value, you can use the up and down keys on your keyboard to quickly increment and decrement the values in integers (one whole number at a time) while maintaining the unit value (px or em).
We'll ignore the DOM tab since it concerns itself primarily with JavaScript.
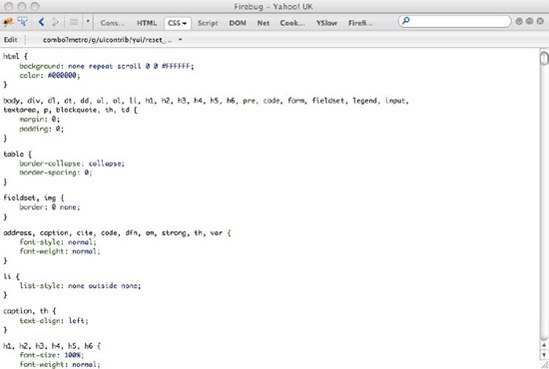
The CSS view shows the entire contents of each CSS file and is editable in the same fashion as the Style sidebar in the HTML view (see Figure 10-4). It also includes an Edit button to use the built-in text editor. In this view, the selectors are also editable, which they are not in the HTML view. This view can be useful as a holistic view of the entire file, but the HTML view is more useful in general.
The Net view shows all of the resources that were loaded when the current page was requested. A wealth of information is available here (see Figure 10-5). On a line level, you can see at a glimpse any resources that took an unusually long time to load and that blocked other resources. You can filter by the type of file with the buttons along the top (obviously, as a CSS developer you would be most interested in All for the complete view, or CSS and Images for drilling down).

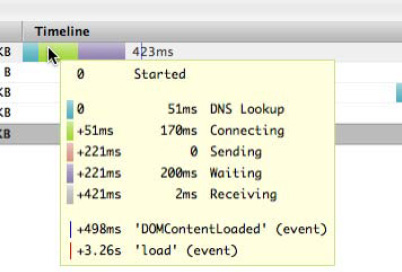
Hovering over any timeline (see Figure 10-6) for a resource will show more details for that particular request (this was covered in great detail in Chapter 8). Sometimes this view will show Blocking (or Queuing in older versions) before Sending, which means the browser has used up all its available simultaneous connections to that domain, and is waiting for other resources to download before downloading this file. These details are invaluable in discovering which factors are responsible for poor performance on your website.
Expanding any resource item shows more details for that particular request (see Figure 10-7). The first tab, Params, shows any information that was posted, or included as a querystring in the request. The second tab shows the HTTP Headers, which are useful for:
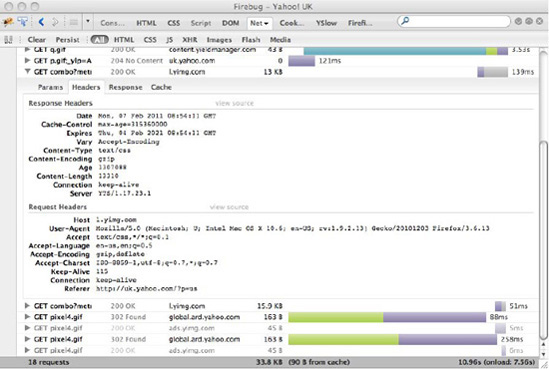
The rest of the tabs show us the actual response in various guises.
You can get Firebug for Firefox from http://getfirebug.com/. Although it is cross-platform and works in Windows, OS X, and Linux, it is currently only available for Firefox on these operating systems. A cross-browser version of Firebug is in development, with a planned release in 2011.
A version of Firebug called Firebug Lite is available at http://getfirebug.com/firebuglite, which can be accessed with a bookmarklet to provide many of the same features of Firebug in other browsers, the most notable omission being the Net tab.
Some of the best available extensions for Firebug (which may make Firefox less stable) are:
Firecookie for managing cookies
Firediff to view changes that have been made to the page within Firebug
Firefinder to see which elements would be selected by an entered CSS selector (or XPath expression)
Codeburner shows reference material for HTML and CSS
Pixel Perfect to overlay images to help line up elements with provided screen images
YSlow to give recommendations on how to improve performance of your pages
Since many of the other tools on this list basically emulate Firebug, we shall only go into greater detail where their functionality differs.
Although not really a competitor to Firebug or a debugging tool per se, Web Developer (http://chrispederick.com/work/web-developer/) gives some additional functionality and deserves a mention on this list (see Figure 10-8).
The ability to rapidly disable/enable caching, JavaScript, cookies, CSS, and images often demonstrates itself to be a valuable timesaver. Conveniently validating CSS and HTML is useful, and switching between predefined window sizes to test multiple resolutions is also an effective way of increasing productivity and saving time.
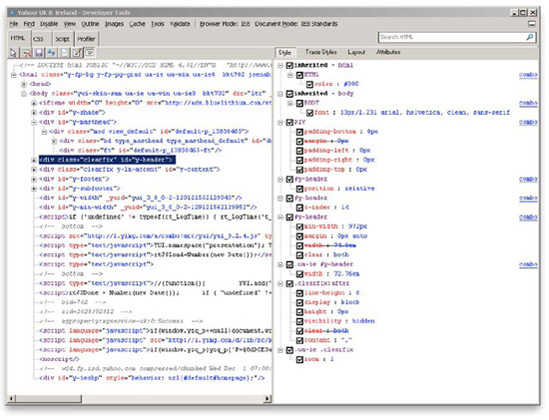
Developer Tools is provided with Internet Explorer 8 in an effort to bring the browser up to par in the debugging stakes. Visually it aims to emulate Firebug, but the features available do differ. It can also be docked to the main window, or have a window of its own.
Developer Tools includes several pieces of functionality that Firebug does not, and in fact goes far toward emulating the capabilities of Firebug and Web Developer in tandem. The disabling/enabling of JS, CSS, and images is two clicks away; the same goes for caching and cookies. It is easy to validate HTML and CSS, and you can generate an "image report"—a list of all images on the current page and their respective file sizes, dimensions, alt attributes and so on—which is very useful for SEO and accessibility concerns.
Figures 10-9 to 10-11 were taken on a Windows XP machine, put in "ugly mode" (with all the shiny plastic turned off) to make it slightly faster. Other than that, they should match what you experience.
The left pane of the HTML tab (see Figure 10-9) is similar to Firebug's, but without the ability to add new attributes. To add new attributes it is necessary to use the Attributes tab in the right pane, with the added benefit of a drop-down menu to auto-complete entries. It is possible to edit the HTML in a built-in text editor, but not that of individual pieces or elements. Also, the edited HTML is only that inside the body tag; it is not possible to edit any HTML outside of that.
The rules in the right pane's Style tab can be expanded and contracted, but the selectors themselves cannot be edited, which mirrors Firebug's behavior. Entire selectors can be enabled/disabled in this view (they cannot in Firebug) as well as individual properties. It is not possible to add new properties/values in this view.
The Trace Styles panel shows the result of all CSS applied to the current element, without the selectors (all nondefault properties).
The Layout panel behaves exactly as Firebug's, but without the useful hover behavior (see Figure 10-10). You can click to edit most of the values. It also shows Offset values (which Firebug does not), which may be useful to you.

The CSS tab almost exactly emulates that of Firebug, with the entire (reformatted) contents of individual style sheets visible and editable (see Figure 10-11). The selectors are editable in this view, and you can enable/disable entire selectors with a check box, which is not currently possible with any of the other tools on this list apart from Opera Dragonfly.

There is no equivalent of the Net tab. Although you can more than make up for this with Fiddler or Charles (mentioned later in this chapter), requiring different tools to achieve this reduces your efficiency and productivity.
All in all, this tool is far more useful than what was provided previously, but is still not visually appealing and feels incomplete. It can be a quantum tool; there are many instances when using the Developer Tools actually slows down IE dramatically, or causes it to crash.
Internet Explorer 9's Developer Tools (although still in beta) are looking like a great improvement, and now include an equivalent of the Net tab, but they are changing so much from version to version that it would be unproductive to cover them in detail here.
If you enable the Develop menu in Safari, you can access Apple's version of these tools: the Web Inspector[102] (see Figure 10-12). Generally, all the same functionality available in Firebug is available here, although it feels less mature. However, in places, the fact that Firebug is open source and the Web Inspector has money behind it becomes very clear. In particular, the Resources tab (the equivalent of Firebug's Net tab) feels a lot more polished, although you need to toggle back and forth between the request and the Resources view to see all the details.

Safari now supports extensions, but none for the Web Inspector exist at the time of writing. WebKit is progressing in leaps and bounds, though, and it seems at some point it will overtake Firebug both in terms of functionality and usability.
Chrome's equivalent can be found by going to View > Developer > Developer Tools. Because WebKit engine is behind both Safari and Chrome's Inspectors, they are almost identical. Chrome's, however, is a newer version since Google releases versions of Chrome more frequently (see Figure 10-13).
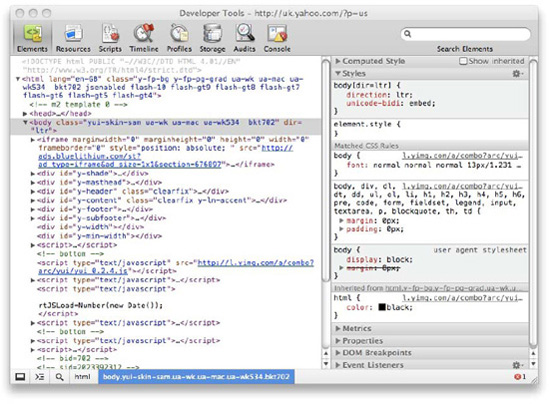
The display of CSS is the most obvious difference. Chrome shows the braces around the properties, so it looks a little friendlier and less cluttered, but this means the rules are not expandable/contractable.
For IE 6 and IE 7, Firebug Lite is often the way to go if you are able to use it with your site. However, the Developer Toolbar, which can be downloaded from http://www.microsoft.com/downloads/en/details.aspx?FamilyID=95e06cbe-4940-4218-b75d-b8856fced535 (it is probably simpler to search for it than type that into a browser!), does offer some useful features.

Some of the functionality offered by the Firefox Developer Toolbar is available; read-only views of applied styles to elements are also available, but in no real way does the toolbar compete with the other items on this list. However, it does offer some useful debugging options if you have no other option.
Opera Dragonfly is the offering from Opera that gives us the debugging features we would otherwise turn to Firebug for (see Figure 10-15). Since it is served directly from Opera as an offline application, the latest version is always downloaded seamlessly. When this book is released, Dragonfly 1.0 will be available, so we used an experimental version to emulate the capabilities of version 1.0 as much as possible[103].

Opera Dragonfly is younger than the other offerings on this list, and it is still in the alpha stages of development at the time of writing. It offers built-in features such as a color picker, screen magnifier, and stored colors manager that the others do not offer without add-ons. Some other touches are nice, too, like the horizontal and vertical rules that extrude from a highlighted element to help with alignment.
The fact that it is in development is apparent in some of the immediate bugs that can be easily found, but it is certainly one to watch and is in fast iterative development.
That all of the major browser vendors now provide these tools is a great thing and demonstrates an understanding of developers' requirements and an intention to provide for them. They are all useful and give us capabilities in each browser that can make dramatic changes to your workflow. However, it is difficult to recommend any over Firebug, which feels the most mature, the most capable, and the most expandable, regardless of the browser you prefer.
Whereas the Firebug Net tab or equivalent offers us the ability to view HTTP requests and their component parts, proxy tools intercept the traffic at a lower level and give us more functionality than their cut-down browser counterparts. Many products exist to achieve this, but few compete with Charles and Fiddler for their debugging abilities.
Fiddler 2 is a free Windows program developed by Eric Lawrence from Microsoft, and initially released in 2003 (see Figure 10-16). Its maturity makes it a very robust and polished product. It uses the .NET Microsoft development framework (version 2.0 or greater; Fiddler 1.3 is available for users of version 1.1), so you will need to install it to be able to use Fiddler. It is available from http://www.fiddler2.com/.

There are far too many components of Fiddler to cover in this book, but we will mention the most common features that are useful to the CSS developer. Essentially, Fiddler sits between your browser and the servers your browser is requesting information from. This allows it to inspect any traffic (including secure traffic) passing between these two points.
The screen is separated into two vertical panes: the first shows the traffic passing through Fiddler, and the second allows you to inspect that traffic further. Under the File menu you can choose to enable or disable the capturing of traffic (whether or not to show requests in the left pane).
Tip
You can also quickly toggle the capturing of traffic by pressing F12.
When Fiddler is capturing traffic, every request will show in the left pane with the order it was requested in, the HTTP status code, the protocol, the host (domain), URL, body (the size of the content), caching details, Content-Type, and the process that requested it (for example, iexplore). Highlighting that request will show further information in the right pane.
Many websites make a lot more HTTP requests than we expect them to, and will very quickly fill up the left pane (and also the memory of your computer). The Filters tab on the right allows you to specify exactly the kinds of requests you want to show and be captured, which will help you to focus on the requests you care about, rather than them getting lost in the noise.
The Statistics tab gives very detailed information about the time the selected request took and goes so far as to give performance estimates for different Internet speeds and geographical locations, which can be very useful for locating performance issues.
The Inspectors tab is one of the most useful and provides all the header information, as well as multiple ways to view the response data. For the request, you can see the headers, textual data, form data, the request in hexadecimal, authentication information, the raw data, and any XML provided with the request. For the response, you can see the headers, textual data, image data, the response in hexadecimal, a basic web preview, authentication information, caching information, privacy data (for example, cookies being created/modified/removed), and the raw response. If the response is compressed, Fiddler will warn you, detect the algorithm for you, and present you with the decoded data.
Primarily these comprehensive views are useful to the CSS developer in checking for unexpectedly large files, that compression is working correctly, that the expected data is being returned, and that the data is being cached correctly.
The AutoResponder tab is possibly the most useful function that Fiddler provides. A common issue when debugging is that a CSS file or HTML response in one environment does not match other environments, or some other factor is interfering with our expected result. To be absolutely certain that a CSS change will fix the problem in our target environment can be very difficult. Ideally, we want to know the exact results if we replace one file on our production environment, for example. The AutoResponder allows you to do exactly this. You can provide a URI to match to (for example, http://www.mycompany.com/css/style.css) and a response. Fiddler provides typical responses for various HTTP status codes, but it also allows you to choose a file on your local machine. Doing this allows you to replace individual files on any server with your own, which is a fantastic way to develop for a client-side developer because they no longer need concern themselves with the server or the underlying infrastructure, but can work on specific files independently with confidence.
The provided URI format is not as simple as it might seem and can be prefixed with "EXACT:", "regex:" and others for different pattern types. It is also not possible to redirect an entire folder (for example, to match http://www.mycompany.com/css/ and redirect to a local folder like c:/projects/mycompany/css) but keep the file name intact, so that http://www.mycompany.com/css/1.css redirects to c:/projects/mycompany/css/1.css, http://www.mycompany.com/css/2.css redirects to c:/projects/mycompany/css/2.css and so on.
To decrypt HTTPS traffic, Fiddler installs a certificate on your computer, which is a potential security risk but a necessary approach. You can enable this in Tools > Fiddler Options. Since Fiddler provides all of the data to your browser, it is also able to "throttle" this traffic, and simulate slower Internet connections.
Although not as mature as Fiddler, Charles is quickly becoming a contender (see Figure 10-17). Available on Windows, OS X, and Linux, Charles exceeds the feature set provided by Fiddler and is often easier to use. It is not free, but neither is it expensive and you can download a free 30-day trial at http://www.charlesproxy.com/.
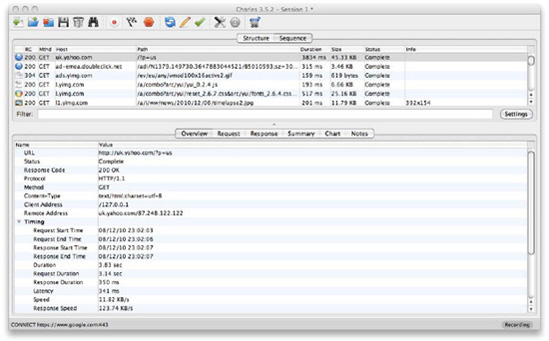
The cross platform nature of Charles is a big advantage; you need only learn its interface once and those lessons will serve on whichever operating system you choose to use. The interface is more attractive and less intimidating than that of Fiddler, and it builds upon some of the functionality available therein.
To enter recording mode (what Fiddler thinks of as capturing mode), a big red circle button at the top of the window can be toggled on and off. When in recording mode, Recording shows in the bottom-right corner of the window, and Charles will intercept all HTTP data requested via web browsers. During the initial installation, Charles will offer to install a plugin for Firefox in order to be able to intercept the data coming from there.
Tip
To inspect HTTPS traffic it is necessary to add the hosts under Proxy > Proxy Settings > SSL and install a certificate. Instructions for this are available at http://www.charlesproxy.com/documentation/using-charles/ssl-certificates/.
There are two main methods of viewing the data. The first is in Structure view, which breaks everything down by host so that it is easy to see which requests came from which. The other view (demonstrated previously) is the Sequence view, which is similar to Fiddler's default view, and shows each individual request in order. In this view, a textbox makes it simple to enter strings to filter by. Any items that do not contain the entered string are hidden from view, which is a fast and intuitive way to interrogate the data. It's also possible to use regular expressions in this text.
In either view, highlighting an individual request shows further information in a tabbed pane—to the right in Structure view, and beneath in Sequence view. The first tab is Overview, which is similar to the Statistics tab in Fiddler.
The next tabs are Request and Response, which represent the request and response data, respectively. Depending on the data, other tabs may show at the bottom for these views, including Headers, Text, Hex, Compressed, HTML, Query String, Cookies, Raw, and JSON. The information is named and presented in a more intuitive format than Fiddler, which is likely more useful to a CSS developer. HTML is color coded in that view, although unfortunately there is no CSS-specific view.
The Summary tab shows basic details for the highlighted request and any requests triggered as a response to that one. For example, highlighting an HTML request will show all the assets specified by that page. This is useful for a high-level view, but the Chart tab is more detailed and similar to the equivalent in WebKit's Web Inspector or Firebug's Net tab. This tab also offers other views to the default Timeline view, such as Sizes for a visual comparison of all the requested files relating to the original request, Duration for the length of those requests, and Types to visually demonstrate the types of files requested and how many of each there are.
Bandwidth throttling can be enabled and disabled by toggling a checkered flag icon at the top of the screen. The settings for this can be set in Proxy > Throttle Settings, and there are several useful presets as well as the ability to enter your own custom values.
Hidden under the Tools menu are the real gems that Charles offers. Map Remote allows you to redirect any remote request to any other remote destination, which is useful for mapping one environment's resources to another—perhaps to use one particular CSS file or folder on one server, or to replace a file or folder on another. Map Local is the equivalent of Fiddler's AutoResponder, but is more capable with friendlier methods of matching and the ability to redirect entire folders as well as files. The Rewrite option allows us to rewrite the contents of the request or the response—for matching locations—in almost every conceivable manner, including replacing strings in the body or adding new headers.
Tip
To inspect traffic from other devices, put them on the same network as a machine running Charles and manually set that machine as the proxy server on the device.
Aside from the extra functionality Charles provides, it also feels more polished. Touches like Charles being intelligent enough to break the URL apart when you paste in a URL and populate all the fields with the respective pieces on your behalf make this feel like a good, solid piece of software. Some of the deeper functionality embedded in Fiddler exceeds the capabilities of those in Charles, but for a CSS developer Charles feels more appropriate.
Testing is an important step in the process of making a robust site that performs well, and looks and works consistently between browsers. Unfortunately, effectively testing CSS—which is the presentational layer of the website—is a very difficult thing to achieve. Whereas testing the other layers of the site can all be done in an automated fashion—JavaScript can have unit tests, server-side code can have unit tests, HTML can be parsed and validated—CSS depends on how the browser renders it, and needs to be checked visually by a human being.
It is theoretically possible to have a screenshot of how the page should be rendered and, as part of an automatable process, to compare this screenshot with actual screenshots in different browsers. An acceptable margin of error could be defined, and depending on the difference between the two screenshots, the test could pass or fail. However, it is a fact that a website cannot and will not look the same on different browsers. Differences in browser handling of various properties, font rendering, and even image rendering ensure that regardless of how small, inconsistencies will always exist. The comparison of two files can never take into account which inconsistencies matter and which are acceptable, so this method of testing would never be completely accurate.
However, automatable techniques to aid in this process do exist. Whereas typically a tester would be required to visit every page that required testing, in every supported browser, you can instead use techniques to generate screenshots on your behalf, which can be looked at by the tester in quick succession and easily compared to a master example by overlaying the two. First though, it is necessary to be aware of what comprises a pass or a fail in this instance.
Since it would not be practical to support every browser perfectly, it is necessary to come up with a matrix showing which browsers are supported and to what degree. The contents of this matrix vary greatly from site to site. Typical sites' traffic is predominantly made up of the latest version of Internet Explorer. More technical sites are likely to have a higher percentage of visitors using browsers that could be considered more advanced—which are essentially all current browsers, and to a lesser extent the current version of Internet Explorer. When dealing with high-traffic websites, it is likely that even older browsers, which make up a small portion of the traffic, still represent a significant number of users. Deciding which browsers you support is dependent on the traffic to your website, which should be tracked and reportable to help you make that decision.
A good example matrix that is kept up-to-date is Yahoo!' Graded Browser Support, which can be viewed at http://developer.yahoo.com/yui/articles/gbs/. The current version at the time of writing is shown in Figure 10-18.

Your decided matrix may vary dramatically from this one. For example, many sites are now seeing reasonable levels of traffic from Opera or Safari on Windows, or Chrome on OS X—some are seeing low levels of traffic from IE 6.
We discuss Graded Browser Support in great detail in Chapter 6. Once you have decided on your accepted browser matrix, it is necessary to ensure that you (and the testers) have the ability to use all the browsers you intend to test upon.
Most browsers (mobile devices excepted) are simple to install side by side, as long as you have access to a Windows install and an OS X install (and possibly Linux, too). This can be achieved through virtual machines (software that allows the user to run other operating systems within their current operating system), although you cannot legally run OS X on non-Apple hardware. Browsers other than IE have a fast update rate, in that the users of these browsers often quickly upgrade to the latest versions. However, to test multiple versions of Internet Explorer, other measures are required.
Although it is possible to have a separate virtual machine for every version of IE (and indeed, this is what the testers should do) it is overkill for the CSS developer. A piece of software called Multiple IEs solved this problem for a long time, allowing the installation of IE versions 3 to 6 concurrently.[104]
There were some caveats with this approach, mainly due to stability, filters, and cookie handling, but it was more than adequate for a quick visual check of a page in older versions of IE.
Development has ceased on Multiple IEs, but Core Services have developed a Windows application called IETester (see Figure 10-19). IETester essentially provides the same functionality as Multiple IEs, but in a single window with tabs, which can represent any version of IE from 5.5 onward. Although it is an alpha release (and has been since 2008), development is still active on the product, and stability is adequate for testing purposes. It can be unstable—there are several known issues—but for the CSS developer it provides a useful and capable replacement for the multiple virtual machines that would otherwise be required to provide the same features.

IETester can also be configured to use IE 9, but this requires Windows Vista Service Pack 2 or 7 (or later). You can download it from http://www.my-debugbar.com/wiki/IETester/HomePage.
It is not always practical to own every device you need to test your website on, and sometimes getting access to your development environment from those devices can be a pain. To that end, here is a quick list of emulators you can use to mimic those devices on a desktop computer:
Apple iOS SDK:
http://developer.apple.com/devcenter/iosThis tool allows you to emulate iPhones, iPads, and iPod Touches. It is not free however, and only runs under OS X.
Opera Mini Simulator:
http://www.opera.com/developer/tools/Firefox Mobile:
http://www.mozilla.com/en-US/mobile/download/Perfecto Mobile:
https://vf.perfectomobile.com/np-cas/loginThis tool allows you to remotely test on real mobile devices and networks. This link is for the Vodafone version, which is free for registered Vodafone developers.
Since testing CSS typically requires a human being, the best way you can make this process more efficient is to have a piece of software generate screenshots on your behalf. Many tools are available that can help with this. Let's take a look at three of the most common.
Selenium is an integration testing tool that is in widespread use (see Figure 10-20). Selenium is currently at version 2, which gives important improvements over the original. It was initially developed as an internal framework for ThoughtWorks, but has since become a fully fledged system in its own right with many contributors. A Firefox plugin, called Selenium IDE, allows you to create tests to (for example):
Browse to
http://mycompany.comWait for the page to load
Check that the text inside a specific
divcontains the phrase "our company is amazing"Click a specific anchor
Check that the text inside a specific
divcontains the phrase "click here to contact us"
The plugin can either record your actions in the browser or be used to build these tests up piece by piece. Recording is especially useful to get an idea of how the actions are built and how they work. The actions are stored within a "test case," and you can have multiple test cases within a "test suite." These tests can be run from within the IDE, and each action will turn green or red, depending on whether it passed (executed successfully or was true) or failed, respectively.

From a CSS developer's perspective, the most useful command that Selenium provides is captureEntirePageScreenshot, which does exactly what it says it does. Using this command, it is easy to automate the creation of a series of screenshots within Firefox.
However, testing just Firefox is not as useful as testing our entire supported browser matrix. To that end, Selenium IDE's big brother Selenium RC can be used to run these tests against multiple browsers, resolutions, color depths, and operating systems. Selenium RC also supports more commands than Selenium IDE; for example, captureScreenshot captures just the view within the current viewport. The tests can quickly become very large and slow to complete, which could be an issue if you are using them within a continuous integration (CI) environment (see Chapter 9), but this can be overcome with Selenium Grid, which allows you to attach many servers together and run all the tests in parallel.
Once you have created your screenshots and approved them, it would be possible to compare the approved versions with subsequent screenshots, and to pass or fail tests based upon this—but this is likely to be a fragile test as we have previously mentioned.
Although Selenium IDE feels clunky and limited in functionality, the suite of tools available is free, mature, and very capable. If you have the need for the other functionality provided (which you are likely to), Selenium is a great tool to help you achieve this. You can read more about it at http://seleniumhq.org/.
Although Selenium is as close to an industry standard integration testing tool as you are likely to find, several alternatives exist, some of which are listed here:
Watir:
http://watir.com/Sahi:
http://sahi.co.in/Windmill:
http://www.getwindmill.com/
Assuming that the only thing you are interested in is screenshots, Browsershots is a much simpler one-shot test. By browsing to http://browsershots.org/, you can enter a URL, tick the boxes for the browsers and operating systems you want to test, and then submit the form. Your request will be put in a queue, and when complete you will be returned a series of screenshots. Browsershots can take a long time to complete, but it is free. Alternatively, for around $30 per month, you can get priority processing and skip many in the queue. While it is a great tool for performing a large number of tests in one go, it has several drawbacks:
It is hosted, meaning the pages you test must be accessible to the outside world, which may not be acceptable to your organization
It would be very difficult and fragile to try to automate the process
It is very slow
If you have no alternative, Browsershots is a useful tool to have in your arsenal.
Browsercam (http://www.browsercam.com/) is a more capable and functional equivalent to Browsershots, with the ability to also perform interactions for a fee. It also provides a remote access service so that you can pick the operating system and browser you want and connect directly to a machine with that configuration to try things out on. From the perspective of simply generating screenshots, it has the same downsides as Browsershots and is also expensive, although it is faster.
This chapter demonstrated some of the many tools that can help you with debugging, as well as understanding how to decide which browsers to test and the best way to run those browsers. It also shows you some of the best ways that automation can help with the testing of CSS.
In the next chapter, we will be putting all our knowledge into practice and we will provide guides on and examples of how to build your own CSS framework.
[100] Opera allows you modify the source of a page directly and then refresh from the cache. Although unintuitive to use, this useful behavior is available out of the box. Be aware though, that if you are running a file directly from your file system, it will modify the file itself.
[101] Using colored borders has the same result, but modifies the size and positioning of the element.
[102] A wiki for WebKit's Web Inspector is available at https://trac.webkit.org/wiki/WebInspector.
[103] Instructions on enabling the experimental version can be found at http://my.opera.com/dragonfly/blog/getting-opera-dragonfly-ready-for-opera-11/#enable.
[104] Although Multiple IEs is no longer active developement, it can be found at http://tredosoft.com/Multiple_IE if you are interested.