
Performance has always been a big issue when it comes to Rapid Application Development (RAD). Most developers generally share the same opinion: if it's that fast and easy to create an application, the developer will have to "pay the price" elsewhere in terms of tool flexibility or application performance.
While this may hold true for other less integrated RAD tools (and to a much lesser degree for APEX), there has been no other RAD tool quite like APEX. The entire business logic layer in APEX is written in PL/SQL and hence executes within the context of the database—leading to far better performance than with other tools. In fact, APEX is commonly used to host mission critical applications. The APEX platform has been used to handle thousands of online transactions daily for an online e-commerce site based in Singapore, to create an application to handle millions of voters in Ukraine, and to handle the thousands of leads and opportunities captured hourly during nationwide roadshows held in Malaysia. The bottom line: APEX performance is good enough to handle usage-heavy scenarios.
APEX performance can, however, be further improved through a mixture of caching, SQL query design, and best practices. The recipes in this chapter will give you an idea how to achieve this improved performance.
Not every page in your application will be performance critical. Before you begin on any performance tuning task, you need to know which pages are in need of performance tuning—the ones that are accessed most frequently by your end users.
To measure page access frequency using the Monitor Activity tool, follow these instructions:
Login to APEX and click the large Administration icon.
You should see four icons, two of which are labeled Monitor Activity and Dashboards (as shown in Figure 7-1).
Click the Monitor Activity icon. Scroll down to the Page View Analysis section, and click the Most Viewed Pages over All Applications link.
You should see a view containing every single page and application in the workspace plus the frequency of access in the Count column (as shown in Figure 7-2). You can see that the MYCUSTOMERS page in the PATIENTDBAPP application is the most frequently accessed page, with eight views.


Tip
You will likely get a different page access count on your system, as it depends on how many times you actually viewed each corresponding page.
The Monitor Activity tool provides a wealth of diagnostic information pertaining to the execution of your APEX applications. The Page View Analysis section provides an eagle-eye view of application usage statistics. Table 7-1 describes some of these charts and their use. Your solution chose the Most Viewed Pages over All Applications chart, giving you a list of the most-used pages in your application.
Table 7.1. Usage Statistic Charts in the Page View Analysis Section
Chart | Description |
|---|---|
| Displays the full list of all pages/applications and their access frequency. This is useful to find out the most frequently accessed pages in your application. |
Displays access frequency (and number of users) by date (populated on a visual calendar). This view is useful to determine usage peaks over a single month and the number of users accessing your applications in any single day. | |
This chart displays total page access frequencies as a line chart on a daily or hourly timescale. This view is useful for fine-grain monitoring of usage peaks. | |
| This chart displays the average page rendering time for each page across all applications. This view is useful to gauge how each individual page performs in your application. |
You now know which pages are important in your application. Now you want to measure the performance (in terms of rendering time) for each of those pages. You want to spend your time on pages that take the longest to render and thus maximize the return from your optimization efforts.
To measure page performance, please follow these steps:
Login to APEX and click the large Administration icon. Click the Monitor Activity icon and navigate to the Page View Analysis section.
Scroll down to the Page View Analysis section, and click the By Weighted Page Performance link.
Set the desired time range to collect statistical information in the Since drop-down list. If you have accessed any of the pages in your applications recently, you should see the screenshot shown in Figure 7-3. You can see the average time taken to render each particular page under the Average Elapsed column.

The Page Views by Weighted Page Performance page shows execution statistics for each individual page in your application on an averaged basis. This report shows a few different pieces of information, which are described in Table 7-2.
Table 7.2. Page Execution Statistics
Column Name | Description |
|---|---|
| Displays the average time taken (in seconds) for the execution of the page. |
| Each page consists of page rendering and processing events that may affect the amount of time required to render the page. The weighted average multiplies the average rendering time by the number of events on the page. |
| This column displays the median of the average rendering time of each page. This gives a more accurate reading closer to the actual elapsed rendering time of the page. |
| The weighted median (for each page) is the median elapsed multiplied by the number of events in each page. |
These figures are particularly useful in that they allow you to zoom in on the pages that need performance optimization. For instance, the following is a series of steps you can adopt as a strategy for optimization:
Sort all pages by Median Elapsed time, and take note of all the pages that exceed a certain threshold. Consider deriving that threshold from your enterprise objectives. For instance, your Quality of Service statement might include delivering every page to your end user in less than three seconds. Such an objective will let you narrow down to a smaller and more manageable subset of pages for optimization.
Tip
It's interesting to note that public tenders issued by the Government of Singapore for IT projects typically outline the three-second maximum response time as one of the requirements for web-based applications.
Review the Page Events values. The Median Elapsed time alone is not a good indicator for the performance of the page. Looking at the Page Events column will let you make a better assessment, since the number of page events roughly correlates with the complexity of the page. For instance, a page that takes three seconds to load might actually be more performance-effective than a page that takes one second to load if that first page has 20 events and the second page has 1 event.
You now know the average elapsed time taken for each page. You want to drill down further into the performance of each individual region in a particular page. As in the previous recipe, your goal is to focus your optimization efforts on those pages and regions consuming the most time.
To measure region performance, please follow these steps:
Log in to APEX and open any application that contains a report. (To create a report page, please see Recipe 2-2). Navigate to the Page Rendering view of the report page.
Expand the Regions node, and right-click on any region under this node. Click the Edit menu item in the pop-up menu (as shown in Figure 7-4).
In the Edit Region page, click the Header and Footer tab. In the Region Footer section, enter the following line:
#ROWS_FETCHED# rows fetched (from a total of #TOTAL_ROWS# rows) in #TIMING# seconds
You should now see the screenshot shown in Figure 7-5.
Apply your changes and run the report. You should notice a new line at the bottom of the Report region which provides you the total time taken to run the query and render the region (and its contained items), as shown in Figure 7-6.


A page may consist of several regions; some may already be performance-optimized but others are not. When focusing on per-page optimization, it's useful to break it down further by running a quick assessment on the individual components (regions) in that page.
The best way to do this is to capture and print performance statistics for each region. This simple step will give you actual run-time statistics for all the regions in a page—and instantly reveal the particular region that's giving you performance troubles. Oracle APEX provides the substitution strings described in Table 7-3 to provide real-time information on performance statistics.
Table 7.3. Useful Substitution Strings for Performance Statistics Gathering
Substitution String | Description |
|---|---|
| Shows the elapsed time (in seconds) used in rendering a particular region. |
| Displays the total number of rows retrieved by the particular SQL query in a region. |
| Shows the total number of rows fetched by APEX from the query for display. |
You can place these substitution strings in more than one region on a page to find out how long each region takes to render. This will allow you to find the performance-poor region and to focus your performance tuning efforts there.
As you've seen in this recipe, these three pieces of information are indispensable in the goal of profiling your pages (and regions). It is important to look at all three parameters and not just the #TIMING# info.
For instance, consider this scenario: Region A might take three seconds in total to render, but this may be due to the fact that there are 500 rows to fetch for display, as opposed to Region B that takes one second to render but fetches only 100 rows. In this case, Region A might be better-performing than Region B despite Region B having a shorter rendering time. Thus, you should always consider all three parameters before deciding if a region needs performance optimization.
You have a region that retrieves a list of fixed/static data from the database for display. You want to improve the performance of this region by caching it.
To enable region caching, please follow these steps:
Log in to APEX and open any application that contains a form. (To create a form page, please see Recipe 2-1). Navigate to the Page Rendering view of the form page.
Expand the Regions node, and right click on any region under this node. Click the Edit menu item in the pop-up menu. This will bring you to the Region Definition page.
Click the Caching tab. Change the Caching drop-down list from Not Cached to Cached.
You should see several fields. Set the timeout value for the cache (the amount of time the region should stay cached) to 1 hour and the Cache condition type to Always, as shown in Figure 7-7.
Run your form now. If you include #TIMING# statistics in the region footer, you should observe that the amount of time elapsed in rendering the region is smaller on consecutive runs.

It's almost inevitable that pages in your application will have to handle dynamic queries, web service calls, and so on. If, for instance, you had to call a remote web service to retrieve the list of fruits for display in a region, that would equate to a lot of calls! Imagine a user base of 2000 loading this page—this would generate 2000 web service calls.
Now if the web service retrieves exactly the same thing or something that rarely changes (for example, branch outlet phone numbers), it would be ideal to have this information cached so that the web service need only be called once. The data retrieved is then stored locally. When the next user requests the same data, it would fetch it from the local store instead of invoking another web service call.
When you cache a region, you are doing exactly this. The static HTML (generated content) of an entire region can be cached by APEX, so that when the next user renders the region, it will just grab the static HTML from the local cache store. This saves a huge amount of processing cycles and can even significantly reduce network traffic (by reducing the number of dynamic calls to physically remote systems). You can choose to cache a particular region of a form by setting the Caching property to true. If you wanted caching to be always applied, choose the Always condition type.
You can specifically state the conditions in which data should be retrieved from the cache instead of being dynamically rendered. The Cache Condition Type drop-down lists allows you to specify this condition. For instance, if you are creating an online gift ordering application, you may want to create a condition that does a check on the system date so that caching will only be applied during the month of December, when you can expect a larger number of hits from holiday shoppers.
You have a page that consists mostly of static data. You want to improve the rendering performance of this page.
Page caching, as opposed to region caching, caches the static HTML of an entire page. To enable page caching, please follow these steps:
Log in to APEX and open any application that contains a form. (To create a form page, please see Recipe 2-1). Navigate to the Page Rendering view of the form page.
Right-click on the root node, and choose the Edit menu item in the pop-up menu. This will bring you to the Page Definition page.
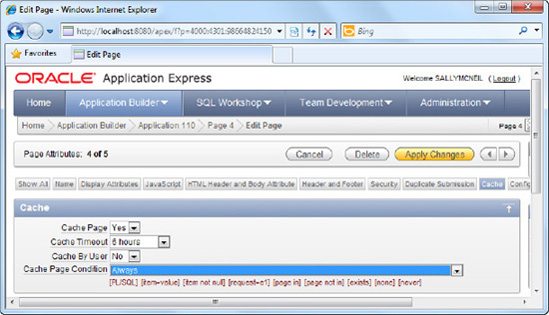
Click the Cache tab. Change the Cache drop-down list from No to Yes.
You should now be able to set the timeout value for the cache (the amount of time the region should stay cached) to 1 hour and the Cache condition type to Always, as shown in Figure 7-8.
Run your form now. If you use the Monitor Activity tool to check the weighted performance for the page, you should observe that the amount of time elapsed in rendering the page is smaller on consecutive runs.
Caching works not only at the region level but also at the page level. Page caching is different from region caching in that it caches the static HTML of the entire page. If your objective for the page is to simply display some static information that rarely changes, it is a good candidate for page caching.
The Cache By User setting allows the page to be cached by user, as opposed to caching by session. The difference is that if you cache a page by session, all other users will use the same copy from the cache, whereas if you cached a page by user, the data is only retrieved from the cache if it was accessed by the same user that first accessed the page.
Tip
One problem with page caching is that sometimes the data for a cached page might have changed, and APEX is still retrieving the cached copy. In such cases, it might be fruitful to invalidate the cache based on a certain event. You can use the APEX_UTIL.CLEAR_PAGE_CACHE(page_number); function to invalidate the cache when the user logs out of the application or after a period of inactivity, for example.