
Chapter 8
Enhanced Security Capabilities
Now that you know how to address recommendations to enhance the security posture of your cloud workloads and you understand the importance of threat detection based on the different Defender for Server options, you need to ensure that you also apply security controls to reduce the attack surface. In this chapter, you will learn how to use just-in-time (JIT) virtual machine (VM) access to harden the access to Azure VMs and ensure that your VMs are not always exposed to the Internet.
You will learn how to track changes to your files and registry hives using file integrity monitoring (FIM). Also, you will learn how Microsoft Defender for Cloud uses machine learning to create a list of approved applications on the machines.
Just-in-time virtual machine access
To provide remote access to VMs, the public cloud infrastructure provider must allow all remote management traffic to those VMs. To do this, it uses RDP, SSH, and remote PowerShell. Using these tools is easy, and as we all know, nothing beats easy. Unfortunately, easy is often the enemy of security, so it’s a difficult balancing act.
The reality of remote access changed substantially after COVID-19 because many more people started working remotely. A Gartner CFO Survey in 2020 revealed that 74 percent of the companies surveyed intend to permanently shift some employees to remote work. This means alternative methods for providing remote management traffic access to VMs are primarily utilized. Methods such as point-to-site VPN, site-to-site VPN, and various dedicated WAN link solutions are becoming more prevalent. Despite all that, it is still extremely important to have security policies to dictate how IaaS VMs are exposed to the Internet. If Internet exposure is mandatory, then just-in-time (JIT) VM access should also be mandatory.
RDP or SSH brute-force attacks are the most common types of attacks against VMs in Azure (and other public cloud service providers). VMs are continuously hit by attempts to log in. If you have a strong password policy, it’s unlikely your VMs will be compromised, but you shouldn’t trust this as your only countermeasure. You can take various steps to reduce the chance of being compromised by a brute-force attack, but you probably don’t want to hand over these tasks to your public cloud service provider. However, you might consider letting your public cloud service provider help you with network access to your VMs using management ports (RDP or SSH). Defender for Servers JIT VM access allows you to control who can access predefined management ports on a VM, when that access is granted, and for how long.
You need a set of privileges to work with JIT; these privileges will vary according to the type of operation that you need to perform or that you want to allow a user to perform. You can be very granular about this permission assignment by using these guidelines:
To configure or edit a JIT policy for a VM, you need to assign these actions to the role:
On the subscription or resource group scope associated with the VM:
Microsoft.Security/locations/jitNetworkAccessPolicies/writeOn the subscription or resource group scope of the VM:
Microsoft.Compute/virtualMachines/write
To request access to a VM, you need to assign these actions to the user:
On the subscription or resource group scope associated with the VM:
Microsoft.Security/locations/jitNetworkAccessPolicies/initiate/actionOn the subscription or resource group scope associated with the VM:
Microsoft.Security/locations/jitNetworkAccessPolicies/*/readOn the scope of a subscription, resource group, or VM:
Microsoft.Compute/virtualMachines/readOn the scope of a subscription, resource group, or VM:
Microsoft.Network/networkInterfaces/*/read
To read JIT policies, you need to assign these actions to the user:
Microsoft.Security/locations/jitNetworkAccessPolicies/readMicrosoft.Security/locations/jitNetworkAccessPolicies/initiate/actionMicrosoft.Security/policies/readMicrosoft.Security/pricings/readMicrosoft.Compute/virtualMachines/readMicrosoft.Network/*/read
Also, if you need to see the JIT NSG policy from the VM Networking blade, add the following:
Microsoft.Network/networkSecurityGroups/readMicrosoft.Network/networkSecurityGroups/defaultSecurityRules/readMicrosoft.Network/networkSecurityGroups/securityRules/read
While the permissions above can apply the principle of least privilege, remember that you will need to merge some permissions if you are accessing the Azure portal. For example, to configure or edit a JIT policy for a VM, you will need the given set of privileges and the privileges to read the JIT policies mentioned previously.
Assuming you have the right privileges, you can start by reviewing the Defender for Cloud Management ports of virtual machines should be protected with just-in-time network access control recommendation, which recommends that JIT be enabled for Azure VMs. It is very important to understand that Microsoft Defender triggers the recommendation to enable JIT for Cloud, but to enable JIT, you need to have the Defender for Servers plan enabled.
Note
The recommendation to enable JIT is available for VMs in Azure and EC2 instances in AWS.
Recommendation to enable JIT
This control, which is enabled through Azure network capabilities—rather than through any feature or system on the VM itself—is exerted over incoming connections to the VM. Defender for Cloud will trigger a recommendation when it identifies that a VM needs JIT in Azure or AWS; these recommendations appear in the Secure Management Ports security control. The recommendations to enable JIT for Azure and to enable JIT in AWS are shown in Figure 8-1 (the third and fourth recommendations from the top).
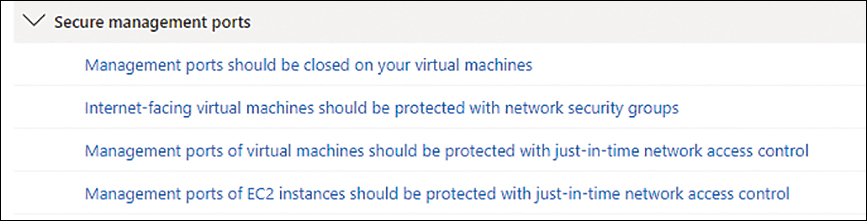
FIGURE 8-1 JIT recommendation
For this example, open the Management ports of virtual machines should be protected with just-in-time network access control recommendation. You will see that there are three tabs at the bottom: Unhealthy Resources (where JIT is recommended), Healthy Resources, and Not Applicable Resources (VMs that don’t meet the criteria to have JIT enabled). See Figure 8-2 for an example of this page.

FIGURE 8-2 JIT recommendation details
Note
To understand how Defender for Cloud identifies whether a VM is unhealthy, healthy, or not applicable, see the flowchart at http://aka.ms/MDCBookJITFlow.
To enable JIT from this recommendation blade, you just need to choose a VM and click the Remediate button. Once you do that, the JIT VM Access Configuration page appears, as shown in Figure 8-3.
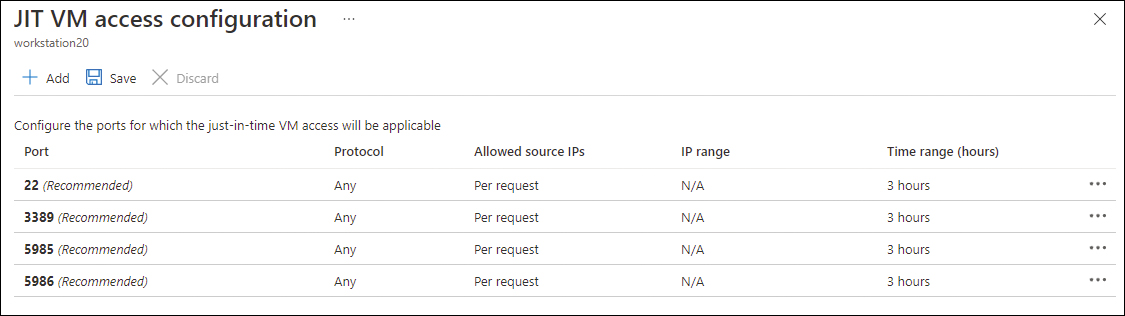
FIGURE 8-3 Selecting the ports that will be allowed
On this page, you can leave the default ports, or you can delete the ones you don’t need. By default, the suggested ports are shown here:
22: Secure Shell (SSH) Commonly used to access Linux machines.
3389: Remote Desktop Protocol (RDP) Commonly used to access Windows machines.
5985: Windows Remote Management (WinRM) 2.0 connection via HTTP Windows Remote Management is a component of the Windows Hardware Management feature that manages server hardware locally and remotely.
5986: WinRM 2.0 connection via HTTPs
To delete a port, you just need to click the ellipsis (…) to the right of the desired port and click Delete. If you enable JIT on a machine on which you only need access via RDP, then you can delete all the other ports. To configure the properties of the connection, click the port itself. For this example, click 3389; the Add Port Configuration page appears, as shown in Figure 8-4.

FIGURE 8-4 Port configuration for JIT
Because the goal is to configure RDP, the port and protocol will not change. However, you can customize the allowed source IPs, which can be according to the request, or you can also specify a classless inter-domain routing (CIDR) address block of IPs. Lastly, you can configure the Max Request Time, which is the amount of time the port will be open. It is important to mention that the user will not have its connection dropped if the request exceeds this time, though if the user disconnects and tries to connect again, the connection won’t work because the port will be closed. Once you finish the configuration, click OK to commit the changes and then click Save.
JIT dashboard
To access the JIT dashboard, you first need to access the Workload Protections dashboard, which is located on the left navigation pane of the Defender for Cloud portal. Once you access this dashboard, you will see Just In Time VM Access in the Advanced Protection section at the bottom of the page, as shown in Figure 8-5.

FIGURE 8-5 Workload Protections dashboard
Click the Just In Time VM Access option to access the JIT dashboard. There, you will see a comprehensive list of VMs that are Configured, Not Configured, and Unsupported, as shown in Figure 8-6.
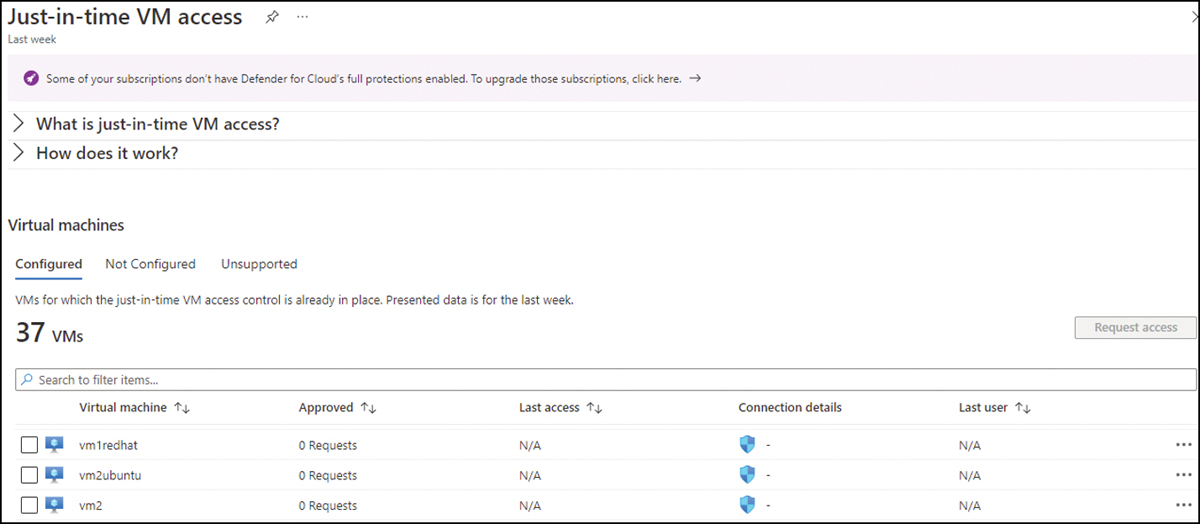
FIGURE 8-6 JIT dashboard
If you are reviewing the VMs that are configured, you can easily identify the number of requests in the Approved column, when the VM was last accessed in the Last Access column, which port the connection was established in the Connection Details column, and the last user who remotely accessed this VM in the Last User column. If you need to perform any configuration, you can click the ellipsis (…) to the right of the VM to see the following options:
Properties This option will redirect you to the VM blade, where you can see the VM configuration in Azure.
Activity Log This option will redirect you to the Azure Activity Log page, where you can see previous operations for that VM along with time, date, and subscription.
Edit This option will redirect you to the page shown previously in Figure 8-3. There, you can change the JIT configuration for that VM.
Remove This option will remove JIT configuration from this VM.
The Not Configured tab, as the name implies, shows a list of machines that support JIT but have not been configured yet. In the example shown in Figure 8-7, some VMs appear with the Healthy status because this VM is protected by an NSG that blocks access to management ports; VMs that are shown as High severity are protected by an NSG, though access to management ports is allowed.
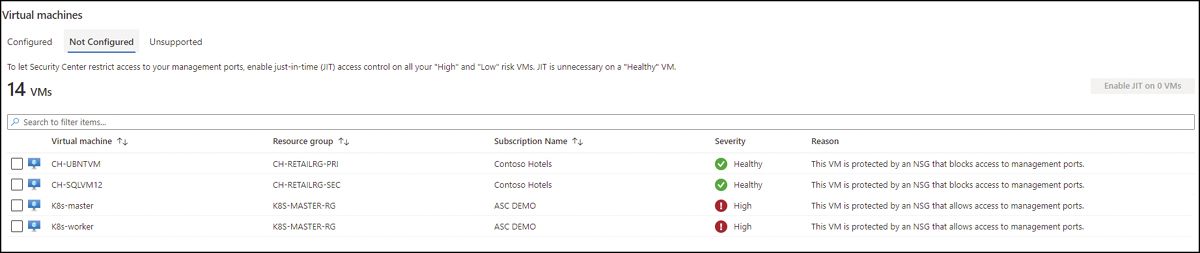
FIGURE 8-7 Machines that are capable of having JIT configured
When evaluating this list, look at the Severity column to identify the VMs that need to have JIT enabled. This will help you to prioritize which VMs you should address first.
The Unsupported tab shows the VMs that can’t have JIT enabled. Reasons JIT cannot be enabled include machines that are missing an NSG and classic VMs. Also, a VM can appear on this tab if the JIT solution is disabled in the subscription’s or resource group’s security policy.
Requesting access
Once the VM is configured, you can request access to it using the Azure portal or the Defender for Cloud dashboard. If you access the VM properties from the Azure portal and click the Connect button to establish an RDP connection, you will see that the Request Access button is available, as shown in Figure 8-8.
The same option is available from Defender for Cloud. To access it, open the JIT dashboard and initiate the access request by selecting the VM and clicking the Request Access button. The page shown in Figure 8-9 appears, which allows you to configure the request.

FIGURE 8-8 Request Access option
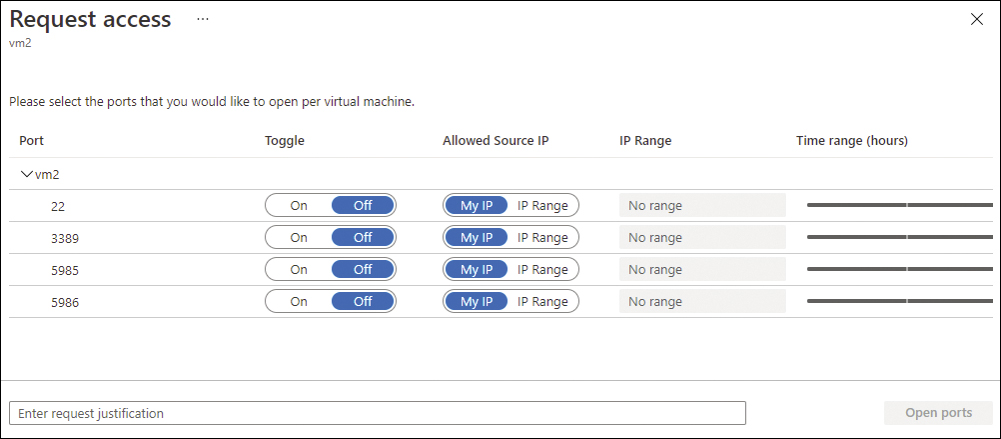
FIGURE 8-9 JIT Request Access page
This page allows the user requesting access to customize the request by providing the port that needs access, the origin IP, the time range for the access, and a justification for this access. Once all this information is configured, the Open Ports button will be available to finish the access request.
Using the PowerShell or Defender for Cloud API, you can also configure the JIT VM Access policy. To access a sample PowerShell script, visit http://aka.ms/MDCJITVMSample. To learn more about the API for JIT, visit http://aka.ms/JITVMAPI.
File integrity monitoring
File Integrity Monitoring (FIM) helps protect the integrity of your system and applications because Defender for Servers will continuously monitor the behavior of your registry and configuration files. If an abnormal change to the files or malicious behavior is detected, Defender for Servers will track the change, which allows you to stay in control of your files. File Integrity Monitoring is based on Change Tracking and Inventory in Azure Automation. FIM is used to track and identify changes in your VMs and requires Change Tracking and Inventory in Azure Automation to be enabled on the workspace.
VMs connected to the Log Analytics workspace use the Log Analytics agent to collect data about changes to installed software, Microsoft services, Windows registry and files, and Linux daemons on monitored servers. When data is available, the agent sends it to Azure Monitor Logs for processing. FIM is available in the same Workload Protections dashboard where you access JIT in the Advanced Protection section (see Figure 8-5). If you have multiple workspaces and you access FIM, the last column shows Enable or Upgrade Plan options. The Enable option means you can enable FIM on a workspace; the Upgrade Plan option means you can upgrade the plan first and then enable FIM on it, as shown in Figure 8-10.

FIGURE 8-10 File Integrity Monitoring
Important
Workspaces that are shown with the Upgrade Plan button are those that use the free tier and don’t have the Defender for Cloud plan enabled on the workspace level.
It might take some time for FIM to identify the total number of computers in the workspace and populate the dashboard. Once it is populated, you will see a dashboard with a summary of statistics that is similar to the screen shown in Figure 8-11.
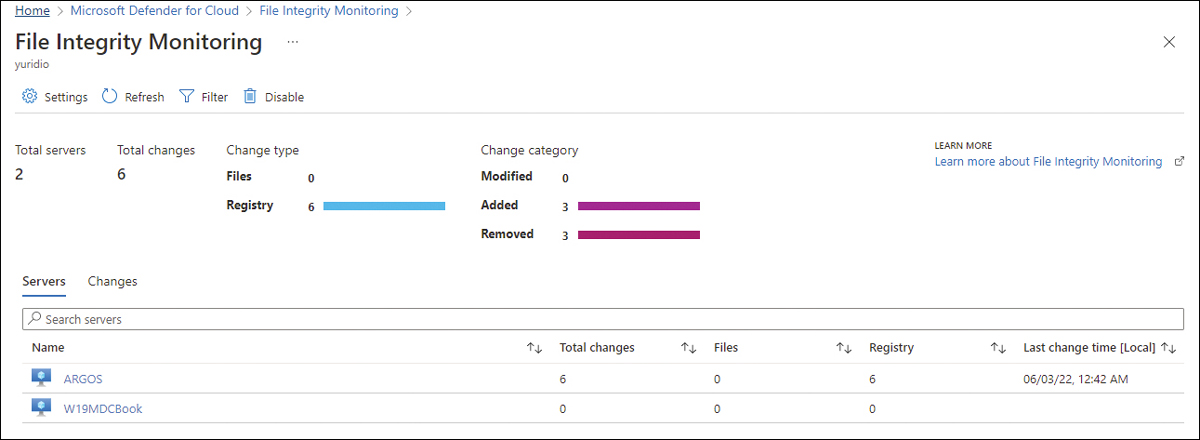
FIGURE 8-11 FIM dashboard
Customizing your settings
Although Defender for Cloud will suggest which files and registry keys you should monitor, you can still customize and add your own preferences. Follow these steps to perform this customization:
On the File Integrity Monitoring blade, click the Settings button, as shown in Figure 8-12.
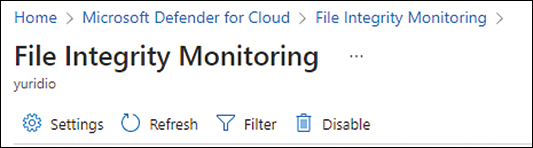
FIGURE 8-12 Initial screen to customize files and registry settings
The Workspace Configuration page appears, as shown in Figure 8-13.
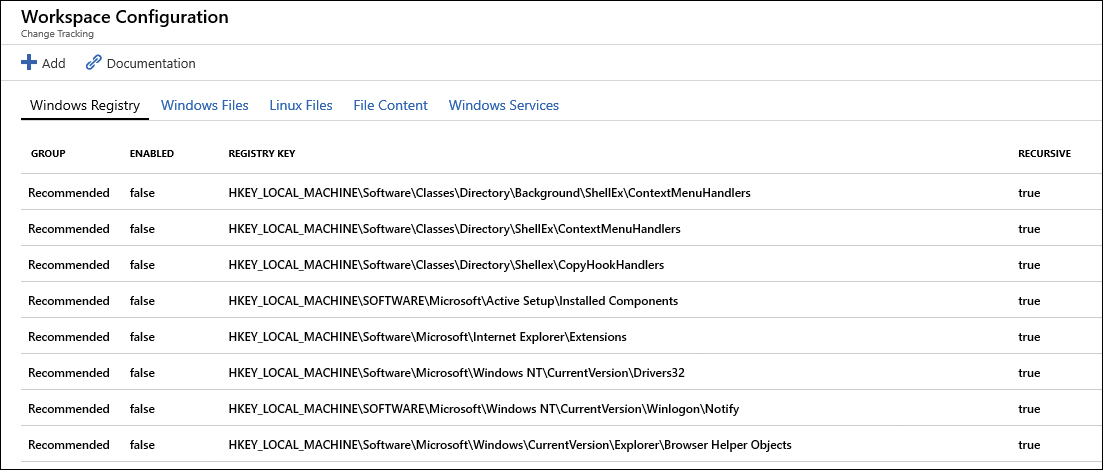
FIGURE 8-13 Customizing files and registry values to monitor
The Windows Registry tab contains all registry keys that can be monitored. Notice that some are set to False (in the Enabled column), which means that they are not being monitored, and others are set to True, which means that key is currently being monitored. To add a new registry key, click Add; the Add Windows Registry For Change Tracking page appears, as shown in Figure 8-14.
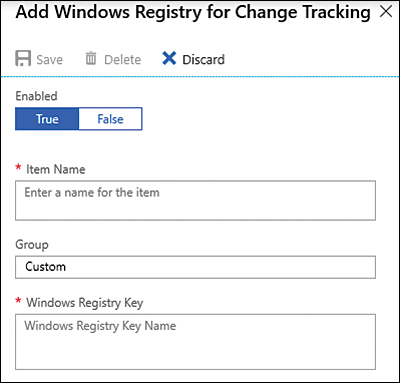
FIGURE 8-14 Adding a new Windows registry key to monitor
In the Item Name field, type a friendly name for this registry key.
In the Windows Registry Key field, type the registry path (for example,
HKEY_LOCAL_MACHINESoftwareMicrosoftWindowsCurrentVersionRun).Click the Save button to commit your changes.
While adding a new registry key to monitor is very straightforward, there are more options for configuring Windows files. To see the options available, select the Windows Files tab and click the Add button. The Add Windows File For Change Tracking page appears, as shown in Figure 8-15.
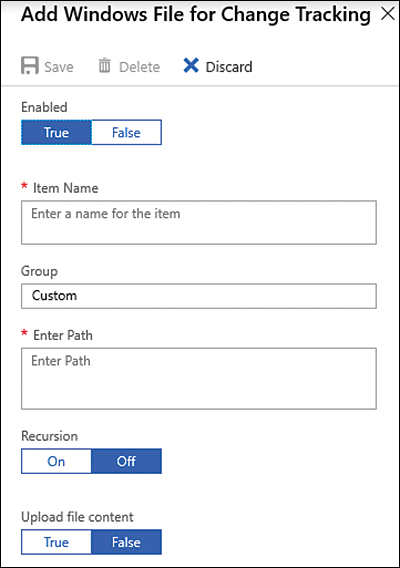
FIGURE 8-15 Adding new files to track changes
In addition to fields for the Item Name and path, this page contains the Recursion option, which can be set to On or Off. Recursion allows you to specify wildcards for simplifying tracking across directories. Also, the environment variables allow you to track files across environments with multiple or dynamic drive names.
Note
If you use wildcards, remember that you can only use the last segment of a path (such as c:folder*file* or /etc/*.conf).
The Upload File Content option can be either True (monitor and track when files are uploaded to this folder) or False (do not monitor when files are uploaded to this folder).
For Linux files, some unique items are worth mentioning. Choose Linux Files > Add. The Add Linux File For Change Tracking page appears, as shown in Figure 8-16.
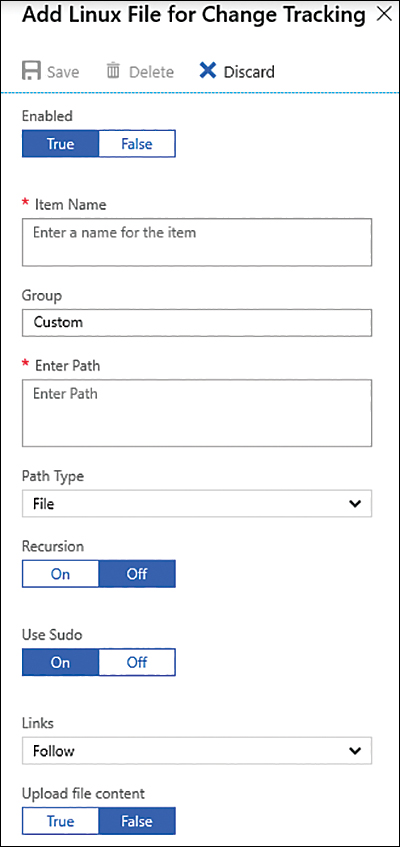
FIGURE 8-16 Adding new Linux files to track changes
In the Path Type field, you can select whether you want to monitor a file or a directory. The Use Sudo option can be set to On, which means Sudo will be used when checking for the item, or Off (don’t use Sudo). The Links field determines how symbolic links are dealt with when traversing directories. The available options are:
Ignore This option ignores symbolic links and will not include the referenced files and directories.
Follow This option follows the symbolic links during recursion and includes the referenced files and directories.
Manage This option follows the symbolic links and allows returned content to be altered.
The File Content tab (shown in Figure 8-17) contains the relevant settings for enabling this capability, which requires a standard storage account using the Resource Manager deployment model.

FIGURE 8-17 Configuring File Content settings
To connect an existing storage account to this feature, click the Link button and select the storage account.
Visualizing changes
Now that you have this feature enabled, you can start tracking the changes from the time FIM was enabled forward. Keep in mind that FIM will not show the changes immediately because the data collection frequency for FIM can vary according to the data type, as shown below:
For the Windows registry, the frequency is 50 minutes.
For Windows files, the frequency is 30 minutes.
For Linux files, the frequency is 15 minutes.
To visualize changes to the registry, follow these steps:
On the File Integrity Monitoring blade, you will see a snapshot of the changes, as shown in Figure 8-18.

FIGURE 8-18 File Integrity Monitoring after change tracking has started
Click the Changes tab to see a list of the last 100 changes that have occurred in the monitored system (see Figure 8-19).

FIGURE 8-19 The Changes tab
To see more details about what changed, click any of those entities to see the original registry key value and the changes made, as shown in Figure 8-20.

FIGURE 8-20 Changes made in the registry
Adaptive Application Control
Creating restrictions to allow only certain applications to run has always been a goal of on-premises security. The idea behind creating an allowed list of applications is that if you can define and control a predefined list of applications running on a particular operating system, then any other process that runs on the machine represents a possible threat.
This capability existed for many years with Windows Server. While there were some strong advocates for the “application allow list” solution in Windows Server called AppLocker, the basic problem of configuration and maintenance complexity prevented it from being the success it could have been.
One of the implicit goals of the cloud is to make infrastructure transparent to the user. The idea is that the cloud will provide resources desired by the user, and the user can consume these resources without making large investments to understand how and where the resources are run and maintained. Also, users should not need to understand complex constructs that can take many hundreds of hours to gain highly specific professional expertise.
These are still the goals of the cloud, but in most areas, we are still quite a way from that vision because many IT Pros tell us that the cloud is often more complex than on-premises computing. We tell those IT Pros to be patient. Over time, the cloud will fulfill its true vision, and getting things done in the cloud will be much easier than it ever was on-premises.
We can see the implementation of this technology in the Defender for Servers Adaptive Application Control feature. Defender for Servers uses machine learning to learn about the processes running on the virtual machines and the virtual machine’s behavior. This learning process usually takes two weeks, and after that period, you will see a recommendation in Defender for Cloud to enable Adaptive Application control, as shown in Figure 8-21.

FIGURE 8-21 Recommendation to enable Adaptive Application Control
When you click the Adaptive Application Controls For Defining Safe Applications Should Be Enabled On Your Machines recommendation, you will see one or more groups created by Adaptive Application Control with similar applications that should be allowed, as shown in Figure 8-22.

FIGURE 8-22 The alert blade contains the answers to the major investigation’s questions.
VMs that have the same set of applications are aggregated into groups. On the Enable Adaptive Application Controls page, you can look at the Machines column to see how many machines each group contains. To enable Adaptive Application Control for a specific group, click it, and you will see the Configure Application Control Rules page, as shown in Figure 8-23.

FIGURE 8-23 Configure Application Rules page
On this page, you can select the machines you want to be part of the group or all the VMs suggested by the recommendation. In the Recommended Application section, you can disable applications you don’t want to be part of the allowed list. Keep in mind that Defender automatically creates this list for servers based on the machine learning analysis of the applications running on the VM. Once you finish, click the Audit button to commit the changes.
The button is called Audit because you are not blocking other applications from running. Instead, with this feature, you are only auditing the allowed applications and being made aware of applications running outside this scope. When an application outside this group’s scope is executed, Defender for Servers will generate an alert.
Configuring Adaptive Application Control
To access the Adaptive Application Control dashboard, go to the Workload protection dashboard, and in the Advanced Protection section, click Adaptive Application Control. The Adaptive Application Controls page appears, as shown in Figure 8-24.

FIGURE 8-24 Adaptive application controls dashboard
The first tab contains a list of currently configured groups, and you can quickly see the number of machines in the group in the Machines column. The auditing status is shown in the Protection Mode column, and any alert triggered for that group is shown in the Alerts column. The Recommended tab contains a list of recommendations for applying application controls to define a list of known-safe applications (see Figure 8-23 earlier in this section). The No Recommendation tab shows a list of machines without a defined allow list of applications, or VMs that don’t support this feature. Some scenarios in which a VM might appear in this list include:
Machines that are missing the Log Analytics agent
Machines that have the Log Analytics agent installed, but the agent is not sending events to the workspace
Machines with Windows operating system that have AppLocker policy enabled by either a GPO or a local security policy
Changing policy
To change the configuration of a group, you can click the group to make the Edit Application Control Policy page appear, as shown in Figure 8-25.

FIGURE 8-25 Edit Application Control Policy page
In the Recent Alerts section, you can see the alerts that were triggered by this group. This section is read-only because its intent is to provide easy access to the alerts by group. The same information is available in the Security Alerts dashboard. In the Configured Machines section, you can either delete a machine from this group or move a machine to another group. When you move a machine from one group to another, the application control policy changes the settings of the destination group. You can also move a machine from a configured group to a non-configured group, though this operation removes any application control rules that were applied to the machine. Essentially, a configured group contains the application control policies, and all machines in it will utilize them.
Under Publisher Allowlist Rules, you can select the rule and click the ellipsis (…) to the right of the rule, which opens a pop-up menu from which you can select Edit Rule or Delete, as shown in Figure 8-26.
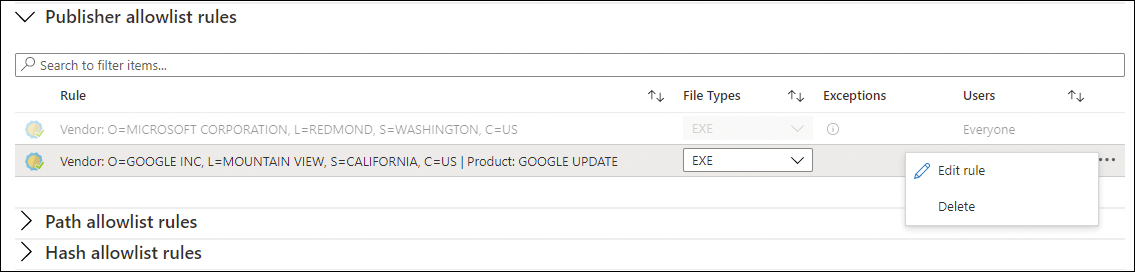
FIGURE 8-26 Options to edit or delete a publisher allowlist rule
Signed applications have information about their publisher. If you need to edit the publisher information, click Edit Rule in the pop-up menu, and you will see the Edit Rule page, as shown in Figure 8-27.
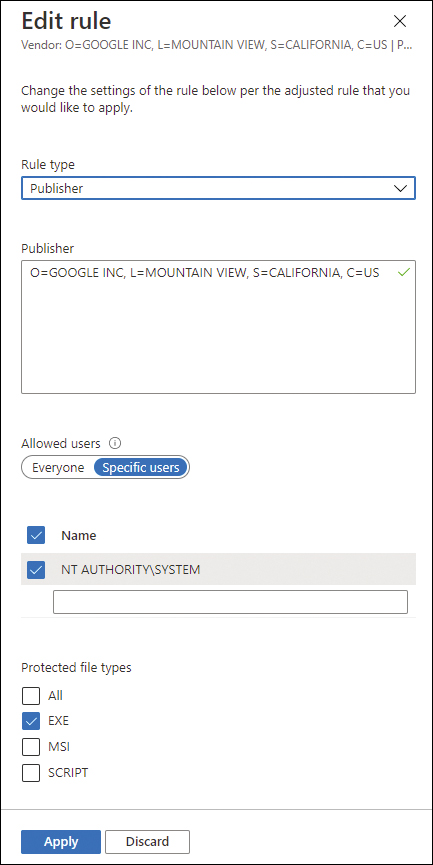
FIGURE 8-27 Options available to customize the publisher rule
It is not very common that you need to change a publisher rule, but in some scenarios, you might have to change which rule can run the applications. Depending on the scenario, you either need to harden the rules to Specific Users or open rules for all users by choosing Everyone. In the example shown in Figure 8-27, only the system can execute protected .EXE files (determined in the Protected File Types section). After making the necessary changes, click the Apply button.
If you need to create a completely new rule for your specific needs, you can click the Add Rule button; the Add Rule page appears, as shown in Figure 8-28.
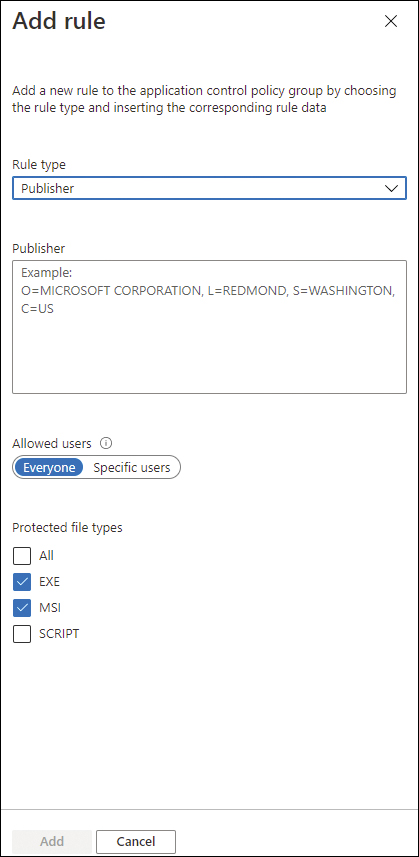
FIGURE 8-28 Options available to create a new rule
On this page, you can select the type of rule that you want to create:
Publisher Identifies an application based on its digital signature and extended attributes. The digital signature contains information about the company that created the application (the publisher).
Path Identifies an application based on the path condition that is provided. This path reflects the application’s location in the file system.
Hash Identifies an application based on the file hash.
You will need to configure the appropriate options and set the user’s scope based on your selection. In other words, you need to determine whether this rule applies to all users (Everyone) or just some users.
The Path Allowlist Rules and Hash Allowlist Rules on this page will be populated according to the rules you create manually or the rules automatically suggested by Adaptive Application Control.
Application violation
Now that everything is configured, you might start experiencing application violation alerts. Figure 8-29 shows an example of an application violation alert, which is the alert you will receive if an application that is not allowed is executed on the machines that are part of a group configured to use Adaptive Application Control.

FIGURE 8-29 Application violation alert
This alert has all the information you need to evaluate whether this application should be added to the allow list. We created a workflow automation that allows you to trigger a Logic App that will automatically add the file to the allow list. You can download this automation at http://aka.ms/MDCBookAAA.