
Chapter 14: Security Operations
In this chapter, we will cover security operations and how monitoring tools can be incorporated into their operational workflows. Like a technical operations team, it is just as important to have a security operations team or Security Operations Center (SOC) and program in place. This team's day-to-day responsibilities include 24/7 monitoring and response to any security-related incidents that affect your environment or end users. This is a critical component and a necessity of an overall security program. Recent trends have shown that attackers operate during off hours, weekends, and holidays to avoid detection and maximize damage.
In this chapter, we will focus on the Microsoft technologies available that can support your SOC and provide the insights needed to ensure that servers, end user devices, and users are safe. We will first cover an introduction to a SOC and provide an overview of the key concepts needed to implement a successful operation. We will define eXtended Detection and Response (XDR) and review the Microsoft 365 (M365) Defender portal, which provides a centralized place for monitoring Microsoft security solutions. Next, we will focus on Microsoft Defender for Endpoint (MDE) and review how to prevent, detect, investigate, and respond to threats.
In the following section, we will review Defender for Cloud alerts and incidents and provide an overview of Microsoft Sentinel, Microsoft's cloud Security Information and Event Management (SIEM) tool. Next, we will cover Microsoft Defender for Cloud Apps (MDCA) and how to configure and use Microsoft Defender for Identity (MDI). To close the chapter, we will discuss data protection with M365 and finish with a brief overview of planning for business continuity.
To recap, this chapter will cover the following topics:
- Introducing the SOC
- Understanding XDR
- Using the M365 Defender portal
- Security operations with MDE
- Investigating threats with Defender for Cloud
- Enabling Azure-native SIEM with Microsoft Sentinel
- Protecting apps with MDCA
- Monitoring hybrid environments with MDI
- Data protection with M365
- Planning for business continuity
Technical requirements
To follow along with the overviews in this chapter and complete the how-to instructions, the following requirements are recommended:
- An Azure subscription with contributor rights
- MDCA (trial/MDCA and EMS E3 or E5)
- MDI
- Microsoft Defender for Cloud (free/enhanced)
- Microsoft Sentinel (per capacity or pay-as-you-go)
- MDE (Windows 10 E5/M365 E5)
Many of the services allow you to set up trials or include free versions to help you get started. We recommend working with a sales representative at Microsoft to understand the best options regarding licensing, as the requirements change frequently.
In addition to these products, we will also discuss an overview of Microsoft's data loss prevention technology using components of Microsoft Purview Information Protection, formerly Microsoft Information Protection (MIP), and Azure Information Protection (AIP). Throughout this chapter, the abbreviations may be used interdependent of each other.
Introducing the SOC
Operations within the technical world of a mature organization should be a standard and mature process. This function is core to the ongoing success of IT systems, users, and applications to ensure efficiency and availability for your business operations. If there is an outage or an issue, operations teams typically follow very strict Service Level Agreements (SLAs) to return a service to normal. This same concept is applicable to the security world. The concept of a SOC has grown exponentially over recent years, to the point where it is a necessity for maintaining normal business operations.
In short, a SOC manages and overlooks the day-to-day functions of your security operations. They should operate 24/7 to monitor and detect potential security risks and respond to alerts within an environment. If any alerts are detected, it is the SOC's responsibility to investigate, help remediate, and escalate to the appropriate team or personnel. A major part of this process also includes identifying the impact and potential damage your organization may face because of a security incident.
When looking at the security incident response life cycle, there are a few variations, but they all mostly overlap and follow a similar process. When referencing the NIST Special Publication 800-61, Revision 2, Computer Security Incident Handling Guide, a four-step process is used for the incident response life cycle:
- Preparation
- Detection and analysis
- Containment, eradication, and recovery
- Post-incident activity
To learn more about the NIST incident response life cycle, visit the NIST Computer Security and Incident Handling Guide at https://nvlpubs.nist.gov/nistpubs/SpecialPublications/NIST.SP.800-61r2.pdf.
One important document that needs to be clearly stated after any incident is the Root Cause Analysis (RCA). Ensuring a root cause is identified validates that the vulnerability that caused the incident has been remediated. In addition, and sometimes dictated by the severity of the incident, the RCA may need to be provided to the leadership team for review. For this reason, the RCA must clearly define why there was an incident, what the impact or damage was, how the incident was remediated or mitigated, and an action plan to ensure any findings are resolved and don't happen again.
There are different variations of SOC models that can be adopted, and different factors will determine which model makes sense for your organization. These factors may include the company size, the type of industry of the business, regulatory reasons, and budget considerations. In the insourced model, a SOC is managed and operated by staff internal to the organization. This is a likely case for larger enterprises with bigger budgets who can afford to recruit top talent. Some organizations may opt for a fully outsourced model where you contract your SOC services to an external vendor who specializes in security services. This is referred to as a Security Operations Center as a Service (SOCaaS) or an outsourced SOC, which is typically offered through a Managed Security Service Provider (MSSP). The SOCaaS model is an attractive service for medium to smaller-sized businesses that may not have the budget to implement a fully functioning insourced SOC. This hybrid model maintains some functions of the SOC internally and outsources a subset of specialty services to an MSSP.
An additional service that a mature SOC program should implement is a Digital Forensic Incident Response (DFIR) service. This is a very specialized service that provides a detailed analysis of artifacts during an investigation of a security incident. Due to the specialized skillset and tools used in digital forensics, the MSSP may not provide a DFIR as part of its standard service offerings. With the continuous increase of threats that organizations face today, having a DFIR service available to engage quickly is critical to providing a detailed forensic analysis of evidence in the attack timeline. If your business has purchased a cyber insurance policy (which is highly recommended), the cyber insurance company will have an approved list of vendors that you can engage with for any DFIR services.
A SOC's ability to be efficient will depend on the available tools to provide the best visibility into your environment and the activities that have taken place. Throughout this chapter, we will be reviewing many of the Microsoft tools that help make up a well-rounded and robust security operations program. Next, let's look at XDR and how relevant it has become for cyber defense.
Understanding XDR
XDR expands beyond the original detection and response capabilities of a single technology to include multiple technologies. You should now be familiar with Endpoint Detection and Response (EDR) for MDE and its comprehensive coverage across endpoints as a single technology. XDR not only covers endpoints but also expands into email, servers, cloud infrastructure, identity and access management, network, applications, and so on.
You are most likely monitoring, collecting data, running analysis, and responding to all the different technology areas mentioned previously as part of your security program. The challenge commonly faced is a lack of a unified view and context in the attack timeline within these technology areas, due to separate tools and solutions. XDR brings everything into a centralized view for greater efficiency, allowing for quicker response to incidents and alerts. XDR doesn't replace a SIEM or security orchestration automation and response (SOAR) deployment. It complements it by adding intelligence, automation, and advanced analytics to data to correlate events and allow focus on higher-priority incidents.
XDR is available from many vendors now, and it's highly recommended you review and understand XDR and the benefits it can provide to your organization. With the focus of this book on Microsoft technologies and the Microsoft security stack, the following solutions offer XDR capabilities:
- M365 Defender to protect and secure your end users with tools such as MDI, Defender for Office 365, MDE, and MDCA
- Microsoft Defender for Cloud to protect and secure your infrastructure with secure posture management and threat protection across Azure, hybrid, and other third-party cloud environments
- Microsoft Sentinel, a cloud-native SIEM and SOAR, for increased efficiency with your XDR capabilities
The following figure provides a high-level overview of Microsoft's XDR capabilities and what prevention, detection, and protection capabilities are provided:
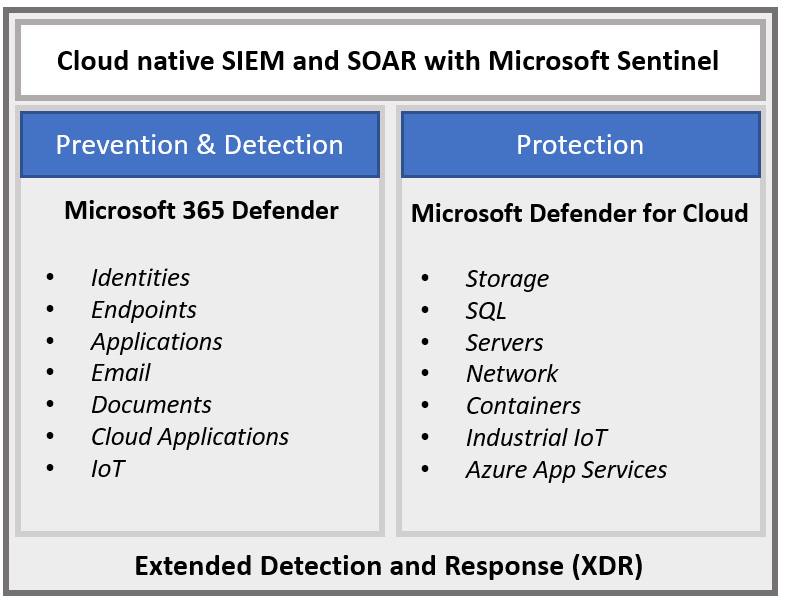
Figure 14.1 – Microsoft's XDR capabilities
Next, let's review the first component of XDR using the M365 Defender portal.
Using the M365 Defender portal
To help centralize the management and configuration of the Microsoft Defender products, the M365 Defender portal provides a single pane of glass experience. This helps simplify security operations and increase efficiencies by combining portals, allowing easier correlation of security threats across much of the Microsoft security suite to be viewed from one centralized place. The M365 Defender portal can be accessed by going to https://security.microsoft.com. The security team will need to be assigned a Global Administrator, Global Reader, Security Administrator, Security Operator, or Security Reader role to view data, with other fine-grained access controls available depending on the products they need to access. From the landing page, you can add and organize cards to quickly visualize activities across the products holistically. This can be seen in the following screenshot from the M365 Defender portal landing page:

Figure 14.2 – Common cards in the M365 Defender portal
Within the M365 Defender portal, you can access the following products from within the menu options:
- MDE can be found under Endpoints. Here, you can manage the EDR capabilities of Windows Defender on clients and servers.
- Microsoft Defender for Office (MDO) can be found under Email & Collaboration. Security teams can manage threats targeting email and collaboration tools and configure MDO threat policies, such as anti-phishing and anti-spam.
- MDCA can be found under Cloud Apps. MDCA is a cloud app security broker that brings visibility and security controls to SaaS applications.
Access to reporting, unified audit logs, permissions and roles, and service health can all be found from the M365 Defender portal menu. Clicking More resources will provide links to the different management consoles that make up most of the security and compliance portfolio from Microsoft.
For more information about all the available Microsoft security portals, visit https://docs.microsoft.com/en-us/microsoft-365/security/defender/portals?view=o365-worldwide.
Next, let's look at using Microsoft Secure Score and the benefits it provides to help with your overall security posture.
Improving security posture with Microsoft Secure Score
Getting a reliable and consolidated overview of your organization's security posture can be challenging, especially if multiple security and vulnerability scanning solutions are being used across multiple vendors. Additionally, if your company goes through a yearly security audit exercise, it can be expensive and time-consuming, and the data can quickly become outdated. If you're heavily invested in the Microsoft security stack, one product that will help to provide an overview of your organization's security posture is Microsoft Secure Score. Microsoft Secure Score provides analysis across the identity, device, and application areas by comparing your current settings and configurations against Microsoft's recommended best practices. The output results in a percentage-based score across each category that is averaged to become your overall secure score, which includes recommendations and improvement actions. By completing these actions, you can increase your overall score. Each improvement action is weighted by priority and assigned points. As you complete each task, you will gain points that will be applied to the overall score.
To view your secure score, log in to the M365 Defender portal at https://security.microsoft.com and click on Secure Score. The Overview page will show your overall score, top improvement actions, and a comparison to other organizations of similar sizes. The landing page can be seen in the following screenshot:

Figure 14.3 – Secure Score
Click the Improvement actions tab at the top of the page to view the list of available recommendations. Each improvement action includes more details about the recommendation, exposed entities, and an implementation plan that includes links to any correlated vulnerabilities identified by M365 Defender. After any recommended actions have been taken, your Secure Score dashboard will reflect the changes and add the points to your score. If the security recommendation doesn't apply, it can be exempt from reporting, and you will be credited for the score.
In the following example, Microsoft recommends enabling an attack surface reduction (ASR) rule to block Adobe Reader from creating child processes.

Figure 14.4 – Improvement actions
The current products included in the score weight include M365 (Exchange Online, OneDrive for Business, SharePoint Online, and Microsoft Purview Information Protection), Azure AD, MDE, MDI, MDCA, and Microsoft Teams.
Tip
To view the Microsoft Secure Score for Devices, click the Dashboard option under Vulnerability management from the M365 Defender portal. The score is broken into different controls, specific to security configurations on endpoints.
Next, let's look at how security teams can use the M365 Defender portal and MDE to investigate incidents and alerts on endpoints.
Security operations with MDE
The M365 Defender portal is a combined web-based interface that contains the various solutions in the Microsoft Defender security stack. This is where most security operations teams will spend their time investigating and monitoring threats that affect your endpoints across the application, identity, endpoint, and data domains. Using the available dashboards and built-in incident management system, the SOC can analyze threats, respond to security-related incidents, and perform real-time remediations. From the Overview page, they can quickly jump between domains, depending on where their investigations take them, making it easier to follow the threat should it perambulate across different domains. A few examples of the actions a SOC analyst can take in the M365 Defender portal include the following:
- Configure threat policies through Email & collaboration that control the actions to protect users from phishing, spam, and malware delivered through email.
- Configure rules for protecting the collaboration stack by configuring allow/block lists, filtering and quarantine policies, and configuring DomainKeys Identified Mail (DKIM) signatures.
- Use Advanced Hunting to build queries to find threats across all domains and create custom detection rules.
- Quarantine emails by deleting them or moving them to junk.
- View reports and service health.
- Review audit logs across all of Office 365.
Using Permissions & roles, located on the M365 Defender portal home page, security team members can be granted access to security-specific roles across Azure AD and MDE, and for tasks in the Security & Compliance center.
Next, let's look at how to configure role-based access in MDE using the portal.
Role-based access control in MDE
Access to MDE is locked down by design due to the sensitivity of the information that's available. Access can be managed using Role-Based Access Control (RBAC) and by assigning the appropriate roles in Azure AD. To provision basic access, the following Azure AD roles can be assigned directly to users:
- Security Administrator allows full access to the portal, including all system information, alerts, and administrative functions.
- Security Reader allows read-only access to log in and view all alerts and other information. You will not be able to perform administrative functions.
Fine-grained permissions can be assigned based on the SOC team member's job role, using the M365 Defender portal. For example, the security monitoring team may only need a Security Reader role for MDE data, while a level 2 team might need access to resolve actionable remediation recommendations. Neither role should have rights to change the security settings of your tenant or enable advanced features that the permissions of the Security Administrator Azure AD role grants.
To create a new role from the M365 Defender portal, go to Permissions & roles and choose Roles under Endpoint roles & groups. Click on + Add item to create a new role. The following screenshot provides an example of the permissions a level 2 SOC analyst can be assigned.
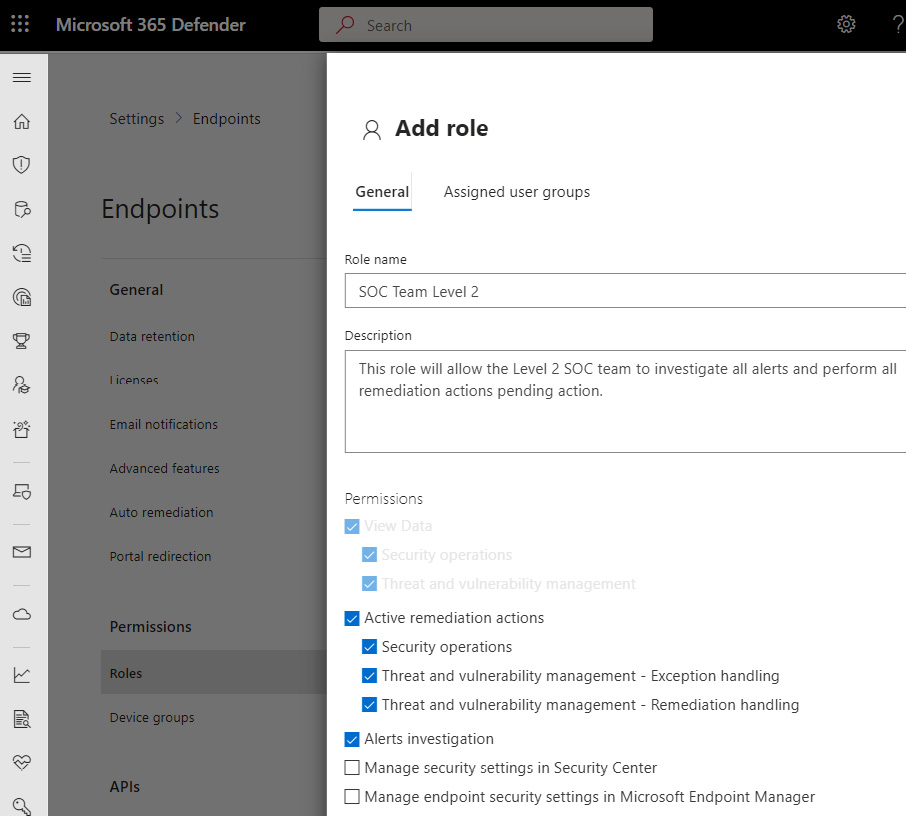
Figure 14.5 – Creating a role in MDE
This role will allow the analyst access to almost all features in MDE, except to manage the security settings in the Security & Compliance center and MEM.
Hovering your mouse over each of the permission settings will provide additional details about each setting. After the permissions have been selected, click on Assigned user groups to add an Azure AD security group for assignment. More information about managing portal access using RBAC can be found at https://docs.microsoft.com/en-us/microsoft-365/security/defender-endpoint/rbac?view=o365-worldwide.
Next, let's look at organizing devices using device groups and tags. Access can be further restricted to administrators based on these groups.
Creating device groups and tags
Creating device groups and tags can help organize endpoints and provide separation over their management if necessary. Using device groups allows you to configure different levels of automation for remediation actions from the Action center and automated investigations. For example, device groups can be created to separate servers from user workstations, or if the endpoints are in different geographic regions and managed by different security teams. User access to manage a device group is assigned using Azure AD security groups after they have been assigned to a role in MDE. To create a device group in the M365 Defender portal, go to Permissions & roles, choose Device groups under Endpoint roles & groups, and click Add device group. In the following screenshot, the Device group name, Automation level, and Description fields have been completed in the General tab.

Figure 14.6 – Add device group
After filling out the required criteria, click on the Devices tab to specify the conditions to create a matching rule that determines which devices become members of the group. The following conditions are currently available for use:
- Name
- Domain
- Tag
- OS
In the example from the preceding screenshot, selecting Windows 11 and Windows 10 in the OS condition will select all Windows client workstations. You can see how to create a matching rule in the following screenshot.

Figure 14.7 – Create a matching rule
Use the Preview devices feature to show up to 10 devices that match the conditions specified in the rule to validate that they are working as expected. If the available conditions don't provide enough flexibility, a tag can be used to help provide additional identification criteria. Device tags can be created using the portal or by setting a registry key value on your endpoints at the following location:
HKEY_LOCAL_MACHINESOFTWAREPoliciesMicrosoftWindows Advanced Threat ProtectionDeviceTagging
Then, set the following information to implement a custom device tag.
- Registry key value (REG_SZ): Group
- Registry data: Name of tag
Tip
There may be a delay before a tag shows up on a device in the portal after configuring the registry on the endpoint.
Registry keys can be deployed through Group Policy, MEM, or any other MDM method. More information about creating device groups and managing tags can be found at https://docs.microsoft.com/en-us/microsoft-365/security/defender-endpoint/machine-groups?view=o365-worldwide.
Finally, click on the User access tab and select the Azure AD groups to grant access to the endpoints, and click Done to finish creating the device group. Now that permissions have been assigned to the SOC team and devices are organized by group, let's look at reviewing incidents and alerts from the M365 Defender portal.
Reviewing incidents and alerts
Located on the home page of the M365 Defender portal navigation menu are links to the Incidents & Alerts queues. Incidents and alerts contain events from across the entire Microsoft security stack, where they can be viewed, filtered, and managed directly in the M365 Defender portal. Incidents differ from alerts, as they contain a collection of alerts correlated together across different domains or multiple endpoints. The alerts contain individual events of suspicious or malicious activity and help add context to the attack chain. They can be used to determine where and when the attack started, build a timeline of events, and add additional details about the processes used in an attack. Using the incidents and alerts queue, the SOC can build an incident response workflow that follows the example steps outlined as follows using the M365 Defender portal:
- Review and manage incidents and alerts that are created in the M365 Defender portal.
- Review the correlated alerts to analyze the attack and understand the impact, the total affected devices, the MITRE ATT&CK tactics used, and remediation recommendations.
- Contain the attack using the mitigation features available from the M365 portal. For example, devices onboarded to MDE can have threats auto-remediated through behavioral blocking and containment features. Examples of these features include enabling ASR rules or enabling EDR in block mode. Additional actions can be taken directly on individual devices, such as isolating the device from the network, restricting app execution, running an antivirus scan, and collecting an investigation package to review the malicious artifacts, such as a file.
- Remove all artifacts related to the attack across the various domains protected in the security stack. Examples would be to quarantine emails associated with a phishing attempt or delete malicious files stored locally on computers or uploaded to OneDrive and SharePoint.
- Resolve the incident and close any relevant alerts. An RCA should be created for teams to review and identify security gaps through controls, processes, and misconfigurations. Any indicators of compromise should be added to blocklists, and custom detection rules can be created based on any artifact findings using advanced hunting.
Tip
Using the Machine Risk Score in a compliance policy can help prevent access to cloud apps connected to Azure AD during the investigation.
Let's review investigating an alert in more detail using the M365 Defender portal.
Reviewing an alert
The alerts queue lists events from the entire Microsoft Defender suite and are stored for up to 6 months. Using the filter, alerts can be sorted by severity, status, category, service source, tags, and policies. The following screenshot shows an example of the alerts queue in the M365 Defender portal, filtered to all sources from the MDE service source.

Figure 14.8 – The Alerts queue
The Status column indicates whether the alert is New, under investigation by an analyst (In progress), or Resolved. The Category column maps the detection to the MITRE ATT&CK Framework enterprise tactic definitions. The Detection source column shows which feature of MDE was responsible for the detection.
Clicking on the alert name will open the Alert details page and provide information about the alert story, attack timeline, impacted assets and users, and any linked incidents. The available actions include options to assign the alert to an analyst, review the alert timeline details, create a suppression rule for false positives, and consult a Microsoft threat expert if your company is licensed for the service.
Microsoft relies on the MITRE enterprise framework to categorize the attack tactics and will return the techniques used in the alert card if they match a known and documented technique. The following screenshot shows the alert details page about a potential Ransomware attack.

Figure 14.9 – The Alert details pane
From the alert page, the process tree is shown in the alert story and lists all the process IDs that can be corroborated, up to the execution of the malicious file and detection by the detection source, Defender Antivirus.

Figure 14.10 – The MDE alert story
In the preceding screenshot, the ransomware_testfile_unsigned.exe process was responsible for creating child processes (msedge.exe and wscript.exe) that executed the associated command-line arguments. Clicking the filename from the alert story will open the File summary pane that provides additional context about the executable for further research. This includes the process name, file path, command-line arguments, and a reference to a VirusTotal detection ratio. Mitigation actions can be taken on the file, such as adding the filename or hash value to the IOC list, downloading the file for detonation in a sandbox, Stop and Quarantine File actions using Defender Antivirus, submission to Microsoft for deep analysis, starting a consultation with a threat expert, and a link to Advanced Hunting.
Click Open file page to view the full-page detailed summary. In the Overview tab of the detailed summary, you can see the file prevalence within your organization to help detect and prevent the further spread of the malicious file. Luckily, in the following screenshot, the file has been contained, as it has not been detected in any email inboxes or other devices.
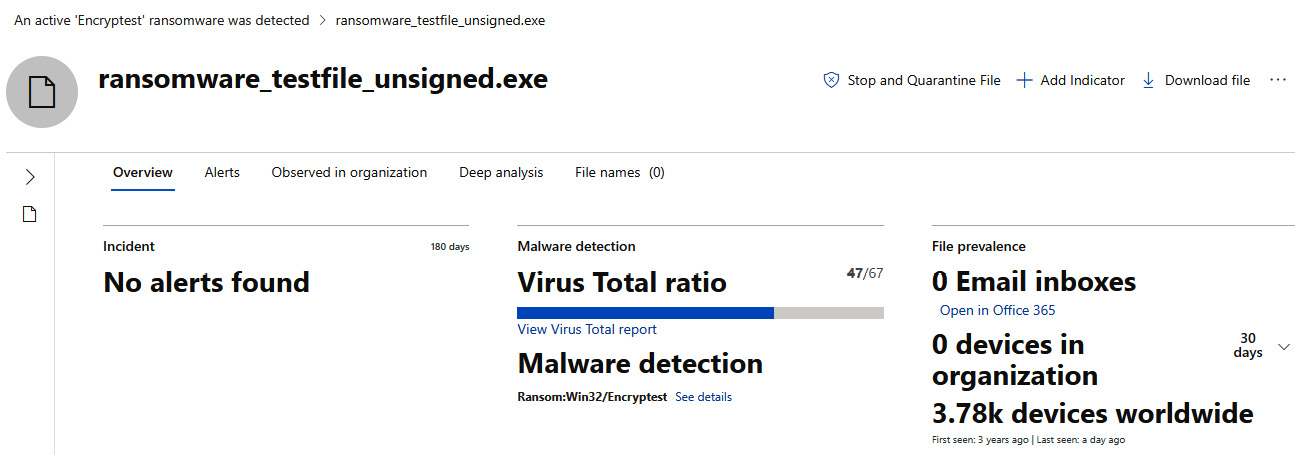
Figure 14.11 – The file summary page
To dig deeper into the alert and view the timeline of events leading up to the Defender Antivirus detection source, go back to the Alert details pane and click on See in timeline.
Next, let's review the incidents queue. Incidents correlate multiple alerts together to help add context to a potential threat and quickly identify whether multiple endpoints are involved.
Reviewing the incidents queue
The Incidents queue can be found under Incidents & alerts in the M365 Defender portal. Incidents help to correlate individual alerts from across multiple M365 services together to quickly gain insights about the entire scope of the attack chain. This helps build a timeline of events and answer questions such as where and how an attack originated and how many assets are impacted. Incidents include details such as severity, the number of associated active alerts, the service and detection source, the number of impacted assets, and an assigned category based on the MITRE ATT&CK enterprise tactic.
The SOC can incorporate the incidents queue into an Information Technology Service Management (ITSM)-style workflow by assigning incidents directly to an analyst, changing the status of the incident, applying a classification, and adding comments. The following screenshot shows the incident queue in the M365 Defender portal. It has been filtered for resolved incidents over the past 6 months with MDE as the service source.

Figure 14.12 – The Incidents queue in M365 Defender
Selecting an incident will open the incident Summary page to further analyze the artifacts that comprise each incident. Tabs include viewing the associated alerts, devices, users, mailboxes, apps, investigations, and evidence, and a graphical view to help understand the attack from a visual perspective. The following screenshot shows the detailed summary page of an incident. You can see there are three active alerts that are bundled into the incident.

Figure 14.13 – Incident summary
Clicking the Graph tab will visually show how the attack played out. Clicking on each artifact will pull up additional information about the machine, file, or process identified. The graph view is seen in the following screenshot.

Figure 14.14 – The Graph view of the alert story
Additional information about managing incidents in the M365 Defender portal can be found at https://docs.microsoft.com/en-us/microsoft-365/security/defender/manage-incidents?view=o365-worldwide.
The Incident & Alerts queue can get noisy and make it difficult for the SOC to keep up with the entries. To help with this, Microsoft Defender has a feature known as Automated Investigations to automatically investigate and resolve known threats.
Automated investigations
Automated investigation and response (AIR) in MDE is a feature that can help automatically resolve alerts and take immediate action on threats to reduce the alert volume. An automated investigation is triggered by an initial alert where analysis then begins using a series of algorithms known as security playbooks. Once the investigation begins, an investigation ID is assigned and listed in the Action center. Depending on the auto-remediation level configured for device groups, items are tracked as completed or listed as pending review. The available automation types that can be assigned to device groups include the following:
- Full automation (recommended) allows for remediation actions to happen automatically.
- Semi-automation includes three different levels and can take some immediate action on core system directories or temporary and download folders, but other actions require approval by a team member.
- No automation (not recommended) means automated investigations do not run.
Tip
In the Creating Device Groups and Tags section, you can select the automation level when creating the device group.
The Action Center page lists all automated investigations across M365 security services and is not just limited to MDE. The analyst can see detailed information such as the action type, affected asset, entity type, action source, and status. In the following screenshot, the 1784 investigation ID was automatically remediated by automation.
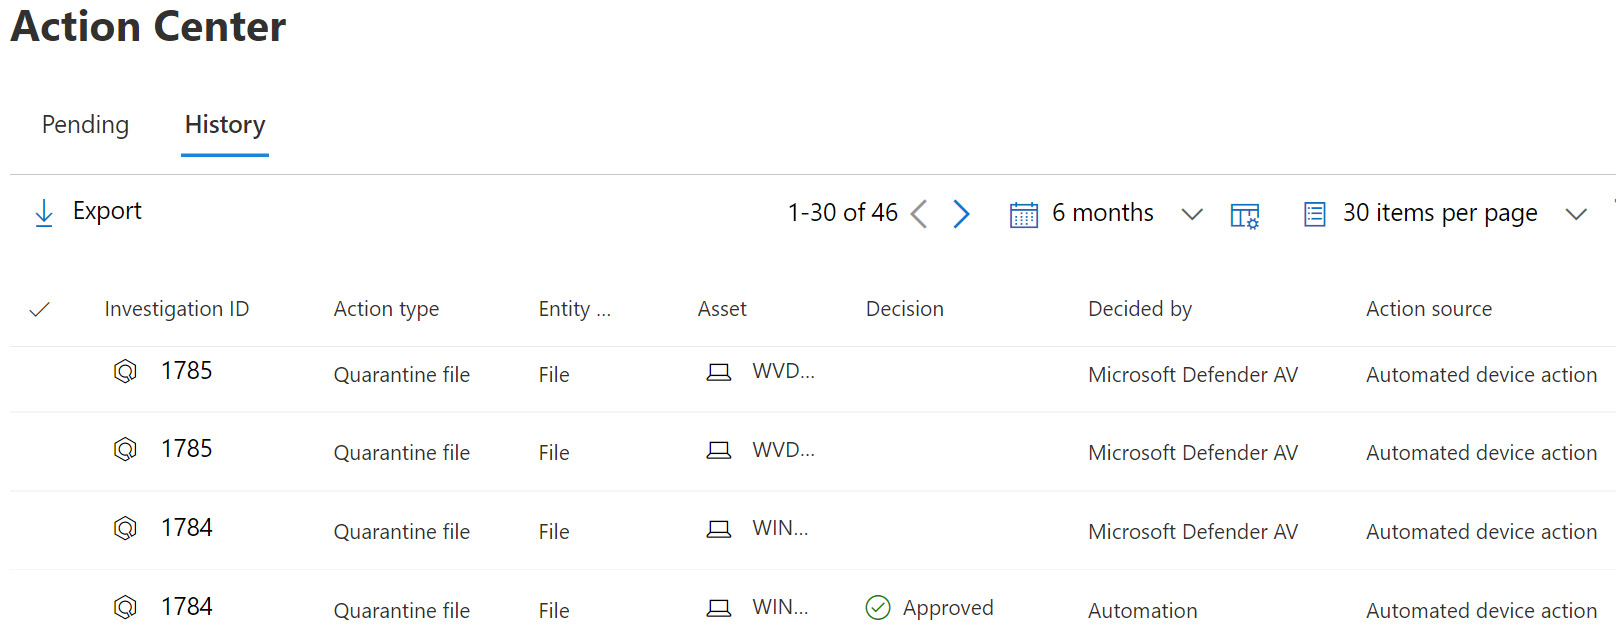
Figure 14.15 – Action Center for automated investigations
During an open investigation in a pending status, any additional alerts generated from the compromised device or correlated across other workstations will automatically be grouped under the same investigation ID. Selecting the investigation ID will open a detailed investigation summary of the AIR process, as shown in the following screenshot:
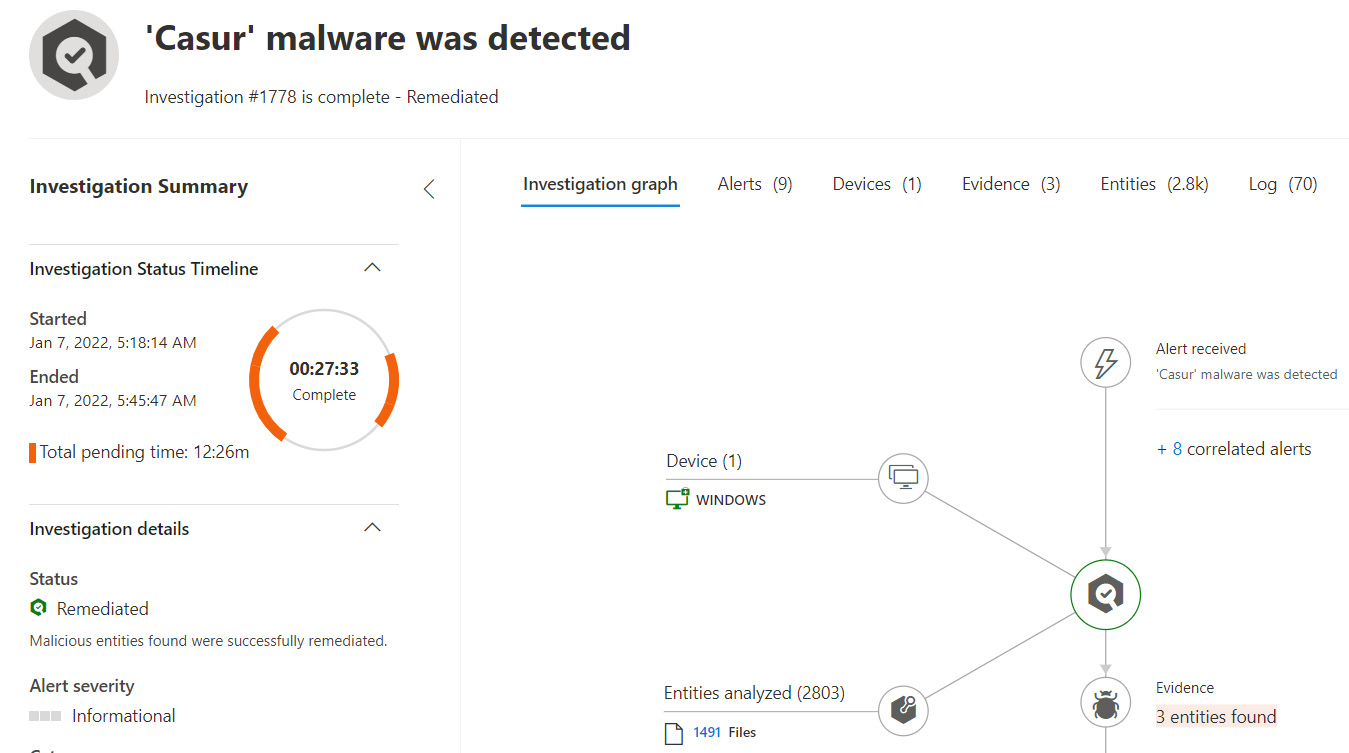
Figure 14.16 – Automated investigation summary
By setting the auto-remediation level to full, automated investigations can significantly cut down on alert fatigue and allow the SOC to focus on more valuable activities, such as complex investigations that require human intuition and deep analysis. To help assist with the investigation process and perform complex search queries, the SOC team can use the Advanced Hunting feature in M365 Defender. Let's review how advanced hunting can query for log events and build custom detection rules.
Using advanced hunting
Advanced Hunting in M365 Defender allows security teams to proactively hunt for threats across all the raw data that is collected by the connected M365 services. To search through the logs, the Kusto Query Language (KQL) is used to build queries and correlate data across the tables and columns. To access Advanced Hunting, choose Hunting | Advanced Hunting from the M365 Defender portal. The landing page includes a collapsible sidebar to view the schema, custom functions, saved queries, and detection rules. The query editor supports multi-tab editing and includes a list of basic queries to help get started using KQL. Clicking on the Queries tab in the schema sidebar, you can view predefined queries shared across the GitHub community and ones shared internally created by security teams. In the following screenshot, a KQL query was run to look for network logons that used local accounts. The summary results include RemoteIP, LogonType, AccountName, and LogonAttempts details.
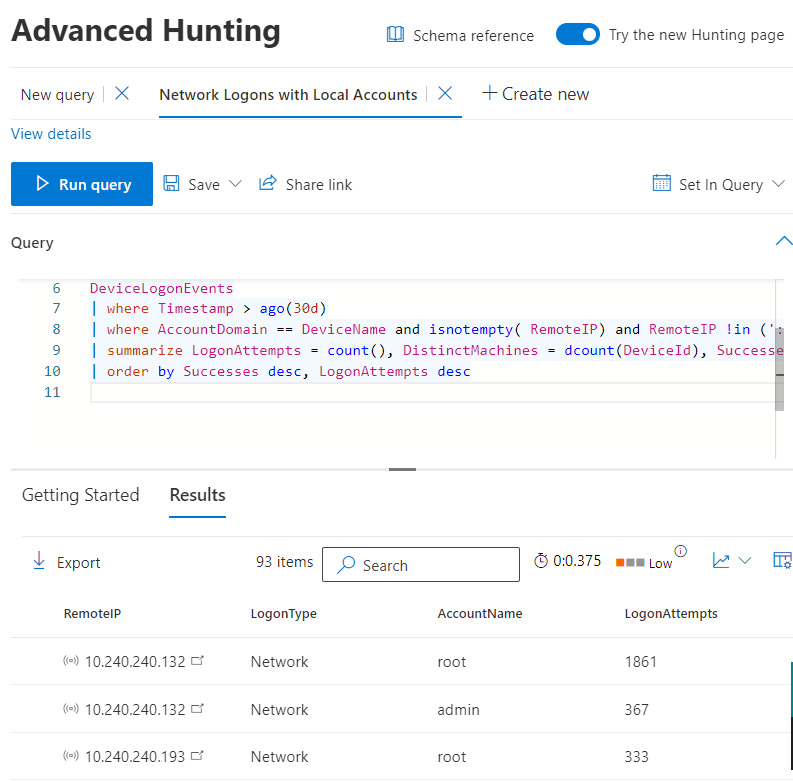
Figure 14.17 – An Advanced Hunting query
Clicking a result from the RemoteIP column will open a side pane to inspect the record further, where you can add additional filters to fine-tune the results. Some records will also have links to a summary page such as the preceding example for the RemoteIP address. The summary can further analyze the artifact to correlate any known alerts and where it has been observed in the organization. To help search for additional artifacts from alerts, Advanced Hunting can also be opened with a preconfigured query by choosing the Go hunt button when investigating an alert story.
Advanced hunting is also a great way to filter for events that are not normally presented as an alert or incident but may indicate suspicious activity. Using custom queries, detection rules can be created that search for events on a schedule, can generate alerts, and take remediation actions on devices, adding great flexibility for the SOC to automate their workflows. Let's look at building a custom detection rule from advanced hunting.
Creating a custom detection rule
Custom detection rules in advanced hunting help proactively monitor an environment by looking for security events or flagging system misconfigurations and unhealthy endpoints. Detection rules are configured to run on a schedule, trigger alerts based on any findings, and take action on users, devices, or files. The alert details can be configured with a severity rating, attack category, description, recommended actions, and the ability to link to a threat analytics report or MITRE ATT&CK technique. Available actions include isolating a device, running an antivirus scan, restricting app execution, quarantining files, marking a user as high risk, collecting an investigation package for analysis, or opening an automated investigation. A custom detection rule is created directly from the query editor of Advanced Hunting. In the following screenshot, the Create detection rule button is shown, which opens the custom detection menu with available options for configuring the rule.
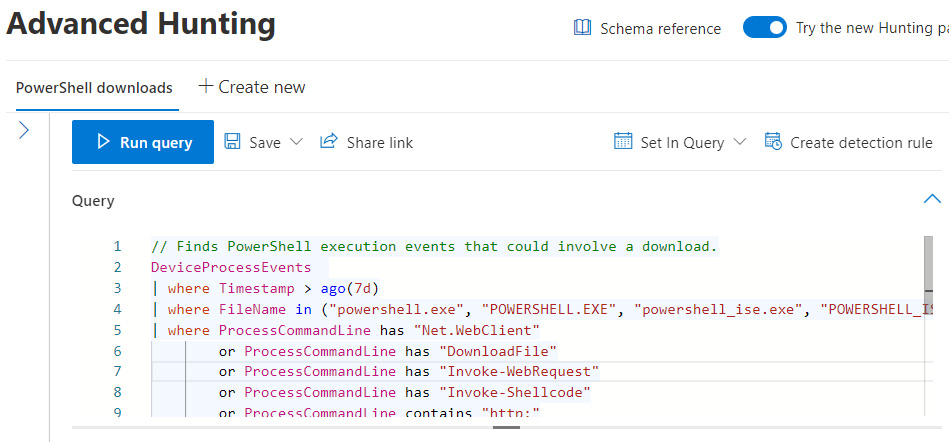
Figure 14.18 – Create detection rule
There are a mandatory set of columns that need to be returned from the query results; otherwise, the Create detection rule option will not be available. The list of available detection rules can be viewed from the M365 Defender portal by choosing Hunting | Custom detection rules. Select a rule to open the Detection rules page to review the run history, associated alerts, and trigger the rule to run immediately. An example of the available custom detection rules can be seen in the following screenshot of the M365 Defender portal.
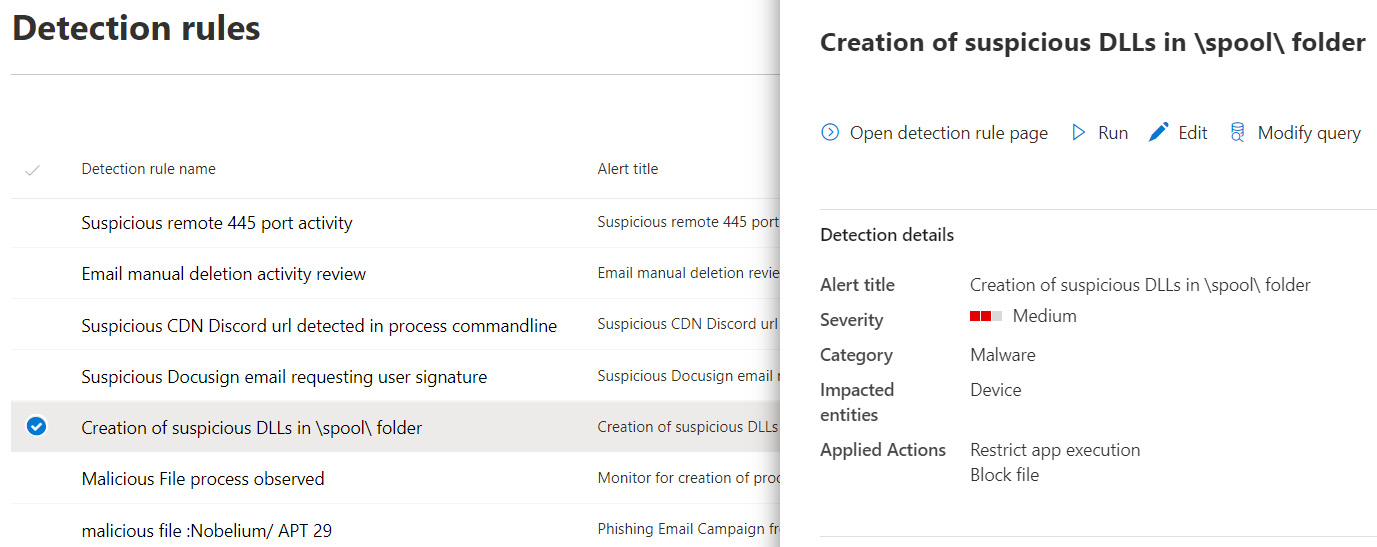
Figure 14.19 – Custom detection rules
Now that we have reviewed how to use advanced hunting to search for events and build custom detection rules, let's look at how the SOC can track open vulnerabilities using a remediation request.
Tracking remediation requests
Remediation requests can be used to track the remediation efforts of identified vulnerabilities and security recommendations in MDE. Active requests are tracked by the remediation type, the related components (such as a vulnerable software title), and priority. The overall progress of the request is tracked based on the number of impacted assets and is completed once all devices are remediated. To view the active remediation requests from the M365 Defender portal, expand Vulnerability management under Endpoints and choose Remediation. The following screenshot shows a remediation request, tracking devices vulnerable to the Log4j exploit.

Figure 14.20 – Remediation requests in M365 Defender
In the preceding screenshot, there are nine identified devices in the Device remediation progress field. The request is complete once all nine devices have been remediated.
New requests can be created by reviewing the available security recommendations in Vulnerability management. To do this, select a recommendation to open the details flyout pane and click Request remediation, as shown in the following screenshot.
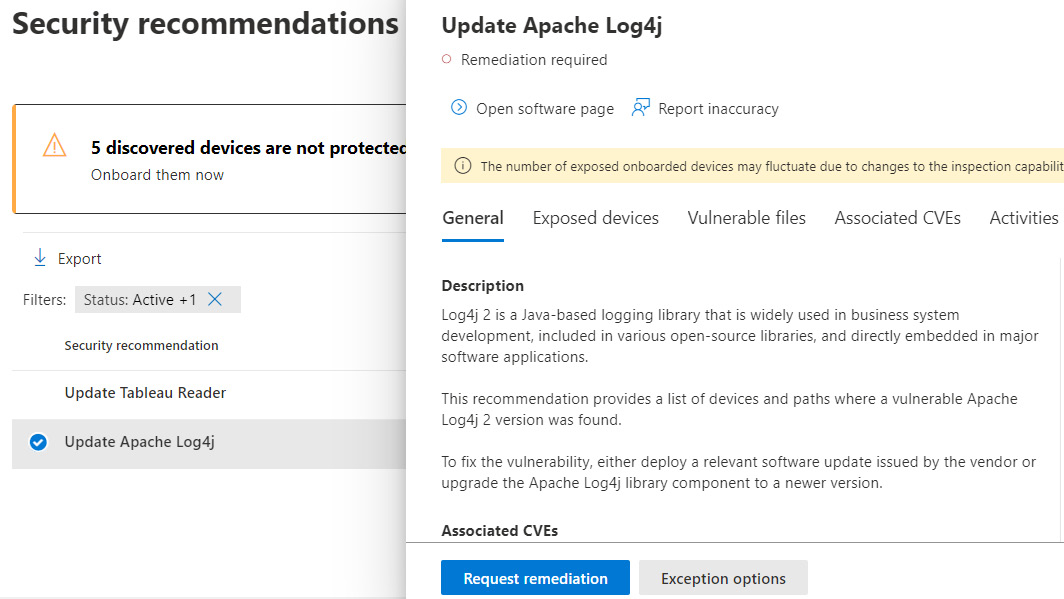
Figure 14.21 – Request remediation
There is also an option to open Exemption options to remove the vulnerability from showing as active in the reporting. To use remediation requests, the Microsoft Intune connection must be enabled from MDE and MEM. We covered how to enable this in Chapter 13, Security Monitoring and Reporting, in the Onboarding Windows clients to MDE section.
Whether you're supplementing an existing IT service management solution, tracking vulnerabilities and weaknesses, or taking advantage of Microsoft's full XDR capabilities, the SOC will gain valuable insights by incorporating MDE into their workflows.
Next, let's look at using Microsoft Defender for Cloud to assess threats and track vulnerabilities for resources running in the cloud and on-premises.
Investigating threats with Defender for Cloud
In Chapter 13, Security Monitoring and Reporting, we enabled and configured the enhanced security features of Defender for Cloud to gain the benefits of all available advanced features. This included just-in-time VM access, regulatory compliance dashboard and reports, adaptive application controls, EDR for servers, and threat protection for PaaS services. With the enhanced security features enabled, you can investigate threats in Defender for Cloud by following these steps:
- Sign into the Azure portal at https://portal.azure.com.
- Search for Microsoft Defender for Cloud and open it.
- Click on Security Alerts within the General section.
- Here, you can view active alerts and the associated affected resources. Select one of the alerts to review additional information in the window that appears on the right, as shown in the following screenshot.

Figure 14.22 – Defender for Cloud high severity alert
- To further investigate an alert, click on View full details. Clicking on the Take action tab will show any recommended mitigation steps, as shown in the following screenshot.
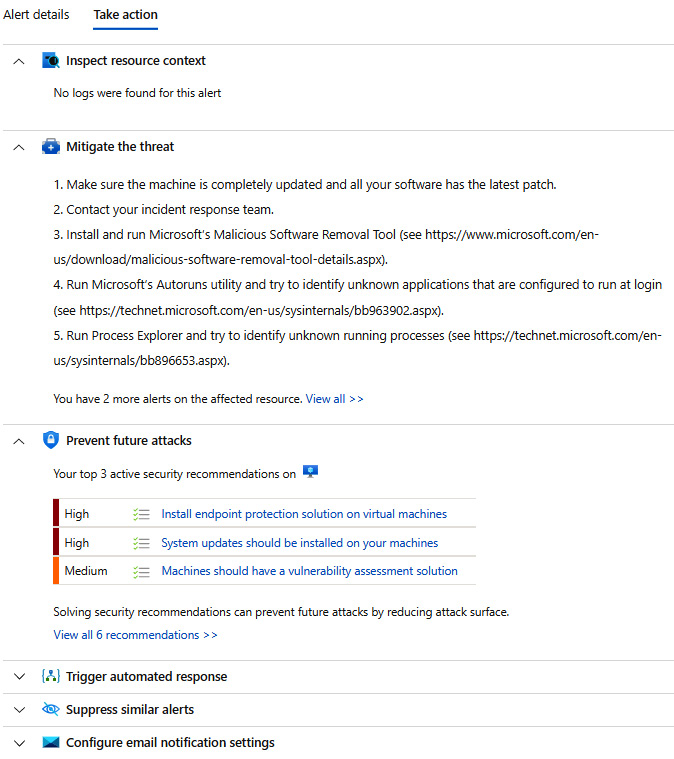
Figure 14.23 – Defender for Cloud mitigation actions
Defender for Cloud alerts can be sent to the SOC via email notifications by clicking on Environment Settings in the left-side navigation panel. Choose your subscription name (you may need to expand the menus), click on Email notifications, and then enter the email recipients to receive high-severity alerts. You can also use the Workflow automation section to configure automation using Logic Apps by setting conditions that are available through alerts. Finally, the Continuous export section allows you to export Defender for Cloud log data to external targets, including integration with a SIEM.
An added benefit that provides visual insight into your active alerts is the security alert map. To access the map, browse to Security alerts, and then click on Security alerts map in the top menu. The alerts map will look similar to the following screenshot for any open active alerts in your subscription.
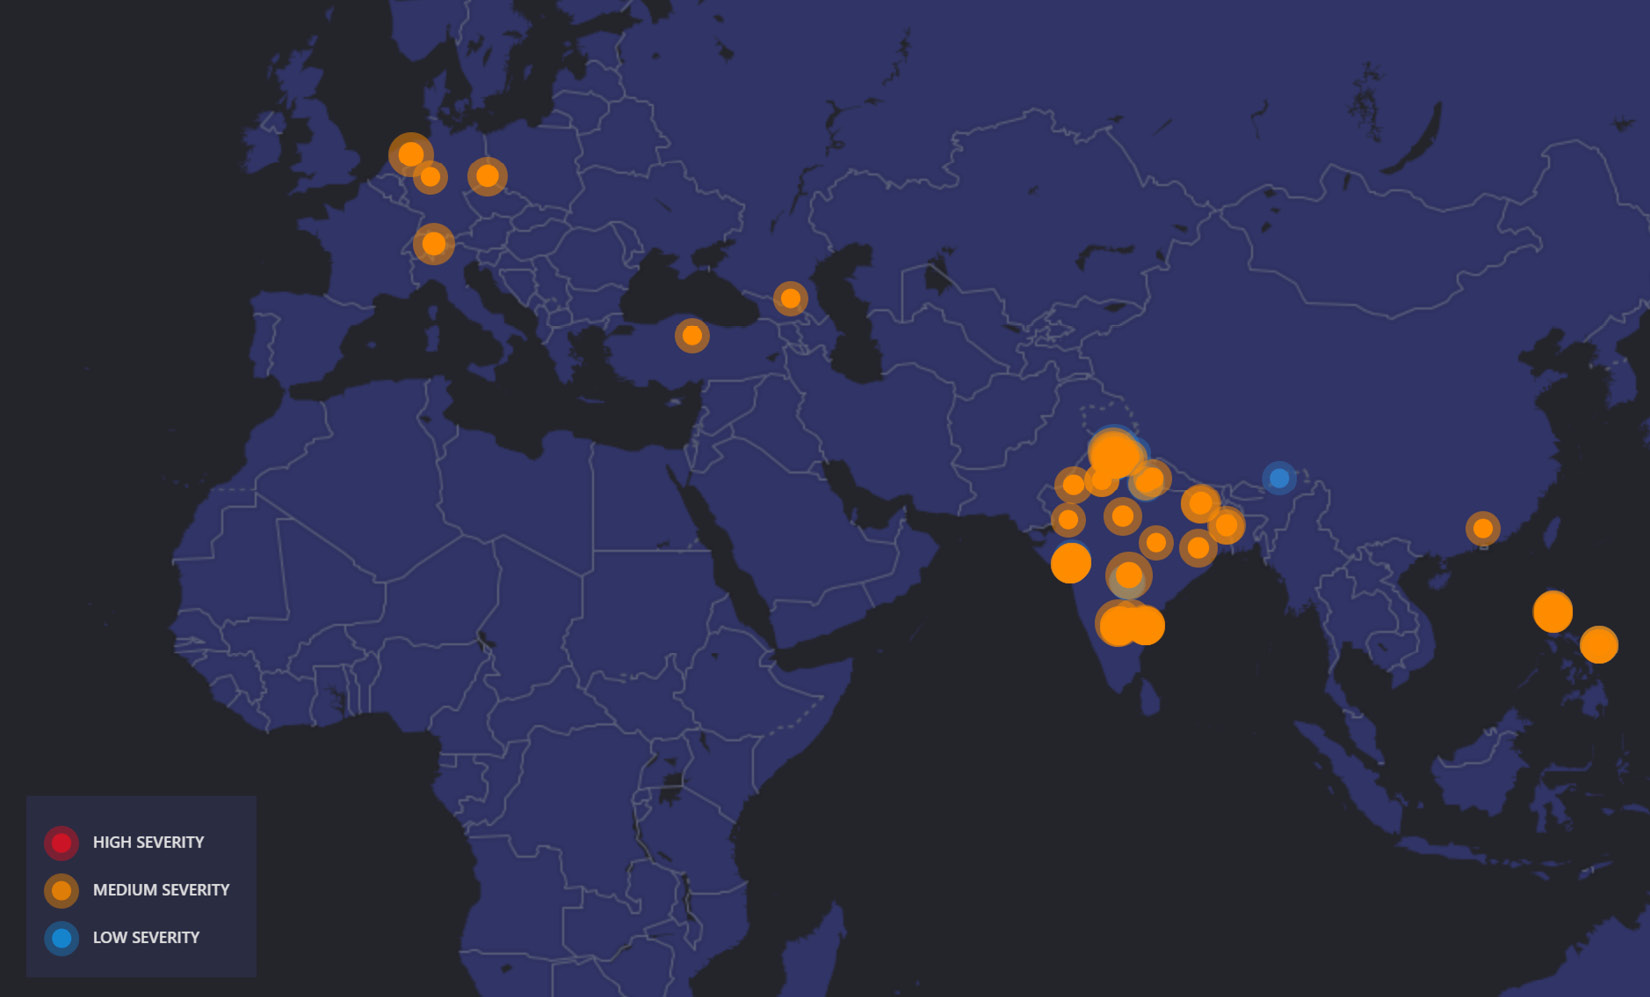
Figure 12.24 – The Microsoft Defender for Cloud security alert map
Within the map, you can click on the circles to view details about the alerts. In addition to managing alerts, Defender for Cloud is a great way to track vulnerabilities that have been identified on your cloud resources. The SOC can incorporate recommendations into their workflows and follow up with the appropriate app owners to close open security vulnerabilities and reduce the attack surface. Recommendations can be tracked directly in the Azure portal or exported to CSV.
In the next section, we will provide an overview of Microsoft's cloud-built SIEM service, Microsoft Sentinel.
Enabling Azure-native SIEM with Microsoft Sentinel
Microsoft Sentinel is a modernized SIEM and SOAR that is built on Microsoft Cloud technology. Microsoft Sentinel is a centralized SIEM solution that provides an intelligent robust life cycle to allow the collection of data, detection of threats, investigation of threats, and responses to incidents. Because Azure Sentinel is cloud-built in Azure, the ease of setup and integration makes the service extremely attractive to existing Microsoft customers that use Azure to host their cloud resources. The setup is simplified compared to a third-party SIEM, which typically requires additional infrastructure and storage to support log collection and analyze data. Let's look at how to connect data sources in Azure to Microsoft Sentinel.
Creating the connection
To set up Microsoft Sentinel within Azure, follow these steps:
- Sign into the Azure portal at https://portal.azure.com.
- Search for Microsoft Sentinel and open it.
- Click on Create Microsoft Sentinel on the main screen.
- Select a workspace to connect to, and then click on Add. (If no workspaces exist, click on Create a new workspace to build a new Log Analytics workspace.)
- It will take a few minutes to create, and then you will be redirected to the Microsoft Sentinel console, which will look like the following screenshot.
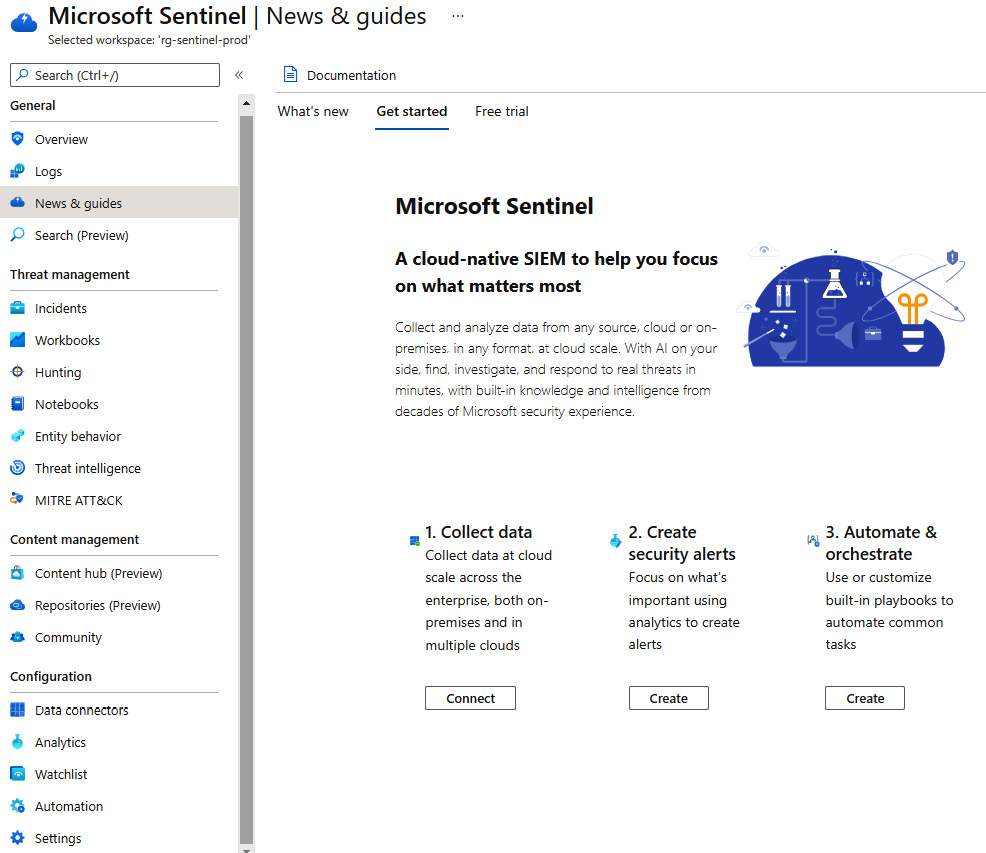
Figure 14.25 – The Microsoft Sentinel console
Note that the cloud-native SIEM was deployed within minutes. This is a great example of the power of cloud technology and the benefits it has for security. After the Microsoft Sentinel platform is set up and ready to use, you will first need to set up your data sources and begin collecting data. This can be completed by following these steps:
- Ensure Microsoft Sentinel is open.
- Click on Data Connectors within Configuration.
- Within Connector name, select the connector you would like to connect, and then click on Open connector page. As an example, search for Microsoft Defender for Cloud and select the connector, and then click on Open connector page.
- Follow the instructions to set up the connector. For Microsoft Defender, click on Enable Microsoft Defender for all subscriptions or select the individual subscriptions, click Connect, and then click OK to complete the connection.
- Click Enable under Create incidents if you would like to allow the automatic creation of incidents.
- Click on Next steps to review any recommended workbooks, query samples, or relevant analytic templates.
- Once configured, you have just successfully set up a connector to collect logs within Microsoft Sentinel. The following screenshot shows Microsoft Defender for Cloud has been connected.
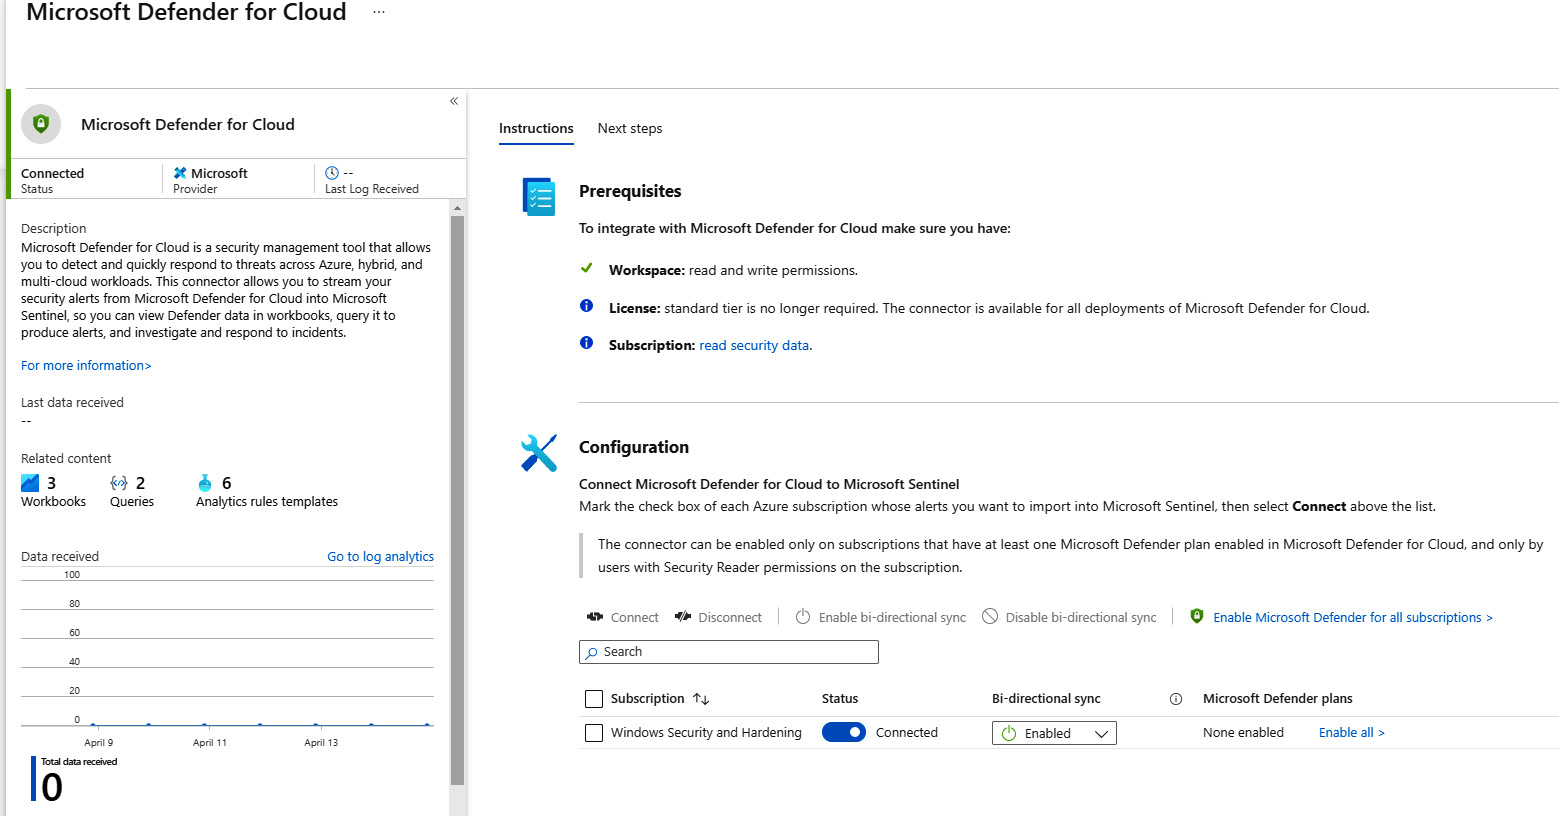
Figure 14.26 – The Microsoft Defender for Cloud connector
You can go back to set up any other relevant connectors for your environment. Additional connectors that provide insight specifically for users and Windows systems include Windows security events, Azure AD Identity Protection, Azure AD, Microsoft Defender for Office 365, and Office 365.
Tip:
You can view the latest pricing for Microsoft Sentinel at https://azure.microsoft.com/en-us/pricing/details/microsoft-sentinel/.
After your data sources have been connected, you can get a high-level overview of your environment by accessing the Overview menu item within the left-side navigation pane. The following screenshot shows the Events and alerts over time details, including a Potential malicious events graphical map.
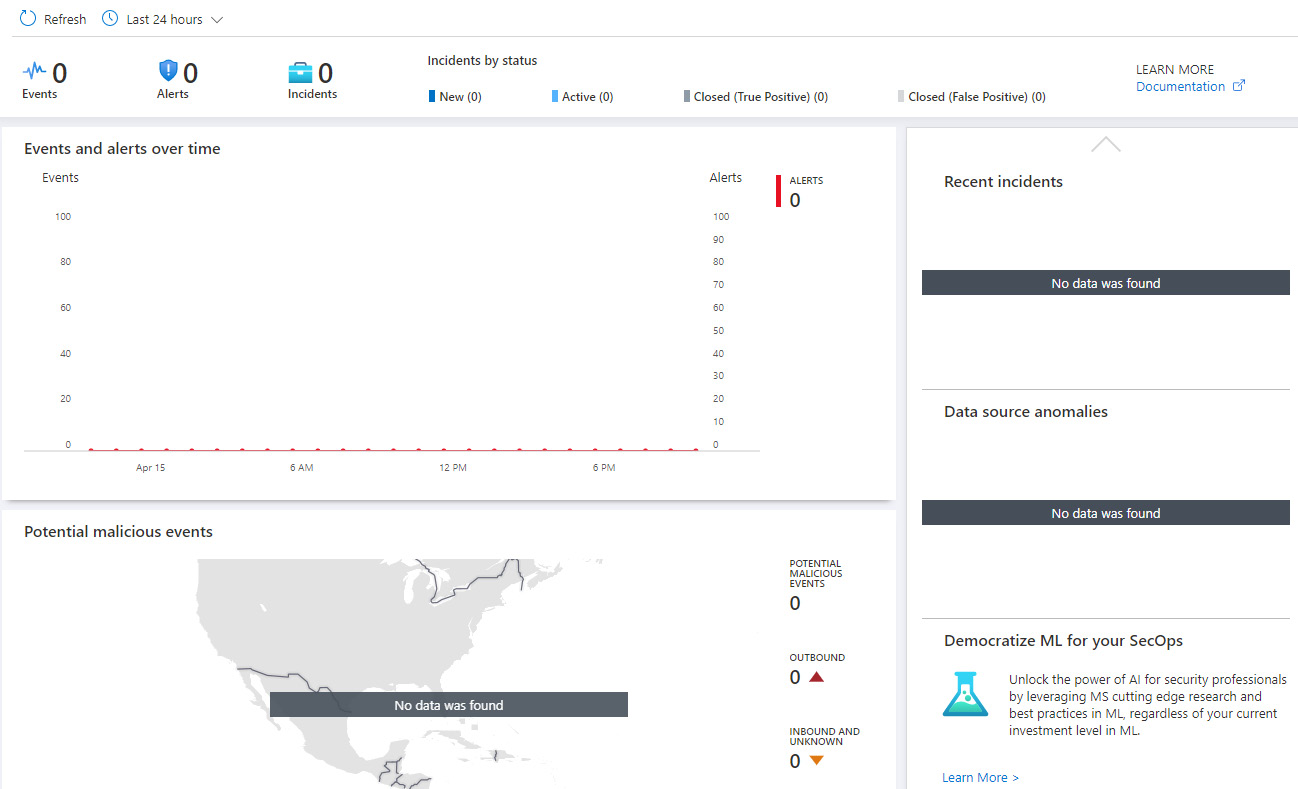
Figure 14.27 – A Microsoft Sentinel overview
To get the most out of your Sentinel deployment, you will want to view your logs via Workbooks, create threat detection rules within Analytics, and orchestrate response to incidents by building automations. There is a lot to learn with Microsoft Sentinel, so whether you're designing the company's fist SIEM or supplementing existing services, visit the Microsoft Sentinel documentation library to learn more: https://docs.microsoft.com/en-us/azure/sentinel/.
In the next section, we will review MDCA to provide better visibility and protection for your SaaS applications.
Protecting apps with MDCA
MDCA is a Cloud Access Security Broker (CASB) that can identify, protect, and govern SaaS applications by providing visibility through identity-based analysis and traffic patterns from managed endpoints, and with API integration with SaaS providers. A CASB helps to provide visibility into shadow IT processes using its discovery mechanisms, which is traditionally a challenge for many organizations without a CASB solution in place. A benefit of using MDCA as your CASB is the native connectivity available for those heavily invested in Microsoft technologies. It also integrates easily with other cloud providers (AWS and Google), allowing for visibility into all combined cloud environments from a single console.
Planning for the implementation of MDCA can be divided into a few high-level steps. If your organization contains many apps, users, and devices, there can be a substantial amount of discovery data to review, and plan for a significant investment of time to fully configure all the advanced policies and governance controls the CASB offers. It is recommended to plan for a phased approach by following these steps:
- Connect your application sources to identify and discover apps.
- Review the discovery data.
- Configure policies and alerts.
- Set up governance and security controls.
To view the MDCA portal, go to https://portal.cloudappsecurity.com. First, let's review the methods for connecting applications to MDCA and the available connectors to solutions in the Microsoft security stack.
Connecting apps to MDCA
There are three primary methods to connect apps, users, and data to MDCA, as follows.
- Native integrations into M365 products that include MDE, MDI, Azure AD Identity Protection, Microsoft Purview Information Protection, and Microsoft Online Services (Office 365 and Azure AD).
- API connections to SaaS and cloud providers. Some examples include Amazon Web Services, Google Cloud Platform, Okta, Salesforce, ServiceNow, and Box.
- Azure AD Conditional Access App Control for apps using Azure AD or other non-Microsoft identity providers, using a reverse-proxy architecture.
Native integrations offer the most support regarding the available security features and protection capabilities for connected applications. As outlined previously, these are the native Microsoft solutions, and it's advantageous to adopt MDCA as a CASB if you're using multiple products in the Microsoft security stack.
API connections offer the next best option for connecting apps. This allows MDCA to be wired through exposed API endpoints from other third parties and enables enhanced governance controls for services not native to Microsoft. The features will vary by vendor, but you can visit the following link to learn about the capabilities available for the current supported connectors:
Azure AD Conditional Access typically provides the least amount of flexibility regarding protection capabilities but allows you to monitor and control user sessions by inspecting traffic and funneling session data through the MDCA reverse proxy. Some of the protection capabilities include controlling uploads and downloads of sensitive data, blocking user access to connected apps, and protection from malware through inspection. To learn more about the protection capabilities using Azure AD Conditional Access, visit https://docs.microsoft.com/en-us/defender-cloud-apps/proxy-intro-aad.
To add a connected app using native integration such as Office 365 or Microsoft Azure, follow these steps:
- Sign in to http://portal.cloudappsecurity.com/.
- Click the settings icon on the top-right toolbar and choose App connectors under SOURCES.
- Choose + Connect an app to open the dropdown and select any of the native integrations available for MDCA. A preview of the available connectors can be seen in the following screenshot.

Figure 14.28 – Connecting apps in MDCA
To connect another cloud provider, click on the Security configuration apps tab, as shown in the preceding screenshot. For applications that are configured using Azure as the identity provider, you can easily add them by using session control settings in a conditional access policy, as shown in the following screenshot.

Figure 14.29 – Onboarding apps into MDCA using conditional access
For additional information about deploying conditional access app control, visit https://docs.microsoft.com/en-us/defender-cloud-apps/proxy-deployment-aad.
Integration with MDE can be configured from the M365 Defender portal by going to https://security.microsoft.com, choosing Settings, selecting Endpoints, choosing Advanced features, and turning on Microsoft Defender for Cloud Apps.
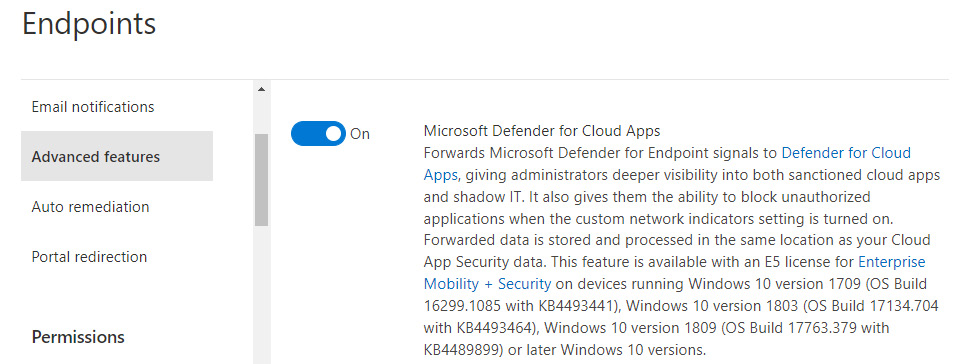
Figure 14.30 – Enable MDCA connector
Next, let's look at how MDCA can discover apps and shadow IT by analyzing traffic logs from your connected sources.
Discovery
A main advantage of using a CASB solution is the ability to discover cloud application usage and shadow IT processes. MDCA primarily handles discovery using data from log snapshots, continuous reports from firewalls and endpoints, or through the Cloud Discovery API. An example of discovery sources that are used for continuous report evaluation include MDE, log collection using syslog or FTP, or using a secure web gateway through select vendors. Discovery data is analyzed up to four times a day from logs fed into the MDCA portal, where they are parsed and analyzed against a catalog of over 25,000 known cloud apps.
For additional information about cloud discovery in MDCA, including a list of the supported firewalls and proxies, visit https://docs.microsoft.com/en-us/defender-cloud-apps/set-up-cloud-discovery.
After cloud discovery sources have been connected, you can start to review the data in the Cloud Discovery dashboard. To view the dashboard, click the Discover dropdown from the main menu and choose Cloud Discovery dashboard. In the following screenshot, the discovery data is available through the connector to MDE.

Figure 14.31 – The Cloud Discovery dashboard
In the toolbar under Cloud Discovery, click on Discovered apps to view a list of all identified apps. Using the filtering options, you can sort apps by category, compliance risk, general risk, security risk, usage, and so on. Based on your filter results, custom queries can be created to quickly help you identify a subset of apps later. Additionally, the toolbar also includes links to dashboards to sort and review data by IP addresses, users, and devices.
Next, let's review the toolset available in MDCA that the security team can use to learn about the connected apps and data.
Investigate
MDCA lets security teams investigate apps and activities to help understand and identify risk in your environment. Using what you learn through the investigation tools is the first step before building out policies for alerts or configuring governance actions to protect users and data. To view the available investigation tools, expand Investigate from the main menu to reveal the following options:
- Activity log
- Files
- Users and accounts
- Security configuration
- Oauth apps
- Connected apps
The Activity log shows a timeline of events about a specific activity that occurred in a connected app. There are many different activity types that are logged, including administrative actions, downloads, failed logins, file and folder activities, risky security activity, and data sharing. By using the Activity log, if a risk is identified, security teams can quickly create new policies in near real time, based on the activities from an entry in the timeline.
Clicking on an activity will expand the activity drawer to provide additional insights, including user details, the connected app source, activity target, and geolocation. Selecting the User tab will show a quick view of the user profile analysis, which provides insights about the number of activities logged over the last 30 days, as shown in the chart in the following screenshot.
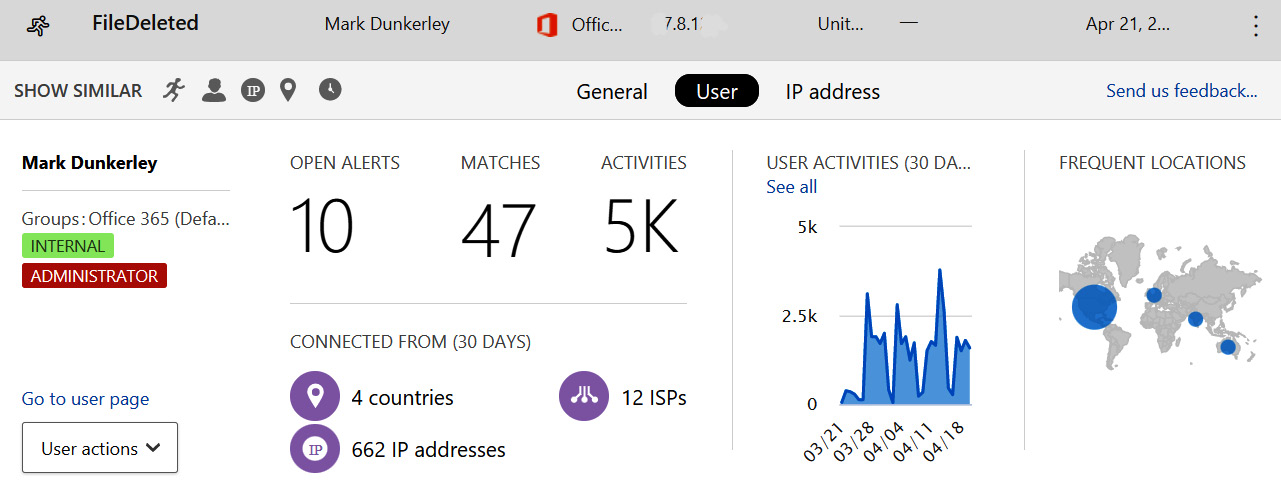
Figure 14.32 – The user activity log
The Activity log includes several pre-built queries to help identify known activities of interest, but custom queries can also be created by adding your own filter – for example, using the filters to view the activity of privileged users or keep a closer eye on users who have been flagged as a high risk for security incidents, based on previous history. The Activity log is a great way to begin understanding how users and devices are interacting with your connected apps.
The Files dashboard provides visibility into all files that were scanned from connected apps, and every time a file's content, metadata, or sharing is modified, MDCA will rescan the file to remain updated. Using the available filters, files can quickly be sorted by name, connected app, collaborators, access level, extension, file type, owner, sensitivity label, and so on. Just like the Activity log, applying filters allows you to quickly create and save queries for later use. For example, you can add a filter that shows all files from connected apps that are available directly over the public internet with or without a link, or all files shared externally to another domain. If you are using Microsoft Purview Information Protection labels, you can view the list of files by their applied sensitivity label. The following screenshot shows the Files view with a filter applied to show all files with a Public, Public (Internet) access level.

Figure 14.33 – The Files view in MDCA
Actions can be taken on files directly from the results by clicking the three vertical dots at the end of the log entry. Here, you can add additional conditions to your original file search query and apply governance actions, such as applying a sensitivity label, placing the item in trash, removing external collaborators, and making the file private if it is shared publicly.
The Users and accounts dashboard aggregates users by scanning connected apps and through the activity logs. Using the accounts page, filter options allow you to view accounts by affiliation (internal or external), application, and security group, and list accounts with administrative privileges inside the apps. In the following screenshot, the Show admins only filter was used to show all internal admins of the connected Box application.
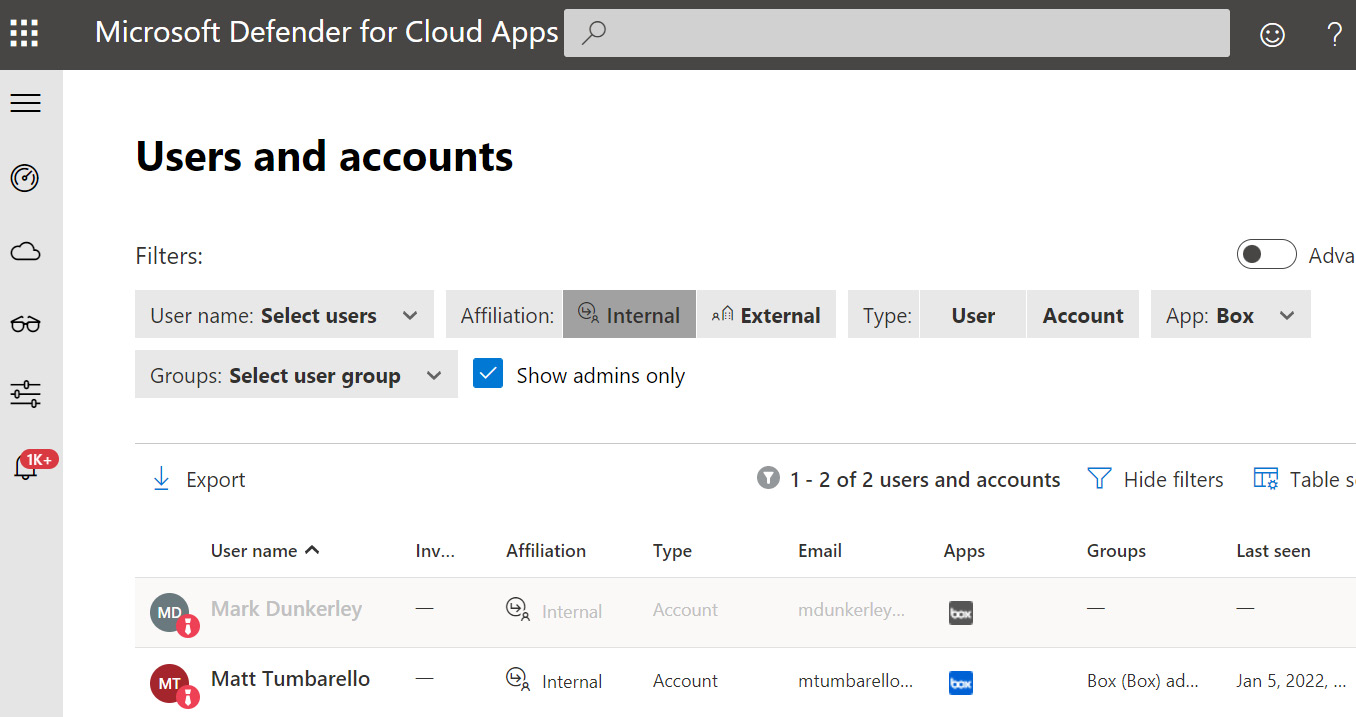
Figure 14.34 – Users and accounts
The Users and accounts view allows you to track the activity of a user, including which applications they access, and apply governance controls such as suspending a user, confirming a user is compromised, and requiring a user to sign in again.
Tip
Applying the Confirm user compromised action on an account will flag the Azure AD user risk as high. Any policy actions defined on the risk score will apply.
Click the username to view additional information about the user and to open the user profile page. Here, you can view any associated investigation score, recent activity, and an alert timeline, as shown in the following screenshot.

Figure 14.35 – Investigate a user
The Security configuration view provides recommendations for improving misconfigured security configurations that have been identified across any connected cloud platforms. The recommendations can be sorted by resource type, security benchmark, subscription, and severity. Some of the available benchmarks for Azure recommendations include the Azure Security Benchmark, ISO 27001, PCI DSS 3.2.1 and SOC TSP. For additional information about the available security recommendations for each cloud provider, visit https://docs.microsoft.com/en-us/defender-cloud-apps/security-config.
The Manage Oauth apps view shows any third-party apps that have permissions to view and interact with user data stored in Office 365, Google Workspace, or Salesforce and can sign in on the users behalf. Reviewing these app permissions helps security teams identify any risk of exposure to determine whether the app should be allowed in the environment. Permission levels are defined as high, medium, and low and indicate how much data an app may have access too. Through the Manage Oauth apps view, after apps are reviewed, they can be approved or banned (revoked for Google Workspace or Salesforce) right within the MDCA console. Any apps that are banned will have their permissions removed, and users will need to request consent to the app again. The filter view lets you find apps based on specific permissions – for example, access to your data anytime or full access to all mailboxes in your subscription. The following screenshot is an example of an Oauth app that was flagged with a high permission level.
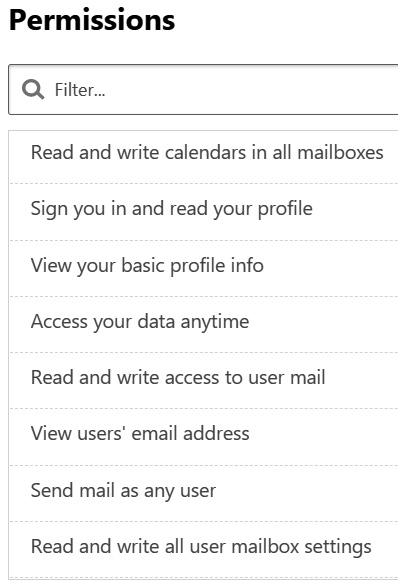
Figure 14.36 – Oauth permission level
As seen in the preceding screenshot, the level of permissions available to the app can be concerning and have a higher risk of exposing confidential data.
Tip
We strongly recommend configuring Do not allow user consent in the User Consent settings under Enterprise Applications in Azure AD.
Now that we have reviewed how to connect, discover, and investigate users and apps in MDCA, let's look at how to configure alert policies and controls.
Configuring policies and controls
Policies in MDCA are used to detect suspicious behavior, trigger alerts, and configure automatic governance actions and remediation workflows. Policies are configured based on nine different policy types across four categories to help correlate risk behavior. Each policy type will have different remediation options available. The main policy categories include threat detection, information protection, conditional access, and shadow IT. The different policy types are as follows:
- Activity policies are threat detection policies that track the activity of users throughout your cloud apps. Examples of activity types that can be created into a policy include multiple failed login attempts, logins from certain IP ranges, mass downloads or deletions, and administrative actions from non-specified IP ranges.
- Anomaly detection policies can be configured to alert on behaviors that are not commonly seen by users based on baselines built from entity behavior analytics and machine learning in MDCA. An anomaly detection policy can trigger an alert for impossible travel or an uncommon location, where a user's known to typically sign in from one geolocation but shortly after signs in from another location not commonly seen or physically impossible to travel to, based on the duration between sign-ins.
- Oauth app policies allows you to configure policies to alert when applications are approved in your organization. An example includes configuring a policy to alert when an Oauth app is approved with certain permissions or by a specific publisher. Governance actions can automatically revoke apps based on the configured filter conditions in the policy.
- Malware detection policies scan files in cloud repositories using Microsoft threat intelligence to identify known or potentially malicious files.
- File policies are used to identify specific file types based on their metadata. Examples of policies can include identifying files with sensitive information, shared externally or to personal email addresses. Governance actions on file policies include notifying users, removing external users, making a file private, applying sensitivity labels, or placing the file in the trash.
- Access policies monitor the access of cloud apps based on users, location, and devices. An example of access policies include blocking access to an application from a non-corporate IP range or triggering an alert if an app is accessed by a non-compliant Microsoft Intune device.
- Session policies allows you to control and monitor user session data. Session policies include actions such as blocking downloads based on certain conditions, applying sensitivity labels on upload or download, and blocking the upload of files containing malware.
- App discovery policies allow you to trigger alerts when a new app is discovered. This is a great way to monitor for shadow IT processes. Filters can be configured to alert based on the discovered application type – for example, whether the app is identified as a cloud storage repository, used for collaboration such as email or chat, or a customer relationship management (CRM) app.
- Cloud discovery anomaly detection policies are used to alert on anomalous behaviors by users within cloud apps. Examples include downloading data from an app that is not sanctioned or alerting when a user initiates a mass download or deletion event.
The governance actions, filters, and controls that are available will differ, depending on the policy type that you create. MDCA includes many preconfigured templates to help you get started, which are available in the MDCA portal under Control | Templates.
To review the governance actions that are available for each policy type, visit https://docs.microsoft.com/en-us/defender-cloud-apps/governance-actions.
Different actions will be available for connected apps and those found through cloud discovery or integrated with other solutions in the Microsoft security stack. Any governance actions that run automatically from being configured in a policy or manually through an administrators' actions can be reviewed in the governance log, found in the MDCA settings. The alert types are configured directly in the policies using email, text messages, or with playbooks in Power Automate.
With the increased adoption of SaaS applications for enterprise use, implementing a CASB can help to extend the protection of users and devices by governing the use and activity of these apps. Microsoft MDCA is a fully functional CASB that is easy to configure and a great addition to the list of tools available to the SOC to keep your Windows environments secure.
Next, we will review how to monitor hybrid environments and on-premises identities in hybrid AD environments using MDI.
Monitoring hybrid environments with MDI
MDI is a cloud security service that's used to analyze signals and events from AD domain environments to identify threats, compromised identities, and attacker activities inside the network. The solution provides incident tracking that the SOC can use to analyze timelines of security events, investigate alerts and user activities, and act on identified threats. The following list includes ways that MDI helps to identify suspicious activities inside your network:
- Monitors user activities and creates a behavioral profile about each user. Then, through intelligence, it creates alerts based on anomalies in the observed behavioral patterns. The heuristics used to build the user profile include details about permissions, group memberships, and account activities.
- Identifies attempts to enumerate information about a domain environment, such as queries for users, groups, and resources typically seen during reconnaissance activities.
- Alerts on attempts to move laterally through the network, using methods such as pass the hash, golden ticket, and silver ticket, or attacks over remote services such as Server Message Block (SMB).
- Identifies risks from compromised credentials by looking for brute-force attacks, numerous failed authentications, and changes in permissions or group memberships.
- Alerts on attempts for domain takeover, such as unsuspected domain replication, attempts to register or promote rogue domain controllers, or attacks using a compromised Kerberos Ticket Granting Ticket Account (KRBTGT) (Kerberos) account.
Telemetry data is collected from on-premises networks by installing the MDI sensor application on domain controllers or AD Federation Services (FS) servers. Information such as network traffic and Windows events are then forwarded to the MDI cloud service for investigation. The SOC team can then use the MDI or M365 Defender portal to monitor for suspicious activities and alerts. The MDI sensor will capture the following information from domain controllers or AD FS servers:
- Domain controller network traffic
- Windows events
- Remote Authentication Dial-In User Service (RADIUS) account information
- User and computer data from AD
For more detailed information about the MDI architecture, visit https://docs.microsoft.com/en-us/defender-for-identity/architecture.
Next, let's review the steps involved for planning an MDI deployment.
Planning for MDI
Microsoft docs have reference material that should be reviewed in detail before enabling MDI and installing the sensor on-premises. There are several prerequisites that need to be considered in the architecture and design, including licensing requirements. The official prerequisite documentation can be found at https://docs.microsoft.com/en-us/defender-for-identity/prerequisites.
Microsoft has a capacity planning guide and tool that can help you determine the appropriate resource requirements to run the MDI sensor. To download the MDI sizing tool, visit https://docs.microsoft.com/en-us/defender-for-identity/capacity-planning.
Activating your instance
After all prerequisites have been met, activating the MDI portal instance is straightforward. Visit the following link for step-by-step instructions on how to activate the instance, connect to AD, and install the MDI sensor:
https://docs.microsoft.com/en-us/defender-for-identity/install-step1
After the deployment is complete, data will automatically be collected and sent to the instance for analysis. Let's look at how MDI can recognize sequences of events to identify an attack chain.
Identifying attack techniques
MDI is designed to detect common attack methodologies from techniques defined in the MITRE ATT&CK Matrix to build a timeline of an attack kill chain. The kill chain is a sequence of events used by a malicious actor to gain knowledge of your environment and ultimately take over the domain. MDI recognizes these events in the following sequences:
- Reconnaissance
- Compromised credentials
- Lateral movements
- Domain dominance
- Exfiltration
Having the ability to correlate events to identify malicious activity during various stages of the kill chain can greatly increase the SOC's chances of stopping an attack. This is the real value of adding MDI monitoring as a security enhancement to your AD environment. The following table provides examples of the types of alerts that can be triggered from MDI during each stage of the kill chain:
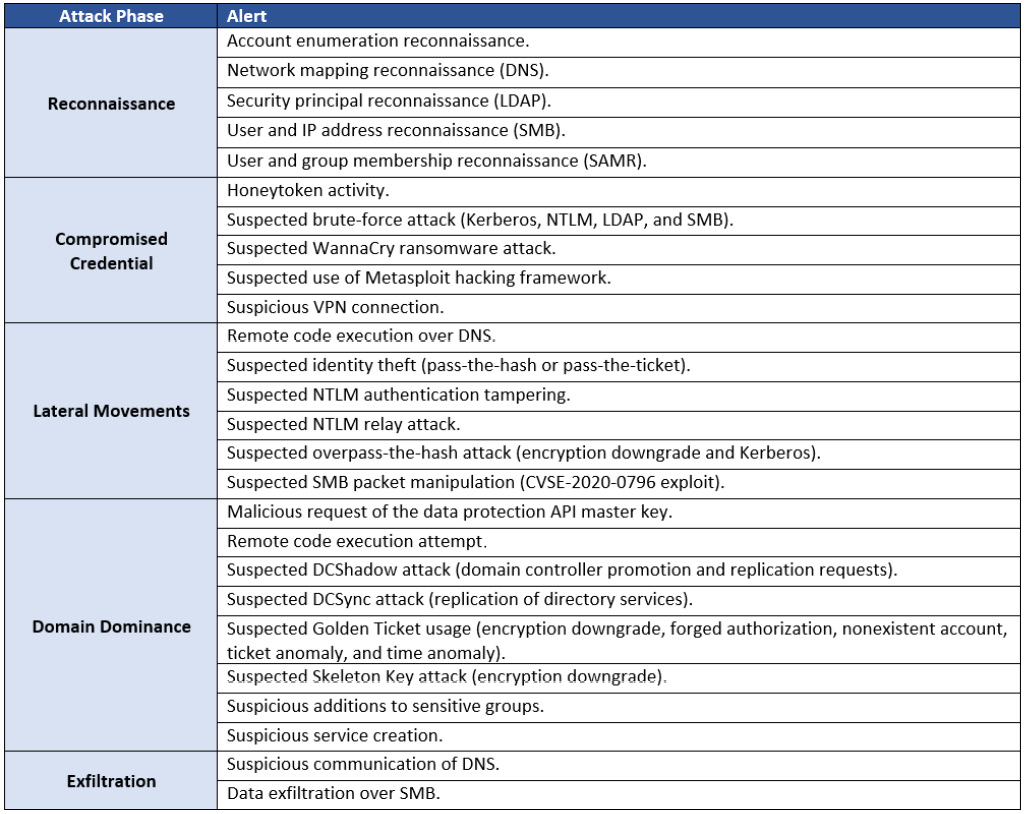
Figure 14.37 – MDI alerts
Each alert that is identified as malicious activity will be presented on the Timeline page in MDI. The timeline is the default landing page after logging into the MDI portal.
MDI can easily be integrated with other solutions in the Microsoft security stack such as MDE and MDCA. Additionally, security and health alert events can be forwarded to a SIEM solution for analysis.
Let's look at using the attack timeline in the MDI portal to investigate alerts.
Looking at the attack timeline
To sign into the MDI portal, visit https://portal.atp.azure.com. The landing page provides a Timeline view of suspicious activities listed in chronological order, with the last-opened alert first. The filtering panel allows you to view the alert status by Open, Closed, and Suppressed options, as well as by High, Medium, and Low severity. An example of the timeline view can be seen in the following screenshot, showing both a High and a Medium alert.

Figure 14.38 – An attack timeline view
MDI uses entity tags to help identify sensitive groups, accounts, and assets. These tags are helpful for identifying suspicious activities related to privilege escalation, reconnaissance, and lateral movement. By default, many of the common account types, server roles, and groups are tagged sensitive – for example, domain admins, domain controllers, local administrators, and server operators. You can manually tag entries as sensitive too and create Honeytoken accounts to lure attackers.
To view Entity tags in the MDI portal, click on the Configuration menu and choose Entity tags under Detection. In the following screenshot, a Honeytoken account named Break Glass [Admin] is being configured.

Figure 14.39 – Entity tags
In the Sensitive section, you can add additional accounts, groups, or servers that are considered sensitive for easy identification in the MDI portal. Any sensitive entity that shows up in an alert will have an S icon beside it, as shown in the following screenshot.

Figure 14.40 – A sensitive group with an entity tag
Heading back to the attack timeline, clicking on an alert will bring up additional information about the suspicious activity. Each alert tries to clearly define who and what is involved in the alert and when to quickly build a picture of the activity. In the following screenshot, an alert was created for a User and IP address reconnaissance (SMB) activity.

Figure 14.41 – A security alert in the MDI portal
Clicking + under Evidence will expand the details. In the preceding screenshot, you can see that the Emily Young account enumerated SMB session details on the MTLABDC01 domain controller from the WinSVR1 source system. The alert was labeled with a medium severity, but this activity can potentially indicate malicious intent and that the account has been compromised. Using this reconnaissance technique, a malicious actor could have successfully identified a list of network locations and potential accounts to target for further lateral movement. Based on the alert type, the SOC team can reach out to the user to reset the password or block all sign-ins until an investigation can be completed. Alerts can be cross-referenced using the M365 Defender portal and correlated with any relevant alerts from MDCA or MDE. Correlating alerts is an important step to identify any additional events and locate sources of compromise to thwart an attack.
Let's look at a few other alerts in the MDI portal. In the following screenshot, an attacker used the overpass-the-hash technique to acquire a Kerberos Ticket-Granting Ticket (TGT) using the BreakTheGlass account.

Figure 14.42 – An overpass-the-hash attack in MDI
If an attacker attempts to move laterally and execute code remotely throughout the network, using tools such as PSExec and mimikatz, MDI will trigger a Remote code execution attempt alert, as shown in the following screenshot.

Figure 14.43 – A remote code execution attempt alert
In Chapter 10, Mitigating Common Attack Vectors, we mentioned a credential dumping technique using domain controller replication, known as a DCSync attack. MDI can alert on any requested replication activities, as shown in the following screenshot.

Figure 12.44 – A suspected domain replication alert
If the replication is malicious in nature, additional privileged accounts can become compromised, or the KRBTGT password hash can be captured and exploited for use in a golden ticket attack. MDI will also alert on suspected golden ticket attacks, as shown in the following screenshot.
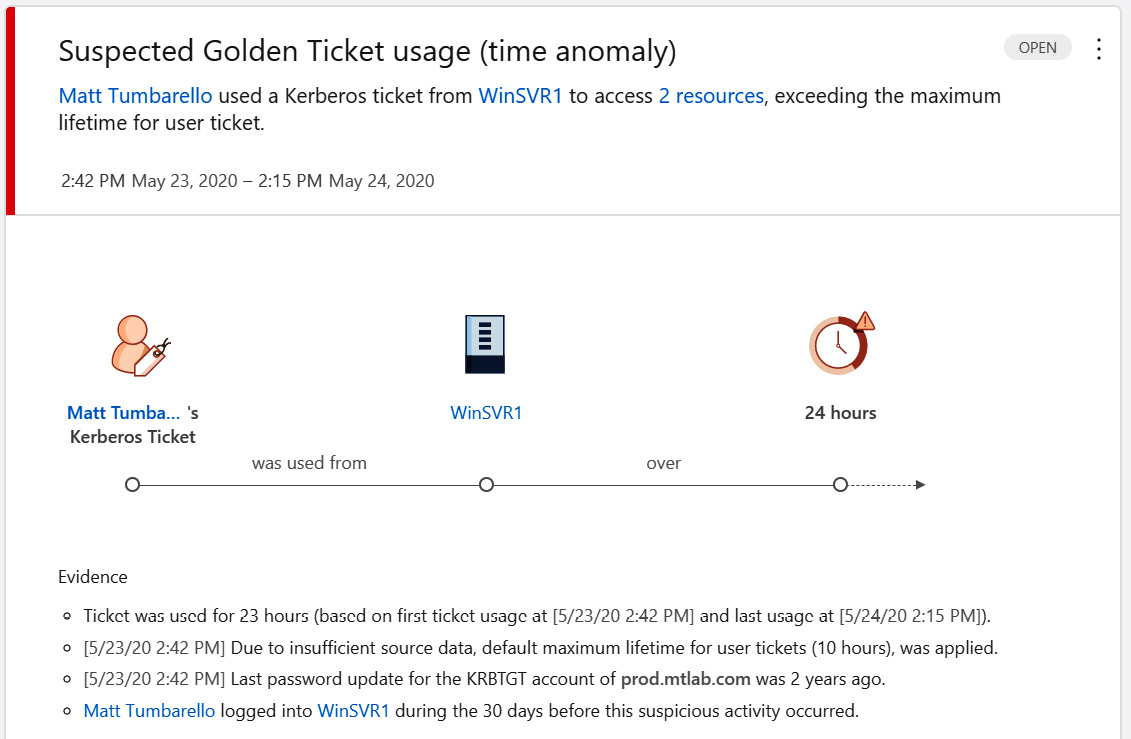
Figure 14.45 – A suspected golden ticket attack
Once this level of access has been obtained, the attacker now has control over resources that rely on Kerberos tickets for authentication and can timely plan a domain takeover. Having this visibility into the attack chain can help security teams take action and prevent these incidents from occurring.
Notifications and reports can be scheduled from the MDI portal by going to Configuration and choosing Notifications or Scheduled reports under Notifications and Reports. The available reports include the following:
- A summary of alerts and health issues
- Modifications to sensitive groups
- Passwords exposed in cleartext
- Lateral movement paths to sensitive accounts
For additional information about managing alerts in the MDI portal, visit https://docs.microsoft.com/en-us/defender-for-identity/working-with-suspicious-activities.
Next, we will review the solutions available from M365 to protect sensitive data.
Data protection with M365
Although not directly related with the security hardening your Windows devices or servers, it is critical that you are aware of the tools that will help protect the data your users are accessing from their Windows devices and any data stored on Windows servers. Like all technologies, there are options available from many vendors for data protection. For this publication, we will be focusing on the technology available with Microsoft. With Microsoft, a few of the technologies used to best protect your company data include the following:
- Microsoft Purview Information Protection
- Data Loss Prevention (DLP)
- Windows Information Protection (WIP)
In addition to the preceding data protection components is information governance. As you build and mature your data protection program, ensure your information governance program exists and matures. Some of the primary features Microsoft focuses on with information governance is data retention and deletion, record management, automation of retention labels, and the ability to prove compliance within your environment.
Purview Information Protection, DLP, and WIP can be used as separate products from Microsoft and may appear to provide some overlap, but they all have their unique usages and also complement each other to provide additional protection for your company's data. Let's look at each of these technologies in more detail.
Using Microsoft Purview Information Protection
In the first edition of this publication, we reviewed AIP. AIP now falls under the broader Microsoft Purview solution in which we will focus on. In short, Purview Information Protection is a technology that provides the ability to discover your data, classify your data, and provide visibility of your data by applying sensitivity labels. Microsoft has provided a simplified Purview Information Protection framework to follow. This includes the following three principles:
- Know your data by identifying the different types of data you need to protect.
- Protect your data by creating and applying sensitivity labels across all Microsoft services, cloud repositories, databases, and containers.
- Prevent data loss by building and deploying DLP policies within your environment.
To learn more about Purview Information Protection, visit the official documentation link at https://docs.microsoft.com/en-us/microsoft-365/compliance/information-protection?view=o365-worldwide.
Before using Purview Information Protection, make sure you are familiar with the license requirements. Depending on the features in your license types, you may need to purchase add-ons to utilize advanced features. In the preceding link, scroll to the bottom of the page and click on the PDF download link within the Licensing requirements section to view more details about licensing.
To access Purview Information Protection, access the Office 365 Security and Compliance console by logging in to https://compliance.microsoft.com/homepage and then selecting Information protection. Here, you will view an overview and manage your labels, label policies, and auto-labeling. To review information on your sensitive info types, exact data matches, trainable classifiers, and so on, navigate to Data classification in the main menu on the left.
Next, we will provide an overview of DLP.
An overview of DLP
DLP tools help to identify, monitor, and prevent against unwanted sharing and exfiltration of sensitive company data from your environment. Using the Microsoft DLP solution, sensitive information can be prevented from leaking out of your environment by protecting the following services:
- Exchange Online, SharePoint Online, OneDrive for Business, and Microsoft Teams
- Word, Excel, and PowerPoint
- Windows 10, Windows 11, and macOS (Catalina 10.15+)
- Non-Microsoft cloud apps
- On-premises SharePoint and file shares
Within the DLP engine, you can create policies that allow you to select which type of data you would like to protect. With the data type, you can select from many pre-defined templates that scan for Personal Identifiable Information (PII), finance, medical and health, and privacy types of information. You can then define the locations that you would like to search within, and configure the policy settings by defining the conditions and protection actions against any identified sensitive information. You also can test the policy, which is highly recommended before enabling it for production.
To access Microsoft's DLP, log in to the M365 Compliance console at https://compliance.microsoft.com/homepage and select Data loss prevention. Click on Policies to set up and review your policies. You can also view Alerts and the Activity explorer within this section. As mentioned in the previous section, make sure you are familiar with the license requirements for DLP and review the license document referenced.
Next, we will look at the WIP technology.
WIP
The final technology we will review is WIP. This is the technology available to help prevent the accidental leakage or loss of data from your enterprise documents in Windows 10 version 1607 and later. With WIP, you can create policies that prevent data from being moved out of your environment, such as preventing data from being copied to USB drives. WIP also helps protect and separate corporate data from personal data if your company supports a bring your own device program for employees. In addition to running Windows 10 version 1607 or later, you will also need to be licensed for Microsoft Intune or manage devices with Microsoft Endpoint Configuration Manager to enable WIP policy. Third-party solutions can also apply WIP policies through the EnterpriseDataProtection Configuration Service Provider (CSP). Information about the CSP can be found at https://docs.microsoft.com/en-us/windows/client-management/mdm/enterprisedataprotection-csp.
To access Microsoft's WIP, log in to Microsoft Endpoint Manager at https://endpoint.microsoft.com/ and click on Apps. Then, click on App Protection Policies under the Policy menu. Here, you can create and manage your WIP policies, including Mobile Application Management (MAM) policies for iOS and Android. For more information about creating a WIP policy using MDM, visit https://docs.microsoft.com/en-us/windows/security/information-protection/windows-information-protection/create-wip-policy-using-intune-azure.
We have just reviewed three different technologies for protecting data with M365. Protecting company data within your environment and endpoint devices is a journey requiring a partnership between IT, the business, and the data owners. It should be considered a priority in your overall hardening strategy and an integral component of a security program. Next, we will review business continuity and the importance of planning for disaster recovery and cyber incident response.
Planning for business continuity
To finish this chapter, we are going to cover business continuity planning and its importance as it relates to security, your infrastructure, a Disaster Recovery Plan (DRP) and a Cybersecurity Incident Response Plan (CIRP). When we look at the Business Continuity Plan (BCP), it is considered a business-wide plan that focuses on a business holistically to ensure the continued operation in the wake of major disruption. Within the BCP, multiple plans come together that comprise the overall plan, and there are many frameworks available to assist with the BCP program. The SP 800-34 Rev. 1, Contingency Planning Guide for Federal Information Systems NIST framework publication is a great resource for your BCP planning and can be found at https://csrc.nist.gov/publications/detail/sp/800-34/rev-1/final.
The following screenshot represents all the plans covered within the referenced NIST SP 800-34 Rev.1 publication.
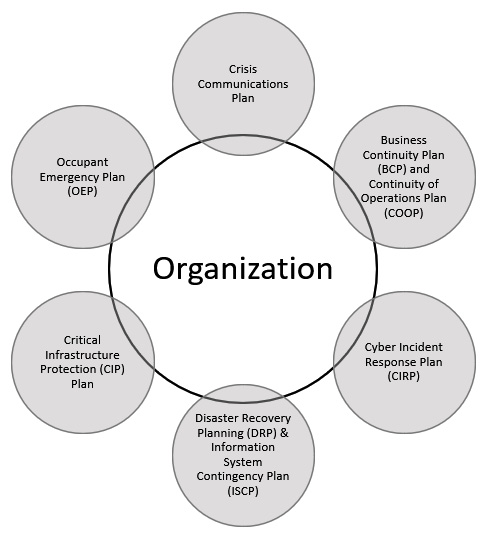
Figure 14.46 – The different plans that make up the BCP
The BCP is not a simple plan to create; it requires a lot of time and resources to make it successful. In addition to building a well-documented plan, it is just as important to ensure that everyone is familiar with the plan and that it has been coordinated and tested in some way. When it comes to executing the BCP in a real-world scenario, you don't want to be doing so for the first time without at least being familiar with the process and steps involved. To be better prepared, different exercises can be completed to become more familiar with the BCP, and one of the more common BCP exercises is in the form of a tabletop exercise. In a tabletop exercise, you bring together the key personnel in your organization and walk them through a crisis situation that may occur. When walking them through the situation, you request a response on how to handle the situation to identify any gaps in a real crisis.
Some examples that may trigger the execution of the BCP include a natural disaster, such as hurricanes, earthquakes, and floods. Depending on the severity, fires or power outages are other examples that may cause the BCP to execute. Today, more common threats that will trigger the BCP include cyberattacks, which can easily bring a business to a halt very quickly.
Learning DRP
The DRP is, for the most part, technical in nature and focuses on the recovery of IT infrastructure and systems. The DRP falls within a larger BCP plan for an entire organization, and the execution of a DRP plan will be unique, depending on the situation, and it may not impact the entire business. Events that trigger the BCP will typically have some form of impact on your IT systems and may require the execution of the DRP at the same time. Some examples include a natural disaster, such as a hurricane or fire destroying a data center.
As stated already, the entire DRP may not need to be fully executed in certain situations. For example, if a business-critical application becomes corrupted and is not highly available, you may only need to execute the DRP for that specific application to ensure ongoing operations. There are many different instances that can cause the DRP to be activated, so it's critical to account for each of these scenarios and make sure you are able to accommodate recovery for individual systems or entire data centers. A key component in DR planning is understanding the impact of a service or function and the Maximum Tolerable Downtime (MTD) that a service or function can withstand before your business is negatively impacted. Two important factors that also need to be understood are the Recovery Time Objective (RTO) and Recovery Point Objective (RPO). The RTO is the maximum amount of time a system can be unavailable for before negatively impacting a service or function within the business and preventing it from being able to operate normally. The RPO is the point in time at which the service or function can suffer data loss without being negatively impacted.
As you build your DRP and understand the expected restoration of each system based on the RTO and RPO, you are going to need to ensure that you have the process and infrastructure in place to meet those requirements. A few examples to consider include the following:
- Having High-Availability (HA) configurations for systems may help restoration after any local issues within a data center but will come at a cost.
- Understand your backup strategy as it relates to full backups, incremental backups, and differential backups, and also consider how often each backup needs to be taken and retained.
- Consider what type of failover is needed for a complete restoration of a data center, should you have a cold, warm, or hot site available.
All these considerations will depend on the business requirements and needs, along with the expense. Having a hot site on standby will come at a much greater cost than that of a warm or cold site. More importantly, as you implement your DRP and backup strategies, the role security plays in each should be well understood. Ensuring that your data is backed up securely, off-site storage of data is secure, and your standby data centers maintain the same level of security as your primary data centers should all be taken into consideration.
One last point to mention is testing. Like your BCP, it is critical that you test your DRP to ensure that everyone is familiar with the restoration procedures and to confirm that the DRP works. This is typically validated by executing the DRP to some extent, restoring part of or the entire infrastructure in a secondary location, and validating that services and applications are functioning. This should be an annual event at a minimum.
The importance of a CIRP
As we look at today's threats in the security space, there has continued to be an increase in advanced cyberattacks, and they are becoming more sophisticated each day. One of the more advanced and disruptive threats is ransomware, which is known to severely impact business operations. Many companies aren't prepared for these levels of attacks, which can take days, weeks, or even months to recover from and get back to normal operations. Depending on the size of the business and the severity of the breach, the impact could be as damaging as a complete business shutdown. With that, it is critical that your organization fully understands the impact of a potential breach and how to best be prepared to handle one. For optimal preparation, a CIRP can help organizations navigate through a breach when it occurs. Your CIRP should include elements such as identifying the roles and responsibilities of the incident response team, updated contact information of everyone involved including vendors, incident response procedures, communication procedures, and playbooks.
Once you have a production-ready CIRP, all parties involved in a cybersecurity incident should become familiar with the CIRP. You will also want to test the response of both your technical and executive teams with a tabletop exercise to address any gaps with your CIRP and better prepare the team for what decisions may need to be made in such a situation.
A thorough BCP, DRP, and CIRP will require a lot of thought and collaboration between the IT team, cybersecurity team, broader business stakeholders, and executive team. The success of these plans will require the support and involvement of leadership to ensure that the business is best prepared for when an incident does occur.
Summary
In this chapter, we covered security operations and reviewed the tools and technologies available from Microsoft that offer enterprise-class protection. We began the chapter with an introduction to the SOC and XDR and the importance of both in an enterprise. We then introduced the M365 Defender portal with an overview of the available features.
Next, we reviewed MDE before providing an overview of Microsoft Sentinel and MDCA, Microsoft's version of a CASB. Other tools and features reviewed in this chapter included MDI and the different data protection tools available from Microsoft (Purview Information Protection, DLP, and WIP). We then concluded the chapter with an overview of BCP, DRP, and CIRP.
In Chapter 15, Testing and Auditing, we will review validating controls to ensure that the security measures that have been agreed upon are in place. We will look at Microsoft's on-demand assessments and then review vulnerability scanning and testing to ensure that our controls are working correctly. The final sections will cover an overview of penetration testing and remediation, before finishing with security testing, awareness, and training.