Option Profit-and-Loss Diagrams
Call Options
The call option buyer (option holder) has the right but not the obligation to buy the underlying asset at a specified time in the future (expiration date) at a specified price (strike price). The call option writer has the obligation to sell the option if exercised at the specified price and date in return for a premium paid by the option buyer (Table 2.1).
Call Profit-and-Loss Diagrams
We will start with looking at the profit-and-loss diagram for the long call option. The long call is the position of the holder (buyer) of the call option. We will assume that you have purchased a call option on ABC stock at a strike price of $43 per share and paid a premium of $2 per share. In the real world, one stock option contract is usually a hundred shares, so your total premium would be $200. As you can see from Figure 2.1, your break-even price is $45 per share because you have paid the $2 per share premium.
Any price below your break-even price of $45 per share would be a loss and the option would be deemed out of the money. At a share price of $44 your loss is $1 per share, the strike price of $43 plus the $1 per share profit less the $2 premium you paid. At a share price at $43, the strike price, or below would leave you with the loss of the $2 premium per share. If the stock price was $45 on expiry date, the option would be deemed at the money, which is your break-even price. Any stock price above $45 per share would be profit for you and the option would be deemed in the money. As you can see from the diagram, your profit is unlimited but your loss is limited to the premium of $2 you paid per share. If the option was out of the money on the exercise date, you would simply let it expire as it has no value and take the loss of the premium you paid. However, if the option was in the money on the expiration date and the underlying share price was $50, the value of the option would reflect the profit you had made on the underlying share price and you could either sell the option and lock in your $7 profit, or you could purchase the underlying shares at the $43 per share strike price and sell the shares in the open market at $50 for a profit of $7 per share.
Table 2.1 Call option contract
Call option contract | |
Call buyer | Call seller/writer |
Has right | Has Obligation |
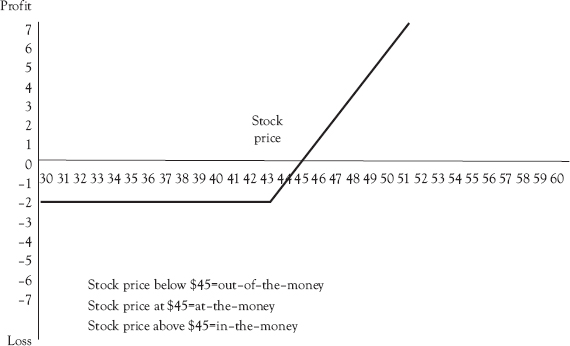
Figure 2.1 Long call option profit-and-loss diagram
Now let’s look at the option writer’s side of the contract, which is called a short call. The option writer’s profit-and-loss diagram, Figure 2.2, tells a very different story.
The diagram shows that the option writer makes a profit (the premium received) as long as the underlying share price remains below $45 per share. If the stock price is at $45 on the expiry date, the option writer breaks even. However, if the price per share is above $45, the option writer makes a loss. The potential losses for a short call option if the stock price goes up are unlimited for the option writer.

Figure 2.2 Short call option profit-and-loss diagram
Put Options
The put option buyer (option holder) has the right but not the obligation to sell the underlying asset at a specified time in the future (expiration date) at a specified price (strike price). The put option writer has the obligation to sell the option if exercised at the specified price and date in return for a premium paid by the option buyer (Table 2.2).
Table 2.2 Put option contract
Put option contract | |
Put buyer | Put seller/writer |
Has right | Has obligation |
Put Profit-and-Loss Diagrams
Let’s look at the profit-and-loss diagram for the long put option. The long put is the position of the holder (buyer) of the put option. Assume that you have purchased a put option on ABC stock at a strike price of $43 per share and paid a premium of $2 per share. As you can see from Figure 2.3, your break-even price is $41 per share because you have paid the $2 per share premium. At this price, the option is deemed at the money.
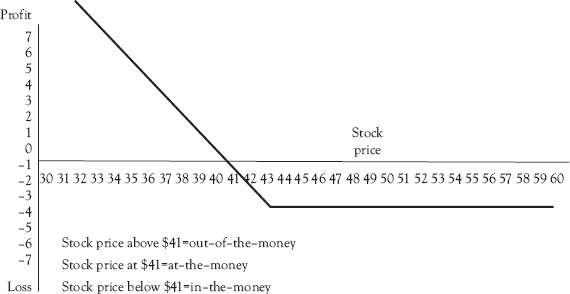
Figure 2.3 Long put option profit-and-loss diagram
Once the price has dropped below $41, your break-even price, the option is deemed to be in the money. However, if the underlying price is above $41, the option is deemed out of the money and the option buyer only loses the premium paid ($2 per share) to the option writer no matter how far above $41 the underlying price moves. For the long put option buyer, losses are limited to the premium paid; however, the profits are unlimited.
The other side of the long put option is the short put option. This is the position of the option writer and the profit-and-loss diagram for this position is shown in Figure 2.4.

Figure 2.4 Short put option profit-and-loss diagram
Table 2.3 Option contract types and their characteristics
Option Type | Limited profit | Limited loss | Unlimited profit | Unlimited loss |
Long call | No | Yes | Yes | No |
Short call | Yes | No | No | Yes |
Long put | No | Yes | Yes | No |
Short put | Yes | No | No | Yes |
Figure 2.4 shows that the option writer makes a profit (the premium received) as long as the underlying share price remains above $43 per share (in the money). If the underlying stock price is at $43 on the expiry date, the option writer breaks even (option is at the money). However, if the price per share is below $43, the option writer makes a loss (out of the money). The potential losses for a short put option if the stock price goes up are unlimited for the option writer.
As we have seen, an option has two parts: the holder or buyer of the option and the opposite part is the option writer. Now let’s summarize what we know about options so far (Table 2.3).
We shall see in later chapters how we can take advantage of those option characteristics to create profitable option strategies.