Chapter 17
Documenting Your Design
While the industry continues to move toward a 3D building information model as a construction deliverable, today we still need to produce 2D documents for a construction set or design reviews. Using the integrated documentation tools in Autodesk® Revit® Architecture software, you can create these sets with more accuracy and dependability than in the past. In this chapter, you will take the elements you have previously modeled and detailed and begin to create the documentation for your design.
In this chapter, you’ll learn to:
- Document plans
- Create schedules and legends
- Lay out sheets
Documenting Plans
In this chapter, we’ll introduce a scenario that will mimic what might happen on a real project in a preliminary design phase. We are going to assume that you’ll be using the c17-Sample-Building.rvt or c17-Sample-Metric.rvt model from the book’s companion website: www.sybex.com/go/masteringrevit2014.
Here’s the story: You have recently completed some preliminary design work in advance of your upcoming client meeting. You will need to lay out the plans, elevations, and perspectives on some presentation sheets for the meeting, but you will also have to include some building metrics, such as area plans and schedules of overall spaces.
In the following sections, you’ll start with the area plans. For the purposes of program verification, you have decided you need to establish the spatial areas for the building so the client can get some preliminary pricing from the contractor. Before you create your area plans, we’ll discuss some of the various ways you can calculate areas in Revit.
Room Objects
![]() The simplest way to calculate the space in a building design is to use room objects. Room tags can be used to report room name, department, area, and any of the other properties of a room. These properties can also be scheduled to report the total area of all rooms within a design. With rooms, however, the areas that they report are limited to how those spaces are defined. With the c17-Sample-Building model open, choose the Architecture tab, and then access the expanded panel under the Room & Area panel. Click Area And Volume Computations, which opens the Area And Volume Computations dialog box. You will see the options for room area computation in the project. The choices are as follows:
The simplest way to calculate the space in a building design is to use room objects. Room tags can be used to report room name, department, area, and any of the other properties of a room. These properties can also be scheduled to report the total area of all rooms within a design. With rooms, however, the areas that they report are limited to how those spaces are defined. With the c17-Sample-Building model open, choose the Architecture tab, and then access the expanded panel under the Room & Area panel. Click Area And Volume Computations, which opens the Area And Volume Computations dialog box. You will see the options for room area computation in the project. The choices are as follows:
- At Wall Finish
- At Wall Center
- At Wall Core Layer
- At Wall Core Center
Because each of these settings affects the entire project, a level of consistency is ensured for room calculations; however, the global nature of the settings makes it difficult to use the room objects for gross area calculations. Room calculations can give you an accurate net area—or carpet area—that refers to the area between the finished wall surfaces considered as occupied space. This value can also be reported in the room tag or schedule by selecting the first choice, At Wall Finish, from the Area And Volume Computations dialog box. Select this option and click OK.
Let’s see how this is reflected on the floor plans. Open the Level 2 floor plan. In this view, we have already established the rooms and added room tags; however, the tags do not show the room areas. To modify this setting, follow these steps:
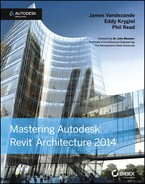
Now you should see the areas reflected in the room tags, as shown in Figure 17.1. This is because the Show Area setting was created as a Yes/No parameter assigned to the visibility property of the area label within the room tag family. If you want to explore this functionality further, you can open the tag family. Select the room tag and click Edit Family in the contextual tab of the ribbon.
Figure 17.1 Room area reflected in the room tag
![]() If you select any one of these room tags, you can also see the area that it is calculating (Figure 17.2). When adding rooms, you are not limited to only rooms that are bound on all sides with walls. If you note the lounge and lobby spaces in Figure 17.2, there isn’t a wall dividing the two rooms, yet they are shown as being independent of each other. This separation is achieved by using room separation lines, which can be placed with the Room Separator tool located on the Room & Area panel of the Architecture tab. Note that these lines will print and export with other model and annotation elements, but you can adjust their visibility in the Visibility/Graphic Overrides dialog box. You will find these elements under Lines, <Room Separation>.
If you select any one of these room tags, you can also see the area that it is calculating (Figure 17.2). When adding rooms, you are not limited to only rooms that are bound on all sides with walls. If you note the lounge and lobby spaces in Figure 17.2, there isn’t a wall dividing the two rooms, yet they are shown as being independent of each other. This separation is achieved by using room separation lines, which can be placed with the Room Separator tool located on the Room & Area panel of the Architecture tab. Note that these lines will print and export with other model and annotation elements, but you can adjust their visibility in the Visibility/Graphic Overrides dialog box. You will find these elements under Lines, <Room Separation>.
Figure 17.2 The room object shows what area is being calculated.

Since area calculation using rooms doesn’t usually include wall thicknesses, let’s look at another way to calculate areas, using area plans.
Area Plans
Area plans are views of the model used to calculate defined two-dimensional spaces within the model according to prescribed calculation standards, but with the added ability to customize the area boundaries. The software allows you to create as many area calculation schemes as you need to depict the design. Area boundaries can exist only in area plans and can either be manually placed or automatically associated with walls. If they are automatically placed, the areas within them will be calculated based on the BOMA standard.
The default project template includes some predefined areas. To add to the list of available area schemes, access the expanded Room & Area panel in the Architecture tab of the ribbon, and then click Area And Volume Computations.
When the Area And Volume Computations dialog box opens, choose the Area Schemes tab, shown in Figure 17.3. Here you can add as many new area schemes as your design requires. For each area scheme, you can create associated plans, schedules, and area boundary layouts; however, be careful not to add too many superfluous area schemes on larger projects because doing so is known to degrade performance and increase file size.
Figure 17.3 The Area Schemes tab in the Area And Volume Computations dialog box
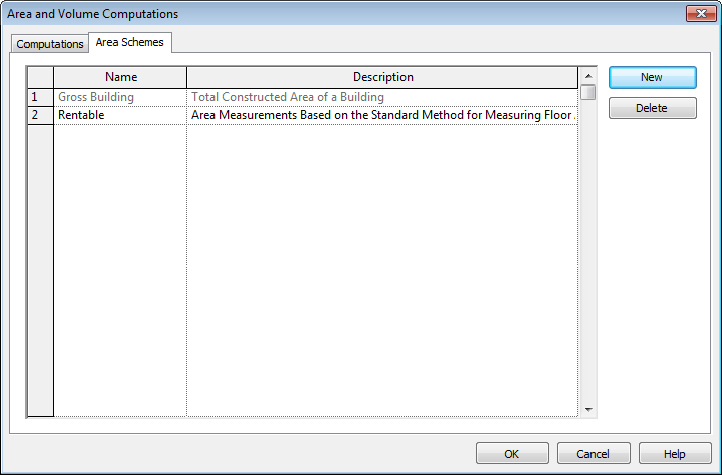
Create a new area scheme by clicking the New button. By default this will be a rentable type plan based on BOMA calculation rules. You will see a new area scheme in the list. Click in the Name field of the new row and rename the scheme Useable Area (Figure 17.4). Click OK to close the Area And Volume Computations dialog box.
Figure 17.4 Create a new area scheme.

Creating an Area Plan
To continue the exercise, you will need to create area plans for your presentation. You can create an area plan from two locations: One is located on the Room & Area panel of the Architecture tab. The other is located on the Create panel of the View tab. Follow these steps:
Figure 17.5 Creating new area plans

Figure 17.6 Area boundaries have been automatically assigned to the exterior walls.
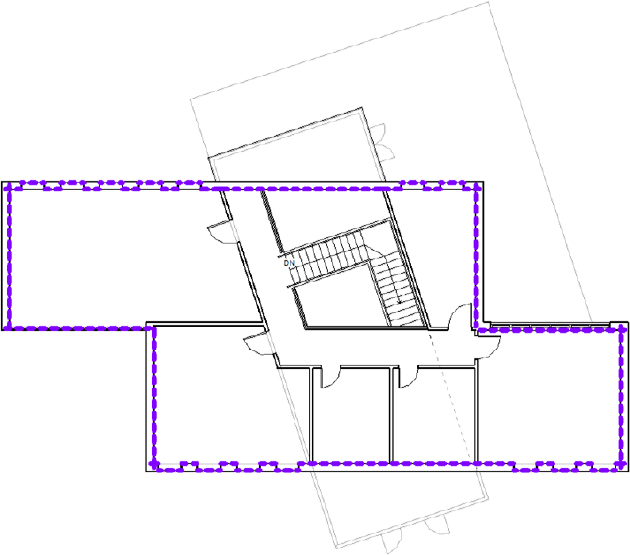
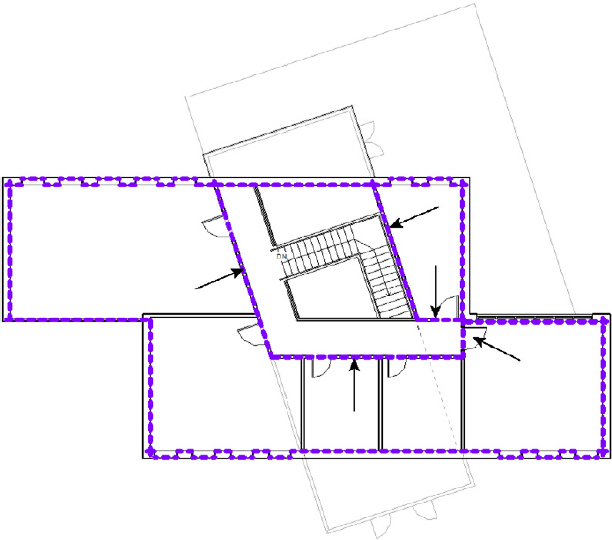
Figure 17.7 Place additional area boundaries on Level 1 as shown here.

Figure 17.8 Place additional area boundaries on Level 2 as shown here.
Adding an Area Object
Like room elements, areas need a closed boundary in order to be placed, and they have properties to which you can add attributes that are “taggable.” You can have any number of areas visible in an area plan, but unlike rooms, areas can be seen and tagged only in area plans. In this section’s exercise, you will place area objects within the boundaries you created in the previous exercise:
Figure 17.9 The placed area element with area tag

Figure 17.10 Rename the areas placed on Level 1.


Figure 17.11 Rename the areas placed on Level 2.

Modifying Area Plans
Like rooms, areas can be modified at any time during the design process. They will be adjusted automatically if the boundary lines are locked to a wall or other element that has been moved as part of the design, or they can be modified manually.
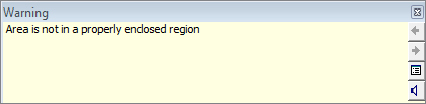
If you delete an area line, you’ll get the warning message shown in Figure 17.12. This message tells you that you have removed one or more of the boundary lines for an area and the software can no longer calculate the area.
Figure 17.12 Modifying an area boundary generates a warning.
If you are in the midst of modifying a space, finish your modifications and replace any area lines that you’ve deleted or removed as part of the design change. Once the area is completely bound, it will recalculate the space.
In this section, you’ve created an area plan that will give you a graphic representation of the space you’ve defined with boundary lines. But what if you want to show this same information in a spreadsheet format? All you need to do is set up a view type in the model that allows you to look at the same information in a tabular format. For this, you can use a schedule.
Creating Schedules and Legends
![]() Schedules are lists of elements and element properties within the model. They itemize building objects such as walls, doors, and windows as well as calculate quantities, areas, and volumes. They can also list document elements such as sheets, keynotes, and views. Schedules are yet another live way to view a Revit model. Once created, they are constantly kept up-to-date with any changes that occur to the model itself.
Schedules are lists of elements and element properties within the model. They itemize building objects such as walls, doors, and windows as well as calculate quantities, areas, and volumes. They can also list document elements such as sheets, keynotes, and views. Schedules are yet another live way to view a Revit model. Once created, they are constantly kept up-to-date with any changes that occur to the model itself.
Legends are views in which you can display building components or annotations used in your model without affecting quantity schedules of the actual project model. Legends can be created for displaying information such as door types, wall types, key plans, or general notes. Legends are unique in their behavior as a view because they are the one view that can be placed on multiple sheets.
Schedules
In a project workflow, creating schedules of objects, areas, or quantities is usually one of the most laborious tasks for architects. When this process is performed manually, it can take a very long time and typically results in errors that require validation of the design data.
In Revit, all building elements have information about their properties defined within the model. You also have the option to include additional information with any element. For example, doors have properties such as size, material, fire rating, cost, and so on. All of this information can be scheduled and quantified. Because the schedule is a live tabular view of the element within the model, modifying values in a schedule changes the element in the model, and vice versa.
There are several types of schedules, all of which can be accessed from the Create panel of the View tab. You can also create schedules by right-clicking the Schedules/Quantities node in the Project Browser. You can create five primary types of schedules:
Each of these schedule types gives you the ability to select related element properties that you can mix and match to track elements within the model. When you create a new schedule, you must first select a category of objects to itemize (Figure 17.13). You can also filter the schedule based on the various disciplines by selecting the Filter List drop-down at the upper left.
Figure 17.13 Creating a new schedule
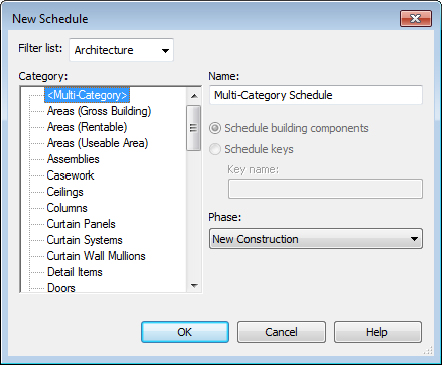
While the most common schedules are based on a single object category, you can also create schedules that span categories. The first option in the dialog box in Figure 17.13 is the <Multi-Category> schedule. You might want to schedule all the casework, furniture, and furniture systems in a project simultaneously, or all the windows and doors if they are being ordered from the same manufacturer. Although this type of schedule allows you to span multiple categories, many specific parameters cannot be included. First, it is difficult to isolate just two categories (such as windows and doors) in a multi-category schedule. Second, you cannot include critical parameters in the schedule such as length, width, and height. Another limit of this schedule type is that you cannot schedule host elements (walls, floors, ceilings, and so on), only their materials and family components.
To become familiar with the general functionality of creating a schedule, we will create a room schedule. Later in this chapter, you will apply your skills to create an area schedule based on the previous exercises.
From the View tab in the ribbon, click Schedules ![]() Schedule/Quantities. In the New Schedule dialog box, select Rooms from the list of categories, and click OK to continue. You are then presented with the Schedule Properties dialog box. This is the main interface by which you set, and later modify, any of the organizational or appearance characteristics of your schedules. The dialog box consists of five tabs: Fields, Filter, Sorting/Grouping, Formatting, and Appearance. Let’s step through each of these tabs and examine how they affect the form and function of the schedule:
Schedule/Quantities. In the New Schedule dialog box, select Rooms from the list of categories, and click OK to continue. You are then presented with the Schedule Properties dialog box. This is the main interface by which you set, and later modify, any of the organizational or appearance characteristics of your schedules. The dialog box consists of five tabs: Fields, Filter, Sorting/Grouping, Formatting, and Appearance. Let’s step through each of these tabs and examine how they affect the form and function of the schedule:
Figure 17.14 The Fields tab
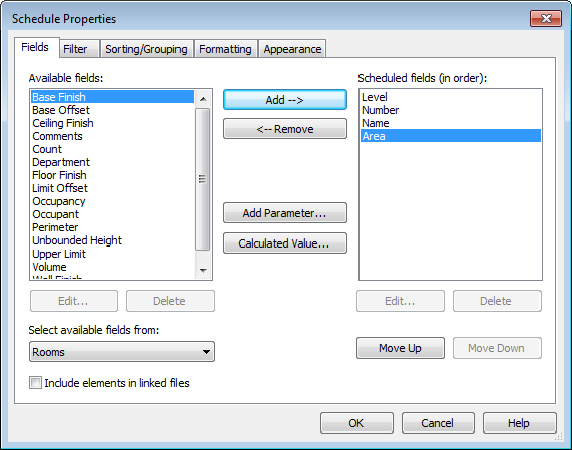
Figure 17.15 The Filter tab

Figure 17.16 The Sorting/Grouping tab
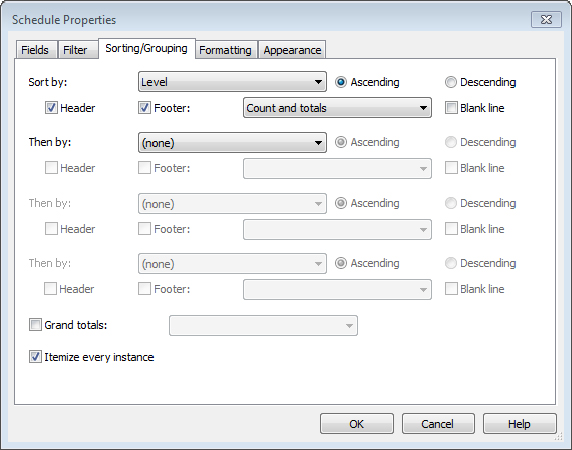
Figure 17.17 The Formatting tab allows you to change unit formats and specify fields in which you need to calculate totals.

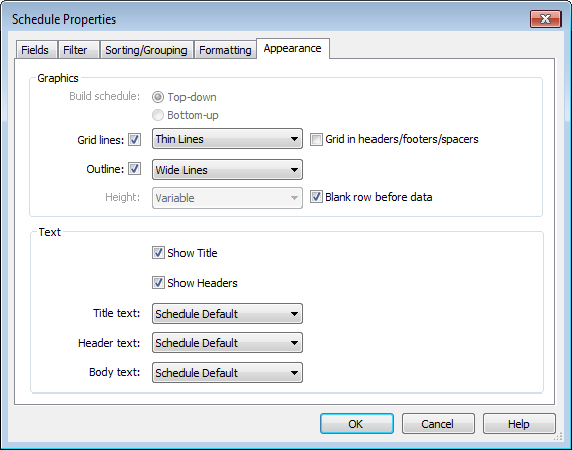
Figure 17.18 The Appearance tab
Once you’ve worked through each of the tabs in the Schedule Properties dialog box, click OK and you will see the working layout of the schedule. The schedule settings can be modified at any time, but this gives you a basis from which to begin. To modify the schedule, you can access any tab of the Schedule Properties dialog box from the five corresponding buttons in the Properties palette when the schedule view is active.
A special tab on the ribbon is active when you are editing a schedule. This ribbon is not available when you select a schedule that has been placed on a sheet. In this case, you must right-click the schedule and then select Edit Schedule from the context menu. The Modify Schedule/Quantities tab shown in Figure 17.19 has many new tools that enable you to modify field selection, hide columns, merge cells, and other functions that are similar to those found in Microsoft Excel.
Figure 17.19 The contextual tab in the ribbon for schedules

In addition to the various formatting tools in the contextual tab for schedules, you will find a panel named Parameters. The drop-downs in this panel allow you to select some cells in the schedule and point them to other parameters within the project. As an example, we inserted a row beneath the title row and set the left cell to Project Information: Project Number. The two remaining cells in that row were merged and the cell’s parameter was set to Schedule: Phase using the two drop-downs in the Parameters panel. As you can see in Figure 17.20, you can even change the phase of the schedule directly in the cell of the schedule.
Figure 17.20 Additional information can be added to a schedule with tools from the Parameters panel.

Another key feature of the contextual tab for schedules is the Highlight In Model button. This button allows you to select any element in the schedule and locate that element within the model. Let’s say you want to locate a particular door from your door schedule. Select the respective row in the schedule and click the Highlight In Model button; you will see a different view with that door highlighted. This technique can be a useful way to locate elements in the model, especially for larger models.
Now that you have an idea of the elements that compose a schedule, let’s explore the workflow with two exercises. You will first create a simple wall schedule within the c17-Sample-Building.rvt project file and then create a Useable Area schedule based on the areas you defined earlier in this chapter.
Making a Wall Schedule
In this exercise, you will create a schedule of building elements that is filtered to report only certain types of walls and is simplified to show only a summary of each unique wall type within the project. Make sure you have the c17-Sample-Building.rvt file open, and then follow these steps:
- Function
- Family
- Type
- Area
Figure 17.21 The finished wall schedule displays a summary of elements.
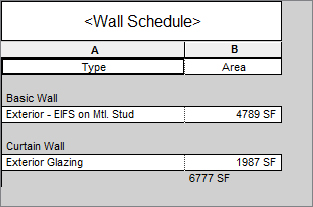
In this simple wall schedule exercise, you saw that a large amount of model data can be succinctly itemized and displayed using a combination of parameters within the elements. Only the exterior wall types were itemized, and the total area for each type was reported, including a grand total of all types.
Making an Area Schedule
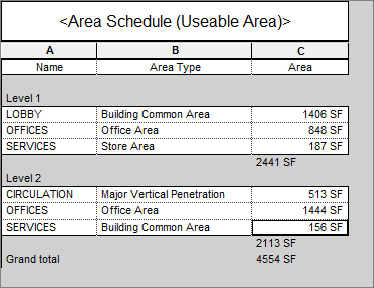
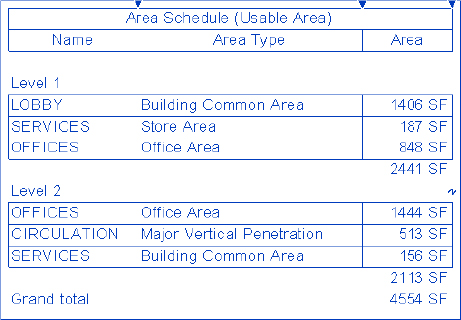
In our next exercise, you will create an area schedule specifically for the Useable Area scheme you established earlier in this chapter. The process is similar to that of creating a wall schedule.
If you are working through all the exercises in this chapter, continue with the c17-Sample-Building.rvt or c17-Sample-Metric.rvt file, otherwise, download the file c17-Area-Schedule.rvt or c17-Area-Schedule-Metric.rvt from this book’s web page. To create the schedule, follow these steps:
Figure 17.22 The final schedule is an organized list of areas according to their level.
Creating a Sheet List
Using a sheet list schedule, you can create a tabular view of sheets in your project—even including drawings provided by consultants. This type of schedule allows you to create placeholders for sheets that are not yet created or will not be a part of your discipline’s drawing set.
In the sample workflow, you have created area plans for the Useable Area scheme. Eventually, you may want to create another area scheme based on departmental spaces. You haven’t created them yet, but you want to create your sheet list, including the area plans that you will create later. To do so, follow these steps:
Figure 17.23 Converting a placeholder into a sheet
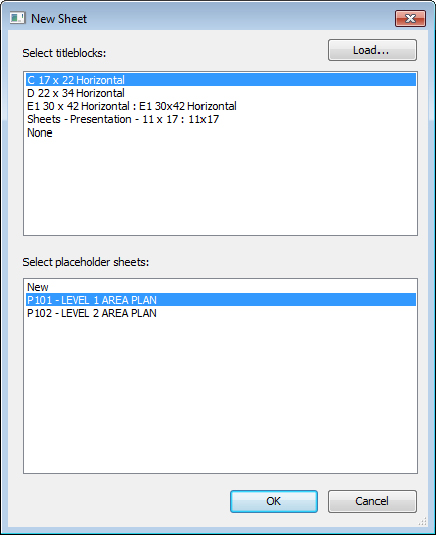
This will create a sheet from the line item in the schedule using the same name and sheet number. The new sheet will appear under the Sheet node in the Project Browser with the correct number and name. You will begin to add views to this sheet later in this chapter.
Legends
![]() As we mentioned earlier in this chapter, legends are unique views because they are the only view type you can place on more than one sheet. They can become great tools for things like general notes, key plans, or any other view type that you will want to have consistent across several sheets. It’s also important to note that anything you place inside a legend view—doors, walls, windows, and so on—will not appear or be counted in any schedules. Legend elements live outside of any quantities present in the model.
As we mentioned earlier in this chapter, legends are unique views because they are the only view type you can place on more than one sheet. They can become great tools for things like general notes, key plans, or any other view type that you will want to have consistent across several sheets. It’s also important to note that anything you place inside a legend view—doors, walls, windows, and so on—will not appear or be counted in any schedules. Legend elements live outside of any quantities present in the model.
The Legend tool is located on the Create panel in the View tab. There are two types of legends you can create from this menu: a legend, which is a graphic display, or a keynote legend, which is a text-based schedule. Both legend types can be placed on multiple sheets, but for this exercise, you’ll focus on the legend. The keynote legend will be handled in more detail in Chapter 18, “Annotating Your Design.”
As part of the sample workflow, you may want to present some of the wall types as part of your presentation package to demonstrate the Sound Transmission Class (STC) of the walls and the overall wall assembly. Since these wall types will be appearing on all the sheets where you are using them in plan, you’ll make them using a legend.
To make a legend, choose the Legend button from the View tab under the Legends flyout. Creating a new legend is much like creating a new drafting view. You’ll be presented with a New Legend View dialog box (Figure 17.24), where you can name the legend and set the scale. For this legend, name it WALL LEGEND and choose 1 1/2″= 1′−0″ (1:10) for the scale.
Figure 17.24 Creating a legend

The legend you’ve created will look like a blank view. At this point, it’s up to you to add content. The simplest type of legend would be adding notes such as plan or demolition notes that would appear in each of your floor plans. You could do this simply by using the Text tool and adding text within this legend view; however, in this example you want to add more than just text.
To add wall types or any other family to the legend view, expand the Families tree in the Project Browser and navigate to the Wall family. Expand this node and then expand the Basic Wall node. Select the Interior − 4 7/8″ (138 mm) Partition (1-Hr) wall type and drag it into the view.
With the family inserted into the view, it will appear as a 3′ (1000 mm)-long plan wall. Change your view’s detail level from Coarse to Medium or Fine so you can see the detail within the wall. With that done, select the inserted wall and look at the settings in the Options bar. These options will be consistent for any of the family types you insert. The Options bar for legend elements consists of three sections:
Let’s make some minor adjustments to the wall sample in the legend. Let’s change View to Section and change Host Length to 1′–6″ (500 mm).
The wall now looks like a sectional element. By adding some simple text, you can embellish the wall type to better explain the elements you’re viewing (Figure 17.25).
Figure 17.25 Add other annotation to embellish the wall type section.
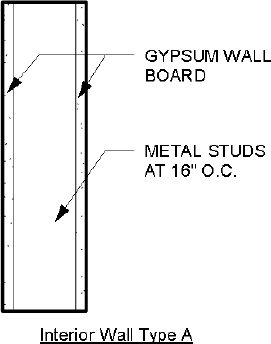
Continue the exercise by adding the Exterior – EIFS On Metal Stud wall type to the legend along with some additional text notes.
Laying Out Sheets
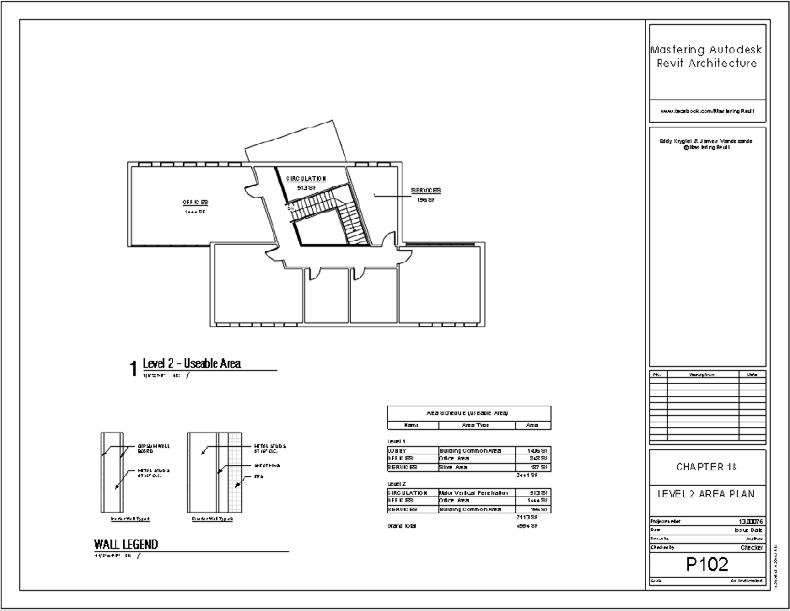
Throughout this chapter, you have created different kinds of views, including area plans, schedules and legends. Eventually you will need to lay those out onto sheets so they can be printed or exported as PDF or DWF and sent to others for review.
Creating sheets is easy. As you’ve already seen, you can create sheets through a sheet list schedule. You can also create sheets by right-clicking the Sheet node in the Project Browser and selecting New Sheet from the context menu. Regardless of which method you use to create them, in the following sections we’ll walk through laying out these views on sheets and show you how to manipulate each view further once it’s placed on a sheet.
Adding the Area Plan
In the following exercise, you will continue to use the c17-Sample-Building.rvt or c17-Sample-Metric.rvt file saved from previous exercises in this chapter:
Activating a view is like working in model space through a paper space viewport in Autodesk AutoCAD® software. You’re working on the actual view but you’re doing so while it is placed on the sheet. This gives you the benefit of seeing how changes to the view will affect the layout of the view on the sheet. For example, it could be undesirable to enlarge the crop window for the view to show more information on the sheet. Doing so will take up valuable sheet real estate and should be balanced by the amount of space the other views on this sheet need. You’ll also notice that once the view is activated, all the surrounding materials (the sheet and any other views) turn gray. This is to alert you to the fact that you’re working in the view and are not active on the sheet.
In this view, however, you want to make some modifications to the visibility and turn off the area boundaries so they are not visible when you print. To do this, open the Visibility/Graphic Overrides dialog box by pressing VG on your keyboard or navigating to the command via the context menu.
In the Visibility/Graphic Overrides dialog box, pan down in the Model tab (activated by default) and choose the Lines node. Uncheck the box for <Area Boundaries> and click OK. The boundary lines should disappear from the view.
Now you’re ready to get out of the activation mode and add some additional views to the sheet. To do this, right-click anywhere within the view and choose Deactivate View from the context menu.
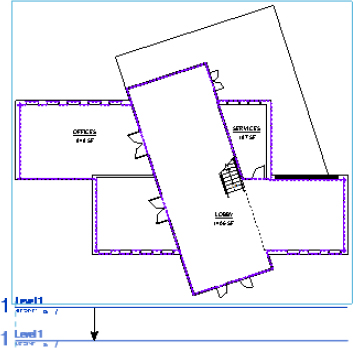
With the view on the sheet, you will want to make some other adjustments to help clean the sheet layout up a bit. One thing you will want to do is modify the view title’s location and length. To do this, select the viewport and the view title will activate. With the view title active, you’ll notice the blue grip at the end of the title line. By grabbing and dragging the grip, you can shorten the view title. Press the Esc key or click the Modify button in the ribbon to deselect the viewport.
Now select the view title itself—not the viewport—and then press and drag the title closer to the view itself (Figure 17.26).
Figure 17.26 Move the view title by selecting it directly, not by selecting the viewport.
Using Guide Grids
If you have multiple plans, elevations, or sections that need to be placed at the same location on a series of sheets, the Guide Grid command can help you manage this. Guide grids are nonprinting grids that can be associated with sheets. The grids allow you to snap or align elements such as reference planes, other grids, or crop regions to specific locations relative to the sheet border.
You can create as many unique guide grids as required in a Revit project. First, activate the P101 sheet to establish your first guide grid. Complete the following exercise before placing the next area plan on a new sheet:
Figure 17.27 Use Guide Grids to help align views among a series of sheets.

If you haven’t noticed already, model views of the same scale will always snap to each other without any special grids. What you might not realize is that this also works between views of different types as long as they are of the same scale. For example, you can drag an elevation from the Project Browser onto sheet P102 and see how it snaps in relation to the plan. Sections can also be aligned with elevations and with plans. Even 3D views can be aligned with each other.
Adding the Schedule
With the largest view, the area plan, on the sheet, you can use the bottom portion of the sheet to lay out your other views. For the second view, let’s add the area schedule you created. To do this, drag and drop it from the Project Browser in much the same way you added the area plan. The inserted view will look like Figure 17.28. You’ll notice some differences in how this view looks from the way a schedule looks when it’s not on a sheet. Specifically, you can now see the header text and the fonts you chose in the schedule properties. You’ll also be able to see the grid lines and their associated line weights from the Appearance tab of the schedule properties.
Figure 17.28 A schedule placed on a sheet

With the schedule on the sheet, it looks a bit tight. You have the ability to redefine the column spacing so you can make any visual adjustments to the schedule while it is on the sheet to help it read better. These adjustments do not change the actual schedule—just its appearance on the sheet.
To do this, highlight the schedule by selecting it. The schedule will turn blue, and you’ll have a few new grips to help you make adjustments (Figure 17.29). The blue inverted triangles will allow you to modify the column widths. Grab them and drag them left or right to change the column sizing.
Figure 17.29 A schedule’s appearance can be manipulated when it is placed on a sheet.
You’ll also notice a blue cut symbol on the schedule. This cut symbol lets you break the schedule into multiple vertical columns on the same sheet. This tool can be especially handy if you have a long schedule like a room schedule or door schedule and it has too many rows to fit vertically on your sheet. Selecting this tool will break the schedule in half (and you can break it into half again and again) so that you can take advantage of the horizontal real estate. If you choose to separate your schedule in this fashion, it will still retain all the necessary information and all the portions will continue to automatically fill themselves out dynamically as a single schedule would. You also have the opportunity to change the overall height of the schedule once it is broken up by grabbing the grips at the bottom of the schedule and dragging up and down (Figure 17.30). Doing so will draw or push rows from the adjacent schedule portion so that all of your information is continuous.
Figure 17.30 Changing the schedule height

To rebuild a split schedule—essentially returning it to a single list—select the schedule on the sheet so it highlights and the grips are displayed. Click one of the move icons and drag the split portion on top of the other schedule segment. The split schedule will then become whole again.
Finishing the Sheet
Now that you have those two views on the sheet, it is a simple matter to add the remaining views. To add the wall legend you created, you will drag and drop it from the Project Browser in much the same way you did with the other two views.
In this case, the wall legend came onto the sheet needing little modification. Following this same workflow, you can also add a drafting view from the imported detail to the sheet, completing P102 (Figure 17.31).
Figure 17.31 The finished sheet