
Session D
Managing projects

In Session A you learnt about the reasons why changes occur and some of the principles of managing change projects. In Sessions B and C you learnt about making a financial case for your change project. In this final session we will look at how you can manage a project successfully to achieve your goals.
In this session we will look at the practical aspects of project management, working through four clear stages of:
![]() Assess the feasibility of the project
Assess the feasibility of the project
![]() Plan the project
Plan the project
![]() Implement the project
Implement the project
![]() Review the outcomes of the project
Review the outcomes of the project
This four-stage structure is designed for smaller projects that a first line manager is likely to lead. Larger projects may need a more sophisticated project management framework, such as PRINCE 2. PRINCE stands for Projects in Controlled Environments and was developed by the UK government for managing government IT projects management. The updated version (PRINCE 2) is now used to manage all types of projects in government and outside. Many large-scale projects require the use of PRINCE 2 as a standard for all contractors, and you would need to undertake specific training to learn how to do this. However, the four-stage model you learn here will give you a grounding in the basics of managing smaller projects.
The first question you need to ask is about the feasibility of the project. Feasibility means asking three questions:
![]() What is being proposed?
What is being proposed?
![]() Can it be done?
Can it be done?
![]() Should it be done?
Should it be done?
In effect, that is what sessions A, B and C have all been about. In Session A we looked at what changes were needed (What is being proposed?) and whether or not the proposal was viable. On page 14 we asked the following questions and said that if the answer to any of these questions is ‘no’, the project is unlikely to be considered viable:
![]() Does the organization have to undertake the project, or is it discretionary? Assuming it is discretionary, further criteria must be applied.
Does the organization have to undertake the project, or is it discretionary? Assuming it is discretionary, further criteria must be applied.
![]() Has the organization the experience to deal with the project?
Has the organization the experience to deal with the project?
![]() Does the organization have the physical resources to carry the project forward?
Does the organization have the physical resources to carry the project forward?
![]() Is there the financial muscle to see the project through?
Is there the financial muscle to see the project through?
![]() Has the organization time within its other work to complete the project on schedule?
Has the organization time within its other work to complete the project on schedule?
![]() Does the project fit within the organization's plans?
Does the project fit within the organization's plans?
We then went on to ask ‘What can go wrong’ and said that a risk assessment should be done.

Activity 31
What are the two questions that you are trying to answer by your risk assessment?
Risk assessment is about assessing risk, just as its name says. In health and safety risk assessment you look at the hazards (what could go wrong) and the chance of any of the hazards actually causing an accident (the risks). In risk assessing a project you do the same thing. You ask what could go wrong and also what chance there is that it will go wrong. Too many projects are initiated because the benefits, if the objectives are achieved, are seen as worth the costs, without asking ‘What could go wrong?’. The chances are that the higher the potential returns (benefits less costs), the greater the risk.
2.1 Should it be done?
One question that all managers should be prepared to ask is ‘Should we do it?’. It may be financially worthwhile, it may be in line with the organization's objectives and fit with its plans.We may be able to afford it but should we do it? This is an ethical question, and is not one that can be answered by looking at rules and guidelines. You have to decide if it fits with your own personal, and the organization's, values.
The next stage is to plan the activity. You could use a logic diagram, critical path or network diagram or Gantt chart to help you.
![]() A logic diagram will help you to identify the key stages in the project and the order in which they should occur.
A logic diagram will help you to identify the key stages in the project and the order in which they should occur.
![]() A critical path diagram is a tool for estimating precisely the time a change project will take, and drawing up a schedule.
A critical path diagram is a tool for estimating precisely the time a change project will take, and drawing up a schedule.
![]() A Gantt chart, which is often in the form of a bar chart, shows all the key activities and when they should begin or end.
A Gantt chart, which is often in the form of a bar chart, shows all the key activities and when they should begin or end.
They are all designed to help you identify what tasks need to be done, sort them into approximate order of what must be done before other tasks can be completed, and the timescales for each task. From these you can allocate responsibility for each task and identify any other staff that need to be involved and the specific resources required. There is more about all three of these planning tools in the workbooks Planning Change in the Workplace and Understanding Change in the Workplace, but here we are going to concentrate on the Gantt chart, as that is probably the most useful in planning and tracking progress on smaller projects.
3.1 Gantt charts and managing projects
A Gantt chart is used to plan the timescale for a project and to organize the resources needed (usually people). (If you remember that a Gantt chart is a sort of ‘Time Tracker’ you will always get the spelling right: two Ts, not two Ns.)
Gantt charts were developed by Henry Gantt to help with the construction of ships during the First World War but they are more popular than ever today. A Gantt chart is a highly useful visual aid and is also simple to construct and easy to understand. If you have a Year Planner on your wall, you already have a form of Gantt chart.
Gantt charts show the time needed for each activity that makes up a project as a horizontal bar starting at the appropriate day, week or month of the project plan.
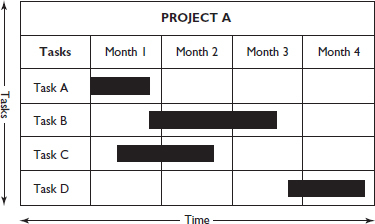
In this project we can see from the chart that we have to wait until task A is finished before we start task B, but task C can overlap to some extent with tasks A and B.

Activity 32
What else does this Gantt chart tell you about Tasks C and D?
You can see from the chart that you could probably delay the start of task C until about the middle of month 2 without delaying the project as a whole. However, task D cannot be started until task B is complete.
A useful addition to a Gantt chart is to use planned and actual bars, like this.


Interpret the chart for project B, commenting on each of the tasks and the relationships between them. Assume that it is now the Thursday of week 3.
The answer to this Activity can be found on page 87.
3.2 Gantt charts, software and managing resources
If your work involves a great deal of project management (one-off, fairly lengthy jobs, as opposed to a predictable daily routine) you will probably use specialist project management software such as Microsoft Project, which has all sorts of aids and charting tools built in, including the ability to create and update Gantt charts at the touch of a button. There are also specialist business graphics programs like Microsoft Visio that make it very easy to create complex Gantt charts.
A spreadsheet programme like Microsoft Excel does not have any built-in features devoted to project management. But that's not going to stop us using it to illustrate how helpful Gantt charts can be when it comes to managing the people and resources under your management.
Let's suppose you manage a multi-skilled workteam of 20 people, each capable of working on any of the tasks. Your team's next project involves seven tasks which you have codenamed A to G.
![]() Task A will take five days and require 12 people.
Task A will take five days and require 12 people.
![]() Task B will take five days and require 6 people.
Task B will take five days and require 6 people.
![]() Task C cannot be started until task B is complete. It will take two days and require 8 people.
Task C cannot be started until task B is complete. It will take two days and require 8 people.
![]() Task D, which can only be done when task A is complete, will need 4 people and will take one day.
Task D, which can only be done when task A is complete, will need 4 people and will take one day.
![]() Task E, which also has to wait for task A to be finished, will take seven days and will need 10 people to work on it.
Task E, which also has to wait for task A to be finished, will take seven days and will need 10 people to work on it.
![]() Task F cannot be started until task D is complete. It will take three days and it will need 12 workers.
Task F cannot be started until task D is complete. It will take three days and it will need 12 workers.
![]() Task G will take three days but can only be done when both task C and task E are complete.
Task G will take three days but can only be done when both task C and task E are complete.

Activity 34
Arrange this information in a table and then calculate the maximum number of days that the project could take. Can you think of any way of doing the project in a shorter time?
If you add up the number of days for each task you will find that it comes to 26 days. However, you can make it shorter by doing some tasks at the same time. For instance, tasks A and B only require 18 staff in total so they can be done at the same time, shaving five days off the total amount of time required.
| Task | Preceded by | Days | People |
| A | – | 5 | 12 |
| B | – | 5 | 6 |
| C | B | 2 | 8 |
| D | A | 1 | 8 |
| E | A | 7 | 10 |
| F | D | 3 | 12 |
| G | C, E | 3 | 6 |
You could work through all the rest of the data as we did above seeing where you could do tasks concurrently to shorten the project, but the quickest way is to draw a network diagram such as the one shown overleaf (project management software would produce one of these for you automatically).
Compare this with the information in the table to make sure you understand it. Next we add up the days on each of the paths.
ADF = 5 + 1 + 3 = 9 days
AEG = 5 + 7 + 3 = 15 days
BCG = 5 + 2 + 3 = 10 days
The thick line, path AEG, is known as the critical path because it is the longest path through the network. Nonetheless, the critical path represents the shortest amount of time to complete the project, assuming that there are no resource constraints.
However, we know that we only have 20 people available, so let's now draw a Gantt chart with one bar for the critical path and further bars for the remaining tasks that depend on each other. We've done this using a spreadsheet, as follows.
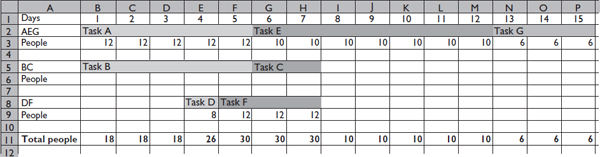
You can use a formula such as = SUM(B2:B10) in cell B11: the spreadsheet will simply ignore any information that is not a number.
From this we can see that on days 4 to 7 we are trying to do too much: we only have 20 staff but we are trying to do the work of between 26 and 30 people. This either means lots of overtime, or you will need to find another solution.

Activity 35
Set up a spreadsheet exactly as shown above. Can you use it to devise a better solution?
Don't forget to save your spreadsheet.
If you look at the Gantt chart the solution should be obvious. For instance, if you select the DF bar (cells E8:H9) and drag it to the right so that it occupies cells I8:L9 you have partially solved the problem. Only days 9 to 11 will then need more people (22) than you have available.
If you drag the DF bar a little further so that it occupies cells M8 to P9 you solve the problem completely.

What we have done is to use up the spare time we had on days 8 to 15 on ‘non-critical’ tasks. We have deferred the start of tasks D and F until the latest possible days. This also gives us a little bit of breathing space (spare resources) on days 8 to 11, which might be handy if any of the earlier tasks take longer than expected.

Activity 36
Have you ever used a Gantt chart before? If you have, how helpful did you find it to be?
3.3 Managing the process
Planning the project is one thing, managing it is another. How will progress against the tasks be monitored and controlled? When will the project team meet, who will convene and chair the meetings, prepare agendas and record outcomes? These detailed issues should all be settled before you start or they can cause serious problems later on because they don't happen or there are disputes about whose responsibility it is.
Having worked out the timetable for the project (perhaps by using a logic diagram, critical path diagram or a Gantt chart) you should identify key points at which to judge progress so far and review your plans. You do this by setting milestones. Milestones are useful stages in the progress of the project at which to assess:
![]() How well the project is progressing compared to the plans agreed.
How well the project is progressing compared to the plans agreed.
![]() How well the project team are working and what extra resources might be needed, or what unexpected barriers are being met.
How well the project team are working and what extra resources might be needed, or what unexpected barriers are being met.
![]() Whether any assumptions that were made in planning the project have proven to be false.
Whether any assumptions that were made in planning the project have proven to be false.
Each project team member should prepare their own personal Action Plan, identifying the activities they are committing themselves to engage in, the target outcomes and the timescale, and the necessary support they require. Review meetings to assess progress against the milestones are an opportunity for people to review and update their personal action plans.
It is also an opportunity to review any assumptions that were made in planning the project. This last point is often the one most often overlooked.
Alice was leading a team to introduce a new customer relationship management (CRM) system for a medium sized software company. The company sold specialist production control software to engineering businesses around the world. They employed multi-lingual sales engineers who were able to deal with enquiries from companies across Europe and North America. The CRM system was designed to cope with the different languages used by the team, including English, French, German, Russian, Italian, Spanish and Portuguese.
After six months work, during a meeting to measure progress against their milestones and discuss the final stage, going live with the new system, Paul, one of the team members, asks Alice ‘When will the Chinese and Japanese language versions be available?. Alice says they are planned for two years’ time when the company intended to expand into the Far East. ‘Oh’, says Paul, ‘haven't you heard? We have just acquired a partner in Hong Kong.We're recruiting new sales engineers next month.’
An important assumption that had influenced the project planning was that the expansion into the Far East would be two years down the line. Now, because an opportunity had arisen, the company was moving its plans forward, but had forgotten to tell Alice. This isn't unusual, and causes a lot of projects to be delayed. If you are clear about any assumptions you have made in planning your project, progress reviews should be designed to allow these to be reviewed as well as the progress against what you had planned for.
If you have planned the project effectively, tested its feasibility and secured backing for it by making a good financial case, then implementing the plan should be much easier. It's just a case of doing what you planned to do. You can use the Urgent/Important Grid to guide your day-to-day activities and prevent yourself being distracted.
| More urgent | Less urgent | |
| More important | Give these tasks your full attention, but don't rush into them. | Plan when you are going to do these and do them properly. |
| Less important | Delegate if you can. Otherwise, get them out of the way quickly so you can concentrate on what is important. | Does it need doing? Can you delegate? If it has to be done and can't be delegated, fit it round moreimportant tasks. |
Set clear targets and indicators of success so that you know if things are working and if they are not. Then, if things do start to go wrong, recognize the fact and review your plans, decide what you can still achieve and what may need to be sacrificed. Always be prepared to review and adapt the plan if necessary.
Plan flexibly; use the Shewhart (PDCA) Cycle:
![]() Plan (what you are going to do).
Plan (what you are going to do).
![]() Do (it).
Do (it).
![]() Check (if it's working).
Check (if it's working).
![]() (take) Action (to change things if needed).
(take) Action (to change things if needed).
Plans are there to help not hinder. Plan what you intend to do, start doing it and then check that things are working out the way you intended, before you continue, revising your plan if necessary.

The Shewhart Cycle, named after the pioneer in quality management, Walter Shewhart.
There are some crucial questions to ask at the end of your project, particularly:
![]() Did you achieve what you set out to achieve? Were your objectives achieved?
Did you achieve what you set out to achieve? Were your objectives achieved?
![]() Was the project within the budget you had agreed? Was any variation due to poor cost control or poor forecasting?
Was the project within the budget you had agreed? Was any variation due to poor cost control or poor forecasting?
![]() Did the participants perform as required?
Did the participants perform as required?
![]() What did you learn about yourself as a result of the project? What knowledge and skills did you learn through the project, both from formal training and from experience?
What did you learn about yourself as a result of the project? What knowledge and skills did you learn through the project, both from formal training and from experience?
![]() Do you intend to use any of this learning to progress your career? What steps do you intend taking to make this occur?
Do you intend to use any of this learning to progress your career? What steps do you intend taking to make this occur?
![]() Was the planned process appropriate? Was this the right way to go about achieving the goals of the project?
Was the planned process appropriate? Was this the right way to go about achieving the goals of the project?
![]() If so, how can the process be built on for future developments?
If so, how can the process be built on for future developments?
![]() If not, what changes would you make to future developments?
If not, what changes would you make to future developments?

Activity 37
Think about a project that you have been involved in the past. Review it by asking these questions.
![]() Did it achieve what it set out to achieve? Were the objectives achieved?
Did it achieve what it set out to achieve? Were the objectives achieved?
![]() Was the project within the agreed budget? Was any variation due to poor cost control or poor forecasting?
Was the project within the agreed budget? Was any variation due to poor cost control or poor forecasting?
![]() Did the participants perform as required?
Did the participants perform as required?
![]() What did you learn about yourself as a result of the project? What knowledge and skills did you learn through the project, both from formal training and from experience?
What did you learn about yourself as a result of the project? What knowledge and skills did you learn through the project, both from formal training and from experience?
![]() Did you use any of this learning to progress your career? What steps did you take to make this occur?
Did you use any of this learning to progress your career? What steps did you take to make this occur?
![]() Was the planned process appropriate? Was this the right way to go about achieving the goals of the project?
Was the planned process appropriate? Was this the right way to go about achieving the goals of the project?
![]() If so, was the process built on for the way that future projects are managed?
If so, was the process built on for the way that future projects are managed?
![]() If not, what changes would you make to the way that future projects are managed?
If not, what changes would you make to the way that future projects are managed?

1 What are the four stages in project planning?
2 In assessing the feasibility of a project, what three questions should you ask?
3 Complete the following statement:
In risk assessing a project you ask what ____________________ and also _______________ there is that it ____________ go wrong
4 What three tools could you use to help you plan a project?
5 Review points in the course of a project are called what?
![]() Benchmarks
Benchmarks
![]() Milestones
Milestones
![]() Critical incidents
Critical incidents
6 The four stages in Shewhart's PDCA cycle are:
Answers to these questions can be found on page 86.
![]() The four stages in the project management cycle are:
The four stages in the project management cycle are:
![]() Assess the feasibility of the project.
Assess the feasibility of the project.
![]() Plan the project.
Plan the project.
![]() Implement the project.
Implement the project.
![]() Review the outcomes of the project.
Review the outcomes of the project.
![]() Larger projects may need a more sophisticated project management framework, such as PRINCE 2.
Larger projects may need a more sophisticated project management framework, such as PRINCE 2.
![]() Feasibility means asking three questions:
Feasibility means asking three questions:
![]() What is being proposed?
What is being proposed?
![]() Can it be done?
Can it be done?
![]() Should it be done?
Should it be done?
![]() Risk assess a project to ask what could go wrong and what chance there is that it will go wrong.
Risk assess a project to ask what could go wrong and what chance there is that it will go wrong.
![]() To plan the activity you could use a logic diagram, critical path or network diagram or Gantt chart.
To plan the activity you could use a logic diagram, critical path or network diagram or Gantt chart.
![]() A logic diagram identifies the key stages in their order.
A logic diagram identifies the key stages in their order.
![]() A critical path diagram is a tool for drawing up a schedule.
A critical path diagram is a tool for drawing up a schedule.
![]() A Gantt chart shows when the key activities should begin or end.
A Gantt chart shows when the key activities should begin or end.
![]() Milestones are useful stages in the progress of the project at which to assess:
Milestones are useful stages in the progress of the project at which to assess:
![]() How well the project is progressing.
How well the project is progressing.
![]() How well the project team are working.
How well the project team are working.
![]() If any assumptions have proven to be false.
If any assumptions have proven to be false.
![]() Plan flexibly, using the Shewhart (PDCA) Cycle:
Plan flexibly, using the Shewhart (PDCA) Cycle:
![]() Plan.
Plan.
![]() Do.
Do.
![]() Check.
Check.
![]() Action.
Action.