
Project Scheduling

Learning Objectives
By the end of this chapter, you will be able to:
• Develop a network diagram from the work packages in a WBS.
• Perform a forward and backward pass on a network diagram.
• Identify the critical path and available float from a network diagram.
• Convert a network diagram into a Gantt chart.
Estimated timing for this chapter:
| Reading | 25 minutes |
| Exercises | 1 hour |
| Review Questions | 10 minutes |
| Total Time | 1 hour 35 minutes |
SCHEDULE DEVELOPMENT
Two scheduling tools are common in project management: the Gantt chart, which is essentially a bar graph over a calendar; and the network diagram, which shows the sequence in which activities will be performed. For small and medium sized projects, the Gantt chart is the most common and easiest scheduling tool; for very large projects, the network diagram is more appropriate.
Even when the Gantt chart will be used as the scheduling tool, it’s often better to lay out project activities and work packages as a network diagram first, then convert the information to the Gantt chart format. Here’s how to develop both tools.
A network diagram resembles a computer flow chart. To build a network diagram, use the “work package” sticky notes from your WBS. Do not use any “control account” sticky notes in making the network diagram.
The first step is to create a “Start” milestone for your project. A milestone is a work package that has zero duration and no associated work or resource consumption. In other words, a milestone is simply a signpost. Traditionally, a milestone is represented by the shape of a diamond in a Gantt chart, so some people turn a sticky note 45 degrees to indicate that a given work package is a milestone.
Next, lay out the subsequent work packages in the order they are to be performed. Activities can be dependent (following a predecessor activity) or parallel (performed at the same time as other project activities. Dependent activities are sometimes required by the logic of the work (for example, you can’t conduct a beta test of the training unless the training materials have been developed), and are sometimes driven by resources or other factors. (The same person can develop the workbook and the exercises, but not at the same time. If no particular order is demanded by logic, you can choose whichever order you prefer.)
When all activities have been placed and connecting lines drawn, create a “Finish” milestone. Connect all unlinked activities to Finish so that every work package has at least one predecessor and at least one dependent activity. Don’t leave any orphaned work packages.
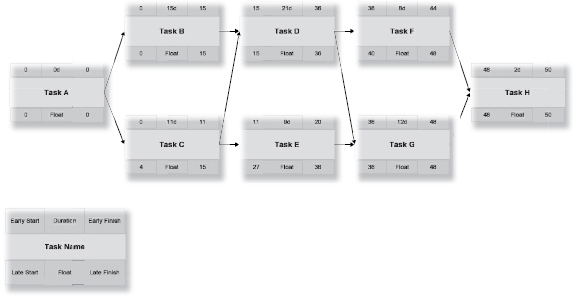
Normally, more than one sequence of activities is possible. As with the WBS, the correct order for your project is the one that represents how you and your team plan to approach this project. Exhibit 5-1 shows a sample network diagram.
Here’s how to read the network diagram in Exhibit 5-1. Task A is a milestone and serves as the start of the project. Both tasks B and C are dependent on the Start milestone. Task D is dependent on both tasks B and C; task E is dependent only on task C. Task F is dependent on task D; task G is dependent on both tasks D and E. Task H, the Finish milestone, is dependent on both tasks F and G.
Forward and Backward Pass
So, how long will the project take? With dependency relationships crossing from top to bottom and back again, the answer takes a little bit of calculation. You need to find the longest path through the project network to determine the length of the project. The longest path is commonly known as the critical path. If you use project management software, it will determine the critical path for you automatically. To calculate the critical path manually, you must perform a forward pass followed by a backward pass.
Forward pass. The forward pass calculates the early start and early finish for each activity. The final number in the forward pass calculation is the planned duration of the project. Exhibit 5-2 shows the forward pass.
xhibit 5-1
Network Diagram
This network diagram reflects the order in which work packages will be performed. Note that estimated durations have been assigned to each activity.


xhibit 5-2
Forward Pass

Exercise 5-1
Build a Network Diagram
In the blank space provided, take the sticky notes from the WBS you prepared in Exercise 4-2 and lay out a network diagram. Remember that you should only use the items from the lowest level (those that do not have any tasks below them in the hierarchy). Lay them out in the order they should be performed, remembering that some tasks can take place during the same time period as long as you have the resources available. Add a Start and a Finish milestone and connect the sticky notes with lines, so that at least one line enters each task and at least one line leaves each task.
Starting in the upper left corner of the first work package, you enter a zero, which represents the start of business of the first day of the project. Add the task duration to the start, and write that number in the upper right corner. In task A, the early start (0) is added to the duration (0) to get the early finish (0+0=0). Copy the early finish number into the connected tasks B and C, and add the respective durations (0+15=15 and 0+11=11).
Task E, you’ll note, is dependent only on task C, and can start on day 11. Task D, however, is dependent on both tasks B and C. Because task D cannot begin until both predecessor tasks are complete, it takes the larger of the two early finish dates, or day 15. Similarly, task G takes the larger of the early finish dates of its two predecessors, tasks D and E.
At the end of the forward pass you know the duration of the project. However, you aren’t done yet.
Backward pass. If you want the project to finish within its allotted 50 days, you will now calculate the late finish and late start of each activity, and make a backward pass as shown in Exhibit 5-3. The late finish is the latest an activity can be completed while still achieving the overall deadline. The late start is the late finish minus the task duration.
Tasks F and G can both finish as late as day 48. Task F can therefore begin as late as day 40, while task G cannot begin any later than day 36. Task D must finish in time to allow both tasks F and G to finish no later than day 50. This means that the lower of the two late start numbers (36 in this case) is the late finish of task D. The backward pass must end in zero when you reach the beginning of the project.
xhibit 5-3
Backward Pass
The backward pass calculates the late finish and late start of each activity, showing the latest any activity can be performed while achieving the original deadline.
The critical path is the longest path through the network, shown in Exhibit 5-4. On the critical path, there is no difference between the early start (or finish) and the late start (or finish) of each activity. In other words, any delay of a critical path activity results in immediate danger of a late project. A task is critical if there is no difference between the early start (or finish) and the late start (or finish). Any delay in a critical path activity delays the finish of the project.
Float is the amount of time that a task in a project network can be delayed without causing a delay to subsequent tasks (free float) or the project completion date (total float). A task can have delay equal to its float without affecting the project’s deadline. If the late start (or finish) is greater than the early start (or finish), the difference is total float. Exhibit 5-4 shows the critical path and available total float.
Notice that task C can start as early as day 0 but can start as late as day 4. It has four days of total float; extra time before lateness jeopardizes the project deadline. However, if Task C uses any of its float, the float available for Task E is reduced because Task E will no longer start on Day 11. The float is shared, not free. The float in tasks E and F, however, is free float, because no other task is affected if those activities use their available float.

Exercise 5-2
Identify Critical Path and Float
Perform a forward and backward pass on the figure below. Determine the critical path and identify available float.

The network diagram allows you to design the sequence of activities, but it’s not a very intuitive way to visualize how long the project will take. For that, the Gantt chart is much clearer. A Gantt chart is essentially a bar graph of the schedule in calendar time. Almost all project management software will display a Gantt chart easily, but you can use graph paper or a spreadsheet program if you don’t have a need for specialized project management software. Exhibit 5-5 shows the network diagram from Exhibit 5-4 converted to a Gantt chart (this one done in Microsoft Excel®).
Gantt charts help you assign resources and track progress; in a multiple project environment, they help you oversee the progress of all projects simultaneously. You can identify how resources are used across multiple project boundaries, and even compare different versions of the same project side by side.
Compare Exhibit 5-5 to Exhibit 5-4. Notice that each bar begins immediately following the Early Start on the network diagram, and ends at the Early Finish date. You can (and some project management software does) draw arrows to show dependency relationships, though that’s not strictly necessary.
Notice how your perspective changes now that you see the project displayed as a timeline. It’s much easier to see the substantial slack available to Task E, for example. You can also look down a particular date column to see how many different activities are taking place, so you can see if you have the resources available to cover the job assignments. If you don’t have enough resources, don’t worry. You can adjust your schedule in two ways: you can “level time” by adding resources to keep things on track, or you can “level resources” by shifting activities to the right until you’ve reduced resource requirements for any given time period to match available resources.
xhibit 5-4
Critical Path and Float

xhibit 5-5
Gantt Chart
This Gantt chart shows the network diagram from Exhibit 5-4 as a bar graph over time.
Exercise 5-3
Prepare a Gantt Chart
In this exercise, turn the network diagram from Exercise 5-2 into a Gantt chart using the form below.


In scheduling for individual projects, you must be able to use two common tools: the network diagram and the Gantt chart. While computer software exists to help you with these two tools, it’s not necessary — or even always appropriate — to do it that way. For small and medium-size projects, sticky notes and graph paper work quite well.
A network diagram resembles a computer flow chart. It’s made from the “work package” sticky notes from your WBS (those without any subordinate activities). Create a Start and Finish milestone and lay out the other activities in the proper sequence.
The forward and backward pass enables you to determine both the duration of the project and its critical (longest) path. Tasks that are not critical have float: extra time that does not directly affect the project deadline. For small projects, it’s desirable to know how to perform a forward and backward pass by hand; for larger projects, the software will perform the necessary calculations for you.
A Gantt chart is a way to display the information from the network diagram as a bar graph over a calendar. It’s the simplest and easiest to understand of the scheduling tools; even someone who’s never seen a project plan can usually understand a Gantt chart more easily than a network diagram. Like the network diagram, you can prepare a Gantt chart by hand using graph paper, or use computer software to prepare it.
The Gantt chart view provides a different perspective on the project. It’s often easier to see how resources fit together in a Gantt chart, and from there you can “level” the project, adjusting resources or timing as necessary to balance the work with the people available to do it.

Review Questions
|
1. The critical path is: (a) a list of the most important activities in the project. (b) the path with the greatest available float. (c) the longest path through the schedule network. (d) a recovery plan for a project experiencing difficulties. |
1. (c) |
|
2. For small and medium-sized projects, the most common scheduling tool is a: (a) network diagram. (b) Work Breakdown Structure. (c) PERT chart. (d) Gantt chart. |
2. (d) |
|
3. The first activity in a network diagram is: (a) a “Start” milestone. (b) the first work package in the project. (c) a dependent activity. (d) the kickoff meeting of the project team. |
3. (a) |
|
4. Two project management scheduling tools are: (a) the Work Breakdown Structure and project charter. (b) critical path analysis and WBS. (c) network diagramming and Gantt charts. (d) forward and backward pass. |
4. (c) |
|
5. The forward pass calculates: (a) the early start and late start of all activities. (b) the late start and early finish of all activities. (c) milestone dates for each activity. (d) the early start and early finish of all activities. |
5. (d) |