
14
Chest X-Ray for Pneumonia Detection
Sarang Sharma, Sheifali Gupta* and Deepali Gupta
Chitkara University Institute of Engineering and Technology, Chitkara University, Punjab, India
Abstract
Pneumonia is a medical condition that is related to lung inflammation. It affects pulmonary alveolus or alveoli, which are tiny air sacs found inside the lung parenchyma. It is responsible for exchanging carbon dioxide with oxygen. Pneumonia is generally caused by bacteria or viral infection. If untreated, it would lead to cystic fibrosis, chronic obstructive pulmonary disease, sickle cell disease, asthma, diabetes, and heart failure. Therefore, in order to diagnose this disease, chest X-ray, blood tests, sputum tests, computerized tomography, pulse oximetry, and pleural fluid culture are implemented. However, both doctors and radiologists rely heavily on its chest X-ray results. However, these techniques are time consuming and sometimes yield inaccurate results. Therefore, to avoid such lengthy and time consuming techniques, deep learning algorithms along with machine learning classifiers are implemented that are less time consuming, require less sophisticated equipment, yield results with greater accuracy, and are easy to implement. This paper focuses on deep learning architecture which makes use of Xception architecture that is based entirely on depth-wise separable convolutional layers. It utilizes machine learning classifier algorithms to extract pneumonia from healthy images and trains weights by implementing Xception architecture. This model effectively detects pneumonia with higher accuracy, recall, and better F1-score. With such results, this model could be utilized for developing clinically useful solutions that can be integrated along with IoT devices to detect pneumonia in chest X-ray images.
Keywords: Pneumonia, Xception, chest X-ray, deep learning, convolutional neural network, rectified linear unit, confusion matrix
14.1 Introduction
Pneumonia is a type of respiratory infection. This infection affects the lungs as they are made of tiny air sacs called alveoli [1]. These alveoli are responsible for transporting oxygen and carbon dioxide molecules in and out of bloodstream [2]. When an individual is affected with this disease, these air sacs or alveoli are then filled with purulent material containing pus or fluid. Due to these purulent materials, the individual is then subjected to cough, chills, heavy breathing, fatigue, diarrhea, intense sweating, muscle pain, delirium in case of elderly individuals, and cyanosis due to low oxygen levels in the bloodstream [3]. According to WHO, pneumonia alone is responsible for 15% of all deaths of children under 5 years of age and is estimated to have caused 808 fatalities in 2017 alone, among which 694 were children belonging to that age group.
However, most of these viral pneumonias are not fatal, and they also tend to live for a shorter time than their bacterial counterpart [4]. It generally affects to those individuals who have weaker body immunity system such as children below 5 years of age and elderly over 65 years of age and individuals having pre-existing medical conditions such as cystic fibrosis, asthma, HIV, or cancer [5].
In order to diagnose this disease, various tests are recommended by the doctors such as chest X-ray, blood tests, oximetry of pulse, sputum test, computerized tomography (CT) scan, and pleural fluid culture [6]. However, both doctors and radiologists rely heavily on its chest X-ray results [7]. Chest X-ray is a type of imaging test that is used to identify the diseases of blood vessels, bones, heart, and lungs [8]. It can also determine the presence of fluid or pus inside the lungs. In case for pneumonia, it is diagnosed by observing the white spots called infiltrates that signify infection, and if fluid is present, this is called abscesses or pleural effusions [9]. Further, the chest X-rays are relatively inexpensive as compared to other imaging tests that include CT, ultrasound, magnetic resonance imaging, and needle biopsy. However, these tests require prerequisite complex hardware and software [10]. With the help of latest IoT sensors, data extracted from machine learning algorithms could be beneficial and provide a significant insight and understanding of the individual diagnose with pneumonia. Hence, it would properly analyze, evaluate, and store data that could help in saving time and also improve the efficiency in clinical institutions [11, 12].
In order to overcome these complexities of hardware and software requirements, this paper encloses a novel scheme for classifying pneumonia affected lung images from healthy lung images by using machine learning classifier algorithm. These are then evaluated by using helper functions that are trained inside deep learning architectures, and as a result, learning curves and confusion matrix are plotted that yield accuracy, precision, and recall of the system.
14.2 Background
The literature studied for this study was majorly focusing on use of machine and deep learning techniques for early detection of pneumonia. A huge amount of literature is available, which can help to understand the nature of the problem and various solutions proposed for the respective problems. Sirazitdinov et al. [1] proposed a model that diagnosed pneumonia by highlighting specific regions on chest X-rays that could be easily identified by the physicians for cross-reference by using RetinaNet and Mask R-CNN in the journal Computers & Electrical Engineering. Jaiswal et al. [2] implemented a model that prevented overfitting and extraction on large images, provided deeper information, and reduced computation cost exponentially by using Mask R-CNN, F-RCNN, and FCN in the journal Measurement. Rajaraman et al. [3] evaluated, visualized, detected, and explained the performance of convolutional neural network (CNN) to detect pneumonia and distinguish bacterial type chest X-rays from viral types by using CNN, computer-aided diagnosis, and VGG-16 in the journal Applied Sciences. Abiyev et al. [4] published a research paper in the Journal of Healthcare Engineering, which showed good results on 32 × 32 pixels and yielded high recognition rates by using CNNs, back propagation neural networks, and competitive neural networks. Kermany et al. [5] effectively classified images for macular degeneration and diabetic retinopathy by using image labeling, transfer learning methods, and occlusion test in the journal Cell. Zech et al. [6] proposed a model that achieved better internal performance than external performance when they were trained on new pooled data than external data by using CNNs and computer-aided diagnosis in the journal PLoS Medicine. Lakhani et al. [7] proposed a model that showed better performance by dataset augmentation, which further improved its accuracy by using deep CNN and AlexNet in the journal Radiology. Morillo et al. [8] proposed a model that verified self-auscultation at one point could support pneumonia diagnosis in patients with chronic obstructive pulmonary disorder by using principal components analysis and probabilistic neural network in the Journal of the American Medical Informatics Association. Ginneken et al. [9] proposed a research paper that showed good results in early detection of cancer present in chest CT, mammography, and virtual colonoscopy by using computer-aided diagnosis and texture recognition algorithms in the European Journal of Radiology. Oliveira et al. [10] proposed a research paper that successfully discriminated bacterial etiology from absence of pneumonia with greater accuracy by using Pneumo-CAD system and Haar wavelet transform in the International Journal of Medical Informatics. Elzeki et al. [11] proposed a research paper to classify pelvis and lumbar spine by using machine learning with IoT and utilized SVM, linear regression, random forest, and neural networks to evaluate, compare, and classify input features. Glickman et al. [12] proposed a research paper that implemented artificial immune system framework that utilized LISYS method along with IoT that specialized for solution of network intrusion detection.
14.3 Research Methodology
Many studies and research have been conducted on lung disease but very less work has been implemented and published on prediction of pneumonia using deep learning by using Xception architecture; hence, it is the novelty of this project. Here, machine learning algorithm is applied to extract the features of pneumonia, and these are trained by utilizing Xception network architecture. Then, the results are displayed by plotting graphs of accuracy, loss, and determining model parameters validation values.
For the proposed solution, an open access dataset is used, which is available on kaggle.com uploaded by Paul Mooney and is named as “Chest X-Ray Images (Pneumonia)”. The dataset consists of two categories of normal or healthy lung images, which had 1,576 images and pneumonia had 4,265 images. Both of them are of size of 1,857 × 1,317 × 3. This dataset is simply divided into two parts. One part is known as training part and other is known as testing part with splitting ratio of 75:25, respectively. Dataset categories description is given in Table 14.1, and images of dataset samples are shown in Figures 14.1a and b.
In Figure 14.2, a fixed size of 224 × 224 X-ray image is applied as an input to first convolutional layer part 1 having height, width, and depth of 224 × 224 × 64, consisting a pixel window or kernel of 3 × 3, which selects the image feature.
Table 14.1 Dataset description.
| S. no. | Pneumonia | Number of images |
| 1 | Pneumonia | 4,265 |
| 2 | Healthy | 1,576 |

Figure 14.1 (a) Pneumonia x-ray image, (b) Healthy x-ray image.

Figure 14.2 Xception network architecture.
Then, this feature is passed on to the first convolutional layer part 2 having dimensions of 224 × 224 × 64, again consisting a pixel window of 3 × 3, which selects the feature passed on from the previous convolutional layer. Then, this feature is given to the first max pool layer having dimensions of 112 × 112 × 64, consisting pixel window of 2 × 2, which selects the maximum prominent features of the previous convolutional layer. Then, it is passed on to the second convolutional layer part 1 having dimensions of 112 × 112 × 128, which again consists of a pixel window of 3 × 3, which then selects the feature passed on from the previous max pool layer. Then, this feature is given to the second convolutional layer part 2 having dimensions of 112 × 112 × 128, consisting pixel window of 3 × 3, which selects the feature passed on from the previous convolutional layer. Then, this feature is given to the second max pool layer having dimensions of 56 × 56 × 128, consisting pixel window of 2 × 2, which selects the maximum prominent features of the previous convolutional layer. Then, it is passed on to the third convolutional layer part 1 having dimensions of 56 × 56 × 256, which again consists of a pixel window of 3 × 3, which then selects the feature passed on from the previous max pool layer. Then, the first batch normalization is implemented having dimensions of 56 × 56 × 256 with pixel window of 2 × 2 to normalize the previous convolutional layer by adjusting and scaling its activation functions. Then, these features are then given to the third convolutional layer part 2 having dimensions of 56 × 56 × 256, which again consists of a pixel window of 3 × 3, which then selects the feature passed on from the previous batch normalization layer. Then, the second batch normalization is implemented having dimensions of 56 × 56 × 256 with pixel window of 2 × 2 to normalize the previous convolutional layer. Then, these features are given to the third convolutional layer part 3 having dimensions of 56 × 56 × 256, which again consists of a pixel window of 3 × 3 which then selects the feature passed on from the previous batch normalization layer. Then, this feature is given to the third max pool layer having dimensions of 28 × 28 × 256, consisting pixel window of 2 × 2, which selects the maximum prominent features of the previous convolutional layer. Then, it is passed on to the fourth convolutional layer part 1 having dimensions of 28 × 28 × 512, which again consists of a pixel window of 3 × 3, which then selects the feature passed on from the previous max pool layer. Then, the third batch normalization is implemented having dimensions of 28 × 28 × 512 with pixel window of 2 × 2 to normalize the previous convolutional layer. Then, these features are then given to the fourth convolutional layer part 2 having dimensions of 28 × 28 × 512, which again consists of a pixel window of 3 × 3, which then selects the feature passed on from the previous batch normalization layer. Then, the fourth batch normalization is implemented having dimensions of 28 × 28 × 512 with pixel window of 2 × 2 to normalize the previous convolutional layer. Then, these features are then given to fourth convolutional layer part 3 having dimensions of 28 × 28 × 512, which again consists of a pixel window of 3 × 3, which then selects the feature passed on from the previous batch normalization layer. Then, this feature is given to the fourth max pool layer having dimensions of 14 × 14 × 512, consisting pixel window of 2 × 2, which selects the maximum prominent features of the previous convolutional layer. Then, flattening is implemented to convert the 2D array from the previous max pool layer into 1D array. Then, these arrays are given to three fully connected layers or dense layers having one 1,024, 512, and 2 channels, respectively. In between these channels, two dropout layers are also added, each having 512 channels. Then, soft-max activation function is applied to the resultant feature, which classifies the images into pneumonia and healthy images.
14.4 Results and Discussion
14.4.1 Results
The designed Xception architecture is applied on pneumonia images. There are some important parameters on which implemented Xception model relies completely on like batch size, learning rate, and number of epochs. The designed model architecture used batch size of 128, learning rate of le−3, and number of epochs of 50. Based on the parameters, Xception architecture was implemented on chest X-ray image, in which the training accuracy of the model was 94.48% and testing accuracy of the model was 88.78%. Model accuracy and model loss are shown in Figures 14.3a and b, respectively.
The epoch time taken by proposed model is 5,250 seconds that is 105 seconds per epoch. Table 14.2 shows the result of pneumonia images, and four model metrics have been taken that are accuracy, precision, recall, and F1-score.
14.4.2 Discussion
The paper describes an elaborate evaluation of the Xception architecture used to detect pneumonia in chest X-ray images. Through this paper, experience and knowledge were greatly acquired, which could be beneficial to the rest of the research community. The key points in this paper showed that model accuracy is not enough for showing good prediction at all. Therefore, by using Xception architecture, test metrics such as recall and F1-score outperformed the classification network parameters as obtained by Sirazitdinov et al. [1], Rajaraman et al. [3], Abiyev et al. [4], and Zech et al. [6]. Furthermore, the architecture used in this paper is unique and very less work has been implemented and published; hence, it is the novelty of this project. Precision is the preciseness or accuracy of the model for which the model successfully determines the actual positive values out of all predicted positive values, which also is an integral part of this paper and has performed better than precision obtained by Lakhani et al. [7], Morillo et al. [8], and Ginneken et al. [9]. Recall in the model calculates the actual positive values by labeling them as true or actual positive values.

Figure 14.3 (a) Model accuracy, (b) Model loss.
F1-score can be described as the weighted harmonic mean of precision and recall of test case. The F-score reached the most efficient value, which means precision and recall are best F-score at 1 value. However, the worst score is lowest precision and lowest recall at value 0. The confusion matrix is also given in Figure 14.4, in which healthy and pneumonia are depicted by 0 and 1, respectively.
Table 14.2 Model metric parameters.
| S. no. | Test metrics | Value (%) |
| 1. | Accuracy | 88.78 |
| 2. | Precision | 87.03 |
| 3. | Recall | 96.41 |
| 4. | F1-score | 91.48 |
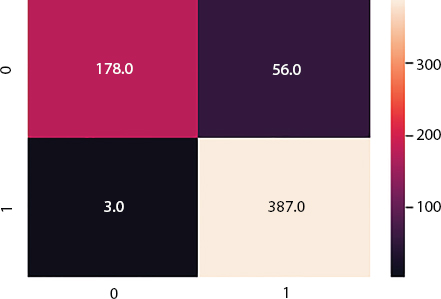
Figure 14.4 Confusion matrix.
14.5 Conclusion
Thus, this novel technique finds its huge application in healthcare industry. It effectively detects pneumonia with improved accuracy. It totally eliminates the use of invasive medical techniques. It could also become useful in improving efficiency in clinical settings by accurately identifying and aiding decision-making that could have a great diagnostic impact on resource constrained areas with a minimal loss.
Acknowledgment
The authors would like to express our deep and sincere gratitude to Dr. Rajnish Sharma and Dr. Archana Mantri for giving us the opportunity to do research and providing invaluable guidance throughout the research. As our professor and mentor, they both have taught us a great deal about scientific research in general and have shown us, by their example, what an exemplary researcher should be.
References
1. Sirazitdinov, I., Kholiavchenko, M., Mustafaev, T., Yixuan, Y., Kuleev, R., Ibragimov, B., Deep neural network ensemble for pneumonia localization from a large-scale chest x-ray database. Comput. Electr. Eng., 78, 388–399, 2019.
2. Jaiswal, A.K., Kumar, A., Kumar, P.T.S., Gupta, D., Khanna, A., Rodrigues, J.J., Identifying pneumonia in chest X-rays: A deep learning approach. Measurement, 145, 511–518, 2019.
3. Rajaraman, S., Candemir, S., Kim, I., Thoma, G., Antani, S., Visualization and Interpretation of Convolutional Neural Network Predictions in Detecting Pneumonia in Pediatric Chest Radiographs. Appl. Sci., 10, 2076–3417, 2018.
4. Abiyev, R.H. and Ma’aitah, M.K.S., Deep convolutional neural networks for chest diseases detection. J. Healthc. Eng., 12, 4168538–4168538, 2018.
5. Kermany, D.S., Goldbaum, M., Cai, W., Valentim, C.C.S., Liang, H., Baxter, S.L., McKeown, A., Identifying medical diagnoses and treatable diseases by image-based deep learning. Cell, 5, 1122–1131, 2018.
6. Zech, J.R., Badgeley, M.A., Liu, M., Costa, A.B., Titano, J.J., Oermann, E.K., Variable generalization performance of a deep learning model to detect pneumonia in chest radiographs: a cross-sectional study. PloS Med., 11, 1002683–1002683, 2018.
7. Lakhani, P. and Sundaram, B., Deep learning at chest radiography: automated classification of pulmonary tuberculosis by using convolutional neural networks. Radiology, 284, 574–582, 2017.
8. Morillo, S.D., Jiménez, A.L., Moreno, S.A., Computer-aided diagnosis of pneumonia in patients with chronic obstructive pulmonary disease. J. Am. Med. Inform. Assoc., 1, 20, 111–117, 2013.
9. Ginneken, V.B., Hogeweg, L., Prokop, M., Computer-aided diagnosis in chest radiography: Beyond nodules. Eur. J. Radiol., 2, 72, 226–230, 2009.
10. Oliveira, L.L.G., Silva, S.A.E., Ribeiro, L.H.V., Oliveira, D.R.M., Coelho, C.J., Andrade, S.A.L.S., Computer-aided diagnosis in chest radiography for detection of childhood pneumonia. Int. J. Med. Inform., 8, 555–564, 2008.
11. Elzeki, O.M., Sarhan, S., Abd Elfattah, M., Salem, H., Shams, M.Y., Biomedical Healthcare System For Orthopedic Patients Based On Machine Learning, ARPN Journal of Engineering and Applied Sciences, 16, 616–622, 2006.
12. Glickman, M., Balthrop, J., Forrest, S.A., machine learning evaluation of an artificial immune system. Evol. Comput., 13, 179–212, 2005.
- *Corresponding author: [email protected]