23
CASES
23.1 Bharatcraft.com—Business Logistics System for an Online Selling Store
23.2 Phantom Glass Ltd—Seeking Solution to Curb Wasteful Warehousing Practices
23.3 N-Joy Tobacco Company—Aiming at Best Practices in Distribution
23.4 Jolly Snack Food Products Company—A Case for Freight Rationalization
23.5 Kapil Health Food Products—Mapping the Supply Chain for Weak Linkages
23.6 Priya Namak Company—Revamping the Distribution Structure
23.7 Cadbury Products—Lean Supply Chain through Demand Management
23.8 MWC Ltd.—Looking Beyond the Role of Warehousing
23.9 ROX Doc-Care—Meeting Market Requirements of Document Warehousing
23.10 Gattu Welding Electrodes—Restructuring Warehousing Network
23.11 Suman Crop Protection—Moving to the Cost-Effective and Efficient Logistics System
23.12 Ashwini Pharma Pvt. Ltd.—A Case of Logistical Packaging for Exports
23.13 Aditya Digital TV—Deciding on Warehouse Locations
23.14 Karan Automotives Company—Restructuring Physical Distribution System
23.15 Mohini Electronics Ltd.—Supply Chain Initiative Reaping Benefits
23.16 Rubber Products—Redesigning Supply Chain on the Technology Platform
23.17 Tushar Enterprises—Consolidating Distribution Systems
23.18 Padmini Motors Ltd.—A Lean Supply Chain through the ‘Just-In-Time’ System
23.19 Dora Ceramic Tiles—Preparing to Meet Supply Chain Challenges of Tomorrow
23.20 Shree Cements—Freight Reduction through Transportation Mix
Case 23.1
BHARATCRAFT.COM*
Business Logistics System for an Online Selling Store
Bharatcrafts.com is a vertical portal for handicrafts from all over India. The portal is into online selling of handicrafts. This is a B2B and B2C portal. This company has no physical stores. They outsource 100 per cent of their product from the craftspeople and the same is then dispatched to the ultimate customer through the courier service. They have strategic alliances with the courier services and the craftspeople.
Whenever an order comes to them via the Internet, it gets processed and put into the sales and operations planning (S&OP) system. Here, in this system the order is checked to match it with the names of the craftspersons along with their addresses. The authenticity of the customer is checked by calling the telephone number provided by the customer; and for individual customers by the agents or regional office people. In case it is a bulk order from a dealer, then the reputation of the dealer is verified before placing the order with the craftspeople (see Figure 23.1.1).

Fig. 23.1.1
The craftsman is contacted via the Net if he/she has access to the Internet, or the message is conveyed telephonically. Delivery dates are confirmed from the concerned craftspeople and conveyed to the customer immediately. Payment can be made in two ways:
- Online transaction using the credit card
- Payment on delivery after authentication
A general inspection of the product is done to see that there is no slip or misplacement of the products. When the final product is ready, the courier service is notified and asked to pick up the package from the craftsperson’s site. If the craftsperson is not able to do the packaging, the packaging vendor is notified when the product is ready for packaging. After packaging and final quality inspection is done by the quality people, the goods are ready for dispatch and are then picked up by the courier people and dispatched to the customers.

Fig. 23.1.2
When the site goes in for an e-commerce set-up, the basic architecture will be as shown in Figure 23.1.2. When a customer shopping for handicrafts on the Internet orders an item online using a credit card, the processes that take place are as follows:
- Ordering: The customer enters the credit card details. She is presented with a summary of the items, price and billing information.
- Initiating the transaction: Encrypted payment information, secured with industrial strength encryption, is then forwarded to the merchant CyberCash cash register.
- Merchant picks up information: The merchant’s Internet storefront receives the encrypted payment message. The merchant’s identification information is automatically added. The customer’s credit card number remains invisible to the merchant.
- Through the CyberCash firewall: Still encrypted, the payment request is forwarded over the Internet and is received through a secure firewall by the CyberCash servers.
- From the cyber register to the bank: CyberCash instantaneously passes the payment request to the merchant’s financial institution or a third-party processor acting on behalf of the financial institution.
- From the cash register to the bank: The request for authorization is approved or declined by the consumer’s credit card bank or issuing financial institution.
- The bank sends approval: The response of the customer’s credit card bank or financial institution is returned to the merchant’s financial institution or the third-party processor. The response is returned to the merchant via the CyberCash cash register.
- Transaction complete and captured: The handicrafts product is delivered to the customer.
The costs associated with this transaction are as follows:
- The service provider’s set-up costs for a medium transaction site will be around Rs 20,000 per year
- Charges per transaction will depend on the type of credit card and vary from 2 to 3.5 per cent per transaction
A digital certificate costs around Rs. 10,000 to a few lacs, depending on the type of authenticity. To obtain it, one has to approach some valid parties such as CyberCash and VeriSign.
REVIEW QUESTIONS
- Explain the logistics system for online business store.
- How does the logistics system for online stores differ from the traditional method?
- What are the major issues in logistics for e-commerce trade?
Case 23.2
PHANTOM GLASS LTD.*
Seeking Solution to Curb Wasteful Warehousing Practices
In the year-ending review meeting called by Anil Jhunzunwala, MD, on 15 April 2001, Mahesh Pra-shad, General Manager, in charge of logistics, was pulled up by Ms Priyanka Agarwal, VP (Finance), who expressed her concern over the increased level of finished goods inventory that was creating cash flow problems. She also made remarks on the prevailing warehouse practices in the company, which were resulting in low productivity and higher warehousing cost. In defence, Mahesh Prashad tried to explain the situation based on the facts and figures he had with him and suggested some measures to overcome the problem.
The Company
Phantom Glass Ltd. is one of the leading glass manufacturing companies in India having an installed capacity of 32 million CSQM (600 tonnes per day) of float glass. The plant is located in western India at a prime location. The company is manufacturing a variety of international quality glass in technical and financial collaboration with a world-class manufacturer. The capacity utilization was 80 per cent during the last two years. This is much above the other producers of similar products in India. Phantom is making good headway in the market as the products are well accepted because of the world-class quality, and the prices are comparable to other available products in the market. Even in the prevailing recessionary trends in the market, the company registered an increase of 9.3 per cent in sales, similar to what they achieved last year, with the help of which they could maintain their market share at 20 per cent. The financial results for the past four years are shown in Table 23.2.1.
Table 23.2.1 Financial Result of the Period 1997–2001

Of the total production, 35 per cent is of premium quality glass used in the automobile sector, while the balance 65 per cent goes into other applications. Phantom’s 30 per cent sales are generated through exports.
The organization is headed by the Managing Director, assisted by the Vice Presidents, who head the technical, production, marketing, finance and material and logistics operations respectively.
The company is marketing its products through a network of four regional offices and 200 dealers. They have no material storage facilities at the regional level. The material after loading on to the carrier is unloaded at the customer’s or the dealer’s place. All domestic supplies are organized through road carriers.

Fig. 23.2.1 Organizational chart of phantom glass limited
Manufacturing Process
The main components of glass are silica sand (73–75 per cent), soda ash, magnesium and feldspar, which are weighed and mixed in batches, to which recycled glass (called cullet) is added in the proportion of 3:1. Cullet acts as a catalyst and thus reduces the consumption of natural gas that is used as fuel in the glass-melting furnace. The materials are tested and stored for mixing under computer control.
The batched raw materials pass from a mixing silo to the furnace, where they are melted at 1700°C. The molten glass is floated on to a bath of molten tin, which is less viscous than the glass and they do not mix with each other. This is done at 1000°C. The contact surface is perfect flat and the glass is in solid form.
After leaving the tin bath chamber, the glass in hard sheet form is passed through annealing chamber at 600°C. The hard glass sheets now pass over the roller. The annealing process helps in modifying the internal structure of glass and relieves it of internal stresses, enabling it to be cut and exhibit the desired physical properties. The glass surfaces from both sides are perfectly flat and need no grinding or polishing.
After cooling the glass sheets undergo rigorous quality checks and are then washed and sent to cutting section. The cut glass sheets are packed in wooden crates and stored for further dispatch to the customers.

Fig. 23.2.2 Glass manufacturing process
The Product
Phantom manufactures glass sheets in five different shades and thicknesses for a variety of applications. The sheets are cut according to customer requirements up to a maximum size of 9 ft × 16 feet. However, the most common size is 4 ft × 8 ft (see Table 23.2.2).
Table 23.2.2 Range of Glass Manufactured at Phantom Glass Limited
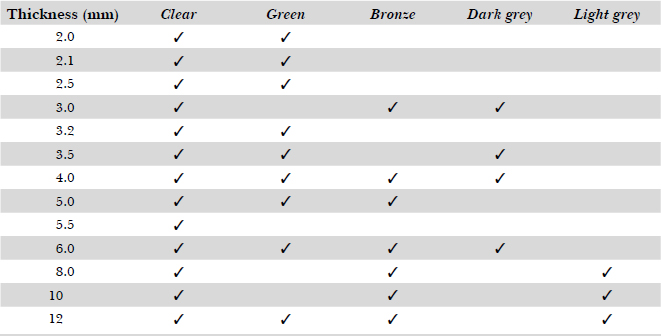
The major features of Phantom products are distortion-free and sparkling surface, thickness uniformity, high optical clarity, brilliant images when mirrored and higher strength for handling and usage. The product applications cover window glazing, curtain walls, partition walls, doors, shop fronts, furniture, mirrors, safety glass for automobiles, clocks, and so forth.
Logistics Operations
The logistics operations of PGL are handled by the General Manager, Mahesh Prashad, who reports to VP (materials and logistics). The customer service department (CSD) is under the GM—Marketing, who acts in close coordination with the logistics department (see Figure 23.2.3).
The customer requirements are conveyed to the logistics section by the CSD well in advance. Based on customer orders, the logistics section initiates the dispatch action. The flow chart in Figure 23.2.4 indicates the activities undertaken by the logistics department.
- Coordination with CSD The logistics department acts on the instructions of the CSD for material dispatches and maintains close coordination with them. However, due to delays in getting information on production schedules, the CSD department sometimes cannot give confirmed dispatch schedules to logistics. This results in part loading of the trucks, longer waiting for trucks (thus attracting the penalty), delays in loading and improper utilization of contract labour that are paid on a daily basis.

Fig 23.2.3 Reporting structure in the logistics department
- Load unitization in crates The glass sheets cut into various sizes are unitized in wooden crates. Phantom uses over 100 different sizes of crates for the customized requirement of glass sheet sizes by the customers. They use 10,000 crates per month. However, out of the total crate requirement, 30 per cent fall in size 8 ft × 4 ft, 20–25 per cent in sizes 16 ft × 9 ft and 10 ft X 8 ft, which is reserved for exports. The balance 50 per cent requirement of crates is in odd sizes (see Table 23.2.3).
The packaging cost for the domestic consignment is 8 per cent (due to the large number of odd sizes) of the product cost, while it is 5 per cent of the product cost for the export consignment.
- Allocate the storage space After the glass sheets are packed, the crates are moved to the warehouse for space allocation and storage. The area available for storing the finished goods is 2500 sq metre. The warehouse bay has two overhead cranes of 10 MT capacity each and two forklift trucks of 500 and 1000 capacity respectively. The crates are stored in the vertical inclined position. They have special ‘A’ type racks to keep the crates in the vertical inclined position at 95 degrees.
Table 23.2.3 Packaging Details of Phantom Glass Limited


Fig. 23.2.4 Material flowchart at logistics department

Fig. 23.2.5 Stacking arrangement of crates
These racks (600 no.) occupy more than 250 sq metre of floor area. As the product is stored in packed form in the crates, the area required for storage is almost 30 per cent more than for bare glass sheets. Due to space constraints in the warehouse, they store 250 CSQM of material per sq metre of warehouse floor space, while the international standard for easy and safe material (glass) storage and movement is 175 CSQM per sq metre of warehouse floor area. Due to legal constraints and the fragile nature of the product, they cannot plan for a multi-storey warehouse building. The order picking operation takes a lot of time due to the over-storage at warehouse. A lot of time is spent in removing the other crates to locate the right material and clear the movement path for the forklift. The breakage rate during material handling in warehouse area is on the higher side due to the congested storage arrangement.
- Organize the dispatches The logistics department is also involved in dispatch of the material from factory to various clients. The dispatch instructions are issued by the CSD. The contract labour are used for material movement and loading. The material is dispatched to customers and dealers through road carriers. The material is normally dispatched through tempos (6 tonnes), trucks (9 tonnes) and trailers (25 tonnes).
For the exports consignments, they use 20 ft dry, box-type containers. The material is loaded with the special ‘C’ type clamp developed for easy loading of the glass sheet crates inside the container. Due to lack of coordination between the CSD and the logistics departments, the trucks and the container trailers keep waiting for 2/3 days. The waiting attracts a penalty of Rs. 1000 for a container trailer and Rs. 500 for a lorry per day.
The productivity level at the logistics department is very low. In spite of engaging contract workers, they make 2/3 loads per shift as against the norm of 5 loads. They engage 5/6 groups per day to make the loads. Each group consists of five labourers and one supervisor.
On an average they dispatch 360–400 tonnes of material per day using a combination of the following vehicles:
25-tonne trailer
10–12 no.
9-tonne truck
8–12 no.
6-tonne LCV
10–15 no.
- Inventory management Inventory management is an integral part of the job responsibility of the warehouse manager. The stock control is manual. The warehouse staff spends much of their time in multiple manual entries. Without bar coding system, the material storage and retrieval takes a lot of time. Material tracking is a tedious task. The warehouse maintains an inventory of over 200 odd sizes (combination of thicknesses, sheet size and colours). Phantom’s marketing policy allows them to supply the material in customized sizes, which contributes to more than the 50 per cent of the company’s sales. The major problem is the inventory of the odd sizes, which at any point of time has more than 60 per cent of the share in value terms. The inventory movement observed during the past 12 months is shown in Table 23.2.4.
Table 23.2.4 Inventary Movement of the Last 12 Months at Phantom Glass Limited

Note: 1CSQM = 4.85 kg
The inventory turnover ratio at Phantom is 3.8, which is quite low as compared to the international standard that is in the range of 6–7.
REVIEW QUESTIONS
- To bring down the inventory-carrying cost, which includes the carrying cost for packaging material, would you suggest the storage of glass sheets in an unpacked condition and packaging only at the time of dispatch? Discuss the new system in light of the problems they may face.
- What measures would you suggest to Phantom to reduce the inventory level?
- In light of the storage density they are presently having, is this a case for additional warehousing space? Justify.
- How will you organize the logistics activity at Phantom for improvement in the productivity, effectiveness and efficiency of the logistics department?
Case 23.3
N-JOY TOBACCO COMPANY*
Aiming at Best Practices in Distribution
“Smoking is injurious to health”—a warning punch line, the statutory requirement that all tobacco manufacturers should print on all tobacco products leaving their factory. The warning is not deterring the smokers as is seen from the increasing consumption of cigarettes in the country. India is the second largest smoking market in the world consuming 950 billion sticks per year. The products include biddies, cigarettes, cigar, cheroot, and so on. Among the cigarette smoking countries in the world, India ranks eighth, consuming 102 billion cigarettes per year. The cigarette industry in the country is growing at the rate of 3.5 per cent per year.
An interesting feature of the cigarette industry is the presence of a wide array of brands. There are four major manufacturers of the product in the country. The Indian cigarette industry is marketing over 160 brands across the country. Out of the 160 brands, 45 brands come from N-Joy Tobacco Company (NTC) Ltd., which is one of the leading manufacturers of cigarettes in the country. These 45 brands together constitute a wide product spectrum offering varied prices, quality and sophistication to suit the different tastes and income levels of multitudes of cigarette users. NTC has a sales turnover of over INR 50,000 million and commands nearly 50 per cent of the cigarette market in the country. NTC is facing stiff competition in all the market segments. The management of the company believes that the survival of the company depends on brand management supported by an effective, efficient and innovative distribution chain. For gaining a competitive edge over their rivals, the management has identified three goals for the distribution supply chain:
- To make available 45 stock-keeping units (SKUs) at the 1 million retail outlets to reach 50 million smokers.
- To ensure freshness of stocks—product shelf life 2 months.
- Operating a cost-effective logistics supply chain through the proper management of critical cost elements such as inventory, freight and warehousing.
NTC currently has four factories of their own. In addition, they subcontract production to five other parties. Besides their own network of marketing offices, they service the clients through their wholesalers and retailers. The movement of goods from the factories to the ultimate consumer is explained in Figure 23.3.1.
NTC provides services to its consumers through a network consisting of its own marketing offices, which control the channel members, such as wholesale dealers, wholesalers and the retailers.
Marketing set-up
Regions—4 Regional Managers
Branches—20 Branch Managers

Fig. 23.3.1 Distribution diagram of the movement of goods
Circles—80 Area Sales Managers
Sections—180 Area Sales Executives
Dealers
NTC is having over 750 exclusive dealers spread over the country, who only deal in NTC products. They get the material from the C&F godowns as per the instructions of the branch office they are covered by. As the percentage commission on the sales is very low in the cigarette industry, these dealers work on sales volumes. They control a number of wholesalers in the region in which they operate. The exclusive dealers own a fleet of delivery vans for distributing the products to the wholesalers. These dealers also maintain a team of cycle salesmen who directly interact with retailers for getting orders, organizing supplies and collecting payments. Sixty per cent of the supplies are made through the cycle salesmen directly to the retailers and the balance 40 per cent through the vans to wholesalers.
Wholesalers
Wholesalers get their materials from the NTC dealer through the dealer’s vans. They supply the goods to the retailers twice a day through three or four wheelers. The van driver acts as the salesman and payment collector. The material is supplied against cash payment and no credit is offered to the retailers. The investment capacity of the wholesaler is 10–20 days. To control freight the focus is on distribution route planning. On an average the van salesmen make 4 million calls per annum to attend the retailers.
Retailers
They are the last link of the distribution channel and number over 10 million. Retailers generally have an investment capacity of 1 or 2 days. The requirement is small, but need high frequency supplies. They are attended by 8000 cycle salesmen and 1000 supervisors making 84 million sales calls and 6 million merchandizing and supervising calls per year.
The Marketing and Manufacturing Interface
The role of the branch offices is crucial in the coordination of field requirement with factory supplies. In the distribution chain, the dealers place the order on the branch office. The dealer gets the requirements both from the wholesalers and retailers. The branch office consolidates the dealer’s requirements, which is conveyed to HO (marketing) for all India consolidation in order to prepare the raw material procurement plan and the manufacturing schedules. The branch office draws the requirements from the factory.

Fig. 23.3.2 Manufacturing and marketing interface
Measures to Control
For managing 94 million calls per year, the NTL logistics manager proposes the following measures to manage the supply chain so as to reduce the logistics cost as a percentage of sales from 2.3 to 1.8 per cent.
- Sales Forecasting
- The expected forecasting accuracy ± 2 per cent (the variation of ±5 per cent in forecasting results in stockpile or stock depletion equivalent to the capacity of a small factory leading to high carrying cost or lost market)
- Bottom-up forecasting
- Develop forecasting model
- Funds Management
- No credit sales
- Open more collection centres
- Encourage dealers/wholesalers to have a higher stock-turnover ratio for higher ROI, instead of increasing the commission
- Collection responsibility on the wholesaler only
- Inventory Management
- Excise on cigarette is 60%. Hence, post-excise inventory (i.e., in-transit/pipeline) of minimum 4 days
- The inventory at factory before excise: 6 days
- Stocks with channel members (wholesalers): 6 days
- Factory should produce and dispatch strictly as per the branch orders
- Inventory and forecast review once a week
- Branches to directly order on factories
- Zero time lag between forecasting and ordering
- Transportation Management
- No delays: as a delay of one day in transit time costs INR 30 million as interest cost
- Daily interest cost on one truckload of material Rs. 3500
- Long route coverage and no transhipments
- Transit time bonus/penalty for transport contractors
REVIEW QUESTIONS
- Do you agree with the proposals of the logistics manager? If yes, what resources are required to implement the suggestions?
- Do you suggest any model for controlling the inventory?
- Do you agree that NTC should engage the services of a third-party service provider to bring effectiveness and efficiency in the system?
- How will you plan and implement the logistics programmes for meeting the requirements of the channel members?
- For effectively controlling the supply chain of NTC, do you foresee any limitations in planning and implementation of the information flow system?
Case 23.4
JOLLY SNACK FOOD PRODUCTS COMPANY*
A Case for Freight Rationalization
Snack food market in India is growing at 25–30 per cent per year. This is what the organized sector believes. The unorganized sector dominates nearly 50 per cent of the market. The local players sell both branded and unbranded products that are 20–25 per cent cheaper than the national brands. The unbranded products are supplied to small- and medium-sized restaurants, bars, clubs and pubs in bulk quantity. However, the branded products are popular among the educated elite and the young generation in urban areas. Due to the changing trends in lifestyle and adoption of western culture, food habits among Indian youths are showing a change. As a result, there is more inclination towards fun and enjoyment in life, which is reflected in food habits and living style of the younger Indian population, both in urban and semi-urban areas.
Company Background
Based on the market survey conducted in 1987 by Jolly Food Products Co. (JSFPC), a subsidiary of the multinational company set up a snack food plant at Patiala and Delhi to manufacture potato chips, baked cheese, fried pallets, and so on. Their mission is “to be people’s favourite snacks and be always available when required.” In the demanding market scenario, where staying ahead of the competition is a key challenge, the pace with which one responds is of strategic importance. With volatile demand, today the emphasis is on “make to sell rather than make to stock.” With high consumer expectations and the need for rapid response in marketing, distribution assumes more significance and provides the required competitive edge. Availability of material and products at the right time and place has become a prerequisite for creating long-term loyalty.
The market survey conducted by JSFPC, through country’s leading market research agency, on consumer perception indicates over 95 per cent customer satisfaction. The three product varieties introduced so far hit the markets and increased the bottom line of the company. But due to competition from the unorganized sector on the price front, Randeep Singh, GM (marketing) is worried about the distribution cost as a percentage of the product cost, which has been growing over the years and reducing the profit margin. On the other hand, due to cut-throat competition JSFPC is under tremendous pressure to keep prices at a level acceptable to the customers.
Problem Analysis
To analyze the distribution cost problem, Randeep Singh assigned the job to Lobo, an engineer MBA with four years of experience in the distribution of FMCG products, who joined JSFPC as logistics manager. He is with the company for the last one month. Lobo took it as challenge to show his worth to the company. He studied the current JSFPC distribution system that is reflected in the distribution chain shown in Figure 23.4.1.

Fig. 23.4.1 JSFPC distribution chain
JSFPC’s first phase of distribution from the factories to the C&F agents is more critical as it involves the long-distance freight-paid dispatches, with primary freight charges included in the maximum retail price (MRP). The distribution of the product from the C&F agent down to the retailer is taken care of by the channel members. The freight charges for secondary transportation from C&F agents down the line are taken care of by the channel members, who are compensated through commissions and quantity discounts. As the products are sent through open trucks, JSFPC encounters the following problems:
Transhipments
Due to the minimal weight requirements, the transporter sometimes clubs some other heavy goods with JSFPC products, resulting in transit damages. The trucks are sometimes not loaded to volume capacity because of varying product mix requirements.
Freight
JSFPC products occupy more space and hence the 9-tonne truck is underutilized in terms of the weight factor, resulting in higher freight charges per unit weight.
Damages
Transit damages in the open trucks is to the extent of 8–10 per cent due to improper handling, transhipments, protrusions, mixing with other cargo (no control over the transporter once a vehicle leaves the factory).
Pilferage
JSFPC have sometimes received complaints from C&F agents about short supplies, which usually occur due to pilferage of this tempting food product. The percentage is not so alarming but JSFPC wants to eliminate this.
JSFPC is packing the products in transparent plastic bags of 200 grams each. These bags are packed in cartons of average size 2 ft × 1 ft × 1 ft. The average dispatches of three stock keeping units (SKUs) during the last twelve months were:
SKU “A”—68 per cent
SKU “B”—25 per
cent SKU “C”—7 per cent
Proposed Solution
To get over the present problem, Lobo considered using closed containers for dispatch of the material from the factory to the C&F agents. He thought the closed box container would be the safer, faster and cheaper method of dispatching the material. JSFPC could enter into a contract with the transporter for container shipment on a long-term basis at the lowest cost. Logo first decided to compare the freight of open truck (9 tonnes) with the various sizes of the containers on the following basis:
- Rs per km
- Rs per cu ft
- Rs per kg
- Rs per case
The comparison of cases fitting into the open truck and the various sizes of containers is presented in Table 23.4.1:
Table 23.4.1 Container Size and Cases Occupancy

The major task before Lobo was to find out the optimum size of the container in place of the open truck. Once this exercise was over, the C&F agent’s base could be further enlarged. The freight economy with the reduction in transit damages and pilferages would ensure a lot of savings that will enhance the margins and may help in reviewing the MRP to face competition. Lobo worked out the freight for each of the above container sizes on per km, per kg, per cu ft and per case basis, the results are presented in Tables 23.4.2–23.4.9.
Table 23.4.2 Freight Ex-Delhi Rs per km

Table 23.4.3 Freight Ex-Delhi Rs per kg

Table 23.4.4 Freight Ex-Delhi Rs per cu ft

Table 23.4.5 Freight Ex-Delhi Rs per Case
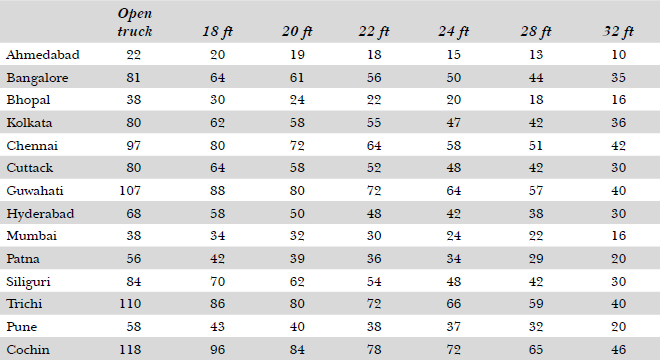
Table 23.4.6 Freight Ex-Patiala Rs per km

Table 23.4.7 Freight Ex-Patiala Rs per kg

Table 23.4.8 Freight Ex-Patiala Rs per cu ft

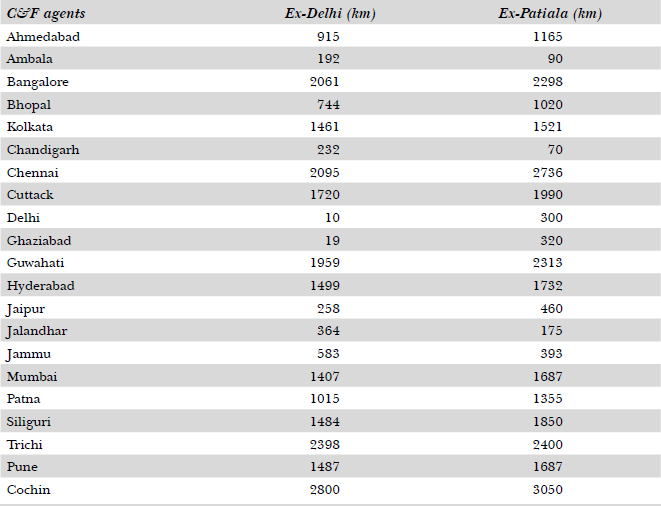
Table 23.4.9 Freight Ex-Patiala Rs per Case

Table 23.4.10 Geographical Distances Between Factories and C&F Agents
REVIEW QUESTIONS
- Which of the following is the most appropriate basis to assess freight charges for snack food products?
- tonnage
- volume
- cases
- kilometre
- Do you agree with Lobo’s approach to evaluate the problem?
- What are the other options that Lobo has for freight reduction?
Case 23.5
KAPIL HEALTH FOOD PRODUCTS*
Mapping the Supply Chain for Weak Linkages
A recent survey conducted by a leading Indian business magazine shows that health food products is one of the fastest growing industries in India. It is growing at 15–18 per cent per annum. The growing health consciousness among the educated families, particularly in the urban areas, is contributing to the growth of health food requirements. The health food concept is not new to India. Traditionally, educated mothers conscious about the health of their growing children fed them milk mixed with dry fruits or Chavan Prash (an Ayurvedic preparation) once or twice a day. However, during the past three decades the health drink companies have succeeded in convincing the mothers to switch over to ready-to-make food drinks for their school-going children. Branded products such as Horlicks, Bournvita, Maltova and Protinex, earlier recommended by doctors and used for ailing patients for speedy recovery of their health, now occupy the kitchen shelves. Due to the changing food habits and growing health consciousness among educated youth (both male and female), the consumption of the branded food drinks is growing every year. The total market for health food is estimated at 60,000 tonnes.
Company
Kapil Health Food Products was established in 1960 as a subsidiary of an American multinational pharmaceutical company with total capital outlay of INR 50 million. It started its manufacturing operations at Nahar, which is situated 325 kilometres west of New Delhi. The place is now well developed and has a population of 8500. It is located 800 metres above the sea level and witnesses a temperature variation of 5 to 47°C during the year. Nahar is a semi-urban town supported by the village’s economy. In 1980 the foreign holding of the company was diluted to 51 per cent with 49 per cent shares offered to Indian nationals and financial institutions. The company got registered as Kapil Health Food Products Ltd. As milk is the major raw material for the firm’s products, their major focus is on dairy development activities. They undertake programs such as animal health, animal nutrition, farmer development, animal breeding, animal insurance, mechanized milking, and so on. The company spends around INR 750 million per annum on the above-mentioned activities.
The operations at Nahar are managed by 20 managers, 60 executives, 120 staff, and 900 fulltime and 600 contract workers.
KHFL is a continuous success story since its inception in 1960. It is now a leading health food manufacturing company contributing 32 per cent of the total health food powder production in India. The major competition is from leading brands such as Bournvita, Boost, Horlicks and Nu-tramul Maltova. The company faces indirect competition from the health drink preparations of the Ayurvedic pharmaceutical companies in India. All together, they command around 10–12 per cent of the health food market in India.
Table 23.5.1 KHFL Success Story
| Parameters | 1960 | 2001 |
|---|---|---|
| Production capacity (1000 tonnes) |
2 |
35 |
| No of units | 1 |
4 |
| Factory area (sq yards) | 40,000 |
75,000 |
| No. of product lines | 1 |
14 |
| Manpower employed | 50 |
1700 (600 casuals) |
| Milk processed (litres/day) | 7000 |
1,50,000 |
KHFL is an ISO 9002 accredited manufacturing firm with a state-of-the-art manufacturing and packaging facility. The key equipments include the pilot spray drier with the latest technology and the automatic packaging line. They have an excellent environmental management system that includes an effluent treatment plant and eco plantation.
Products
KHFL runs three product lines—two for health foods (HOR and BOS) and the third for ghee. The company also supplies the products in bulk to the various repacking stations across the country to take advantage of freight economy. The following are the common sizes for product packaging (see Table 23.5.2).
Table 23.5.2 Product packaging at Kapil Health Food Products
| HOR | BOS | Ghee |
|---|---|---|
| 500 g | 500 g | 500 g, 1000 g |
| 1000 g | 2000 g, 5000 g 10,000 g |
The products are packed in polythene bags, corrugated paper boxes, cartons and tin containers. The company started automated packaging operation in 1995 using state-of-the-art machinery from Germany with a capacity of 60 packs per minute and capable of handling 200–1250 gram pack sizes.
Procurement
KHFL has a full-fledged procurement department headed by the procurement manager, who is assisted by a team of four purchase officers. The firm has developed its own software for material requirement planning. Since the number of raw materials handled is restricted to six, the management has good control on the inventory and the suppliers. Except milk, which is the major raw material, for all the other raw materials, the firm has restricted its supplier base to four to five selected vendors. The firm is very particular about the quality of ingredients going into its final products, and hence the vendor selection criteria are very scientific and conform to the ISO requirements. The firm banks on the reliability and consistency in raw material quality and delivery.
Table 23.5.3 Major Raw Materials Consumption (MT/day)
| Wheat Flour | 28 |
| Malted Barley | 26 |
| Malt Extract | 35 |
| Sugar | 8 |
| Milk Powder | 14 |
| Liquid Milk (litres) | 1,50,000 |
Packaging consumption (units per day) is 1800 tin containers, 250 cartons and 435 polythene bags. The total number of truck arrivals at the Nahar plant is 35 per day. The transportation cost is borne by the company.
The milk procurement is done within 55 kilometres of the area around the Nahar plant from 25,0 milk producers, 200 dairy farmers and 20 contractors and distant suppliers.
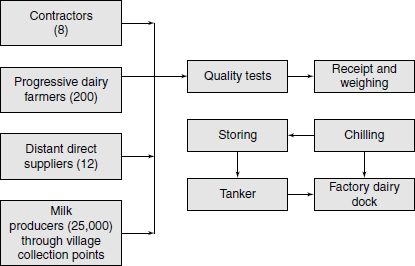
Fig. 23.5.1 Milk flow
Manufacturing Process
The process starts with mixing of malted barley and wheat flour. The mixture is washed, sieved for husk removal and finally squeezed. The squeezed mixture is then mixed with milk, oily vitamins, malt extract and other ingredients. It is further evaporated in two stages, oven dried, and undergoes a food scalping process. The mixture is mixed with sugar and further undergoes grinding and final mixing. The final product is health food in granular form that is taken to the bulk packaging section for quality clearance, and is afterwards stored in the warehouse. The bulk packages are sent to packing stations for making small packs as described before.
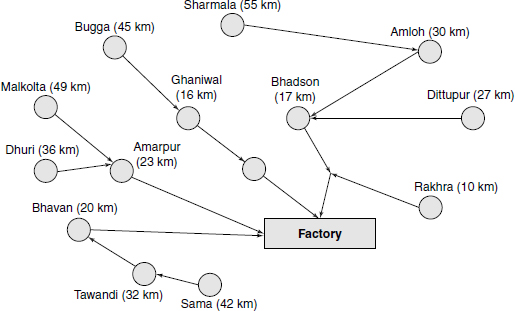
Fig. 23.5.2 Milk collection centres

Fig. 23.5.3 Manufacturing process
With few modifications and without major investment, the present installed processing capacity can be increased by an additional 30 per cent. This increased capacity will enable them to take care of the upcoming requirements in the next two years; provided the market share is maintained at the level of 60 per cent.
Finished Products Dispatches
They produced 35 kilo tonnes of finished products in 2001 averaging 100 MT per day. In the total production, health food contributes 95 per cent by weight and the balance 10 per cent is contributed by ghee. The break-up in terms of bulk and flexible packs is presented in Table 23.5.4.
Table 23.5.4 Packaging Sizes of Kapil’s Finished Products
| Bulk pack (drums/day) |
Flexible packs (dozens/day) |
|
|---|---|---|
| HOR | 270 |
1800 (500 g) 1450 (1000 g) |
| BOS | 170 |
1650 (500 g) |
| Total | 440 (13 trucks/day) |
4900 (5 trucks/day) |
Marketing Arrangement
KHFL is marketing its products through the dealer network. The firm has four regional offices at all the major metros headed by the regional managers, who report to the general manager (marketing) sitting at the Delhi head office. The regional managers are responsible for the sales administration, C&F agents, stockiest and wholesaler network in the region. Currently, KHFL has a network of 8 C&F agents, 45 stockists and 200 wholesalers. The products are sold through all grocery and pharma shops. The product requirement flows from wholesalers to the stockist to the regional office, which directs C&F agents for organizing dispatches. The regional offices prepare the forecast, which is forwarded to the factory for manufacture and execution. The replenishment at C&F warehouse is done as per the requirement of the regional office and the consumption pattern in the region. KHFL maintains 15/18 days stock of finished goods at the factory warehouse, 12/15 days at C&F agents and 8/10 days with stockists and 7/8 days with wholesales. Currently the order-filling rate at C&F warehouse is 89 per cent. Wholesalers are unable to fulfil two orders in every twenty orders placed by the retailers. The regional offices and C&F agents are connected online through VSAT. Due to the severe competition in markets, KHFP is in the process of reviewing its supply chain for cost reduction and enhancing its customer service. The management is planning to reduce the inventory to less than 10 days at factory and at C&F agents. The distribution cost at the present level of sales is 8.5 per cent, which they want to reduce by 40 per cent. In addition, they would like to reduce the inbound transportation cost through proper planning and scheduling.
REVIEW QUESTIONS
- Map the supply chain of KHFL for weak linkages.
- For improvements in critical areas in the KHFL supply chain, what measures do you suggest to reduce cost and improve customer service?
- The major cost-spinner in KHFL logistics operation is inbound transportation. Do you agree with this? How can it be reduced?
Case 23.6
PRIYA NAMAK COMPANY*
Revamping the Distribution Structure
The case of Priya Namak Company (PNC) deals with the distribution and packaging decision at multiple demand points of iodized salt. The supply is done from the source plant located on the west coast of Gujarat. At Priya Namak common salt is extracted from seawater through the natural evaporation process using sun heat. The whole process spans over a few months. The solid whitish material that settles after evaporation is common salt in crude form. It is processed for removing the impurities and further treated to bring the iodine content at the desired level. The finished product is called iodized salt, meant for human consumption. Iodized salt is a low-priced daily consumption product used in food preparation.
Iodine is used by the body to form thyroxin, an essential hormone. Salt is used as a medium for supply of iodine to the body. Because of the requirements of the thyroid gland and to reduce the incidence of goitre (an iodine-deficiency disease), a normal person needs about 75 mg of iodine per year. The country is now producing an estimated eight million tonnes of salt per annum, out of which three million tonnes (expected to rise to 10 million tones in the near future) is consumed by the industry. Of the total edible salt market, 75 per cent is served by unbranded products, 23 per cent by branded salt and the balance 2 per cent by specialized edible salt varieties. Out of the total packed salt around 55 per cent is accounted for by the large brands, and the balance 45 per cent of the market comprises of small local brands. Typically, the average salt consumption of a human being is 11–18 grams per day. Now, one can easily guess the bright future for manufacturers of iodized salt, considering the fast growing population and the consequent need for satisfying its salt requirement.
Priya Namak is the largest and the most integrated salt works complex in the country, generating over 2 million tonnes (p.a.) of solar salt. The company also manufactures a variety of chemicals for which the major raw material is salt. After the washing, sieving, grinding, evaporating and chemical treatment, the finished product obtained is iodized salt. Currently, Priya Namak is producing 1200 tonnes of vacuum-evaporated iodized salt per day and 2000 tonnes of other chemical products. The salt works and the processing plant are spread over 2500 and 650 acres of land respectively.
The company has a projects division comprising the research and development department, helped by a mechanical and detailed engineering department. Forming the backbone of its research-based operational policy, it has a computer-aided research, design, engineering and management centre equipped with pilot plant facilities, advanced computing facilities and a host of state-of-the-art software. The division is capable of carrying out plan simulations, basic engineering, project monitoring, planning and scheduling in all the disciplines.
The process equipment division of the company comprises a foundry, a workshop and control facilities. It has shops for melting and moulding, a fettling shop, a pattern shop, a machine shop, a fabrication shop, a heat-treatment facility and a testing and quality control cell. It is capable of manufacturing static equipment, seawater pumps and process pumps ranging from carbon steel, stainless steel and grey cast iron to titanium.
The engineering division comprises the construction, electrical engineering, instrumentation and maintenance departments. Equipped with a variety of facilities, it is capable of carrying out construction-related activities, including the building of heavy foundations, structural work, erection of plant and machinery (including boilers and turbo-generators) and the installation and commissioning of electrical, instrumentation and control systems disciplines.
For salt, Priya is one of the leading companies in the iodized salt segment with a considerably good market share compared to its national competitors.
Table 23.6.1
| Manufacturer | Market Share (%) |
|---|---|
| Priya | 36 |
| Brand A | 28 |
| Brand B | 12 |
| Others | 24 |
Priya had sales of about INR 150 crores in 2001 and exported 12,000 tonnes of iodized salt to the Middle East and East Asian countries. Priya is selling its “Priya—Common” iodized salt at Rs 7 per kg and planning to bring out a low-end brand “Priya—Janata” at Rs. 5 for the low-end market to convert the users of loose salt to the branded and packaged salt product.

Fig. 23.6.1 Distribution channel for Priya namak
Priya is currently operating through a single marketing agency that reaches the consumers through a network of 30 distributor-cum-C&F (carrying and forwarding) agents, 2500 stockists and 1,00,000 retailers. Priya was earlier doing the entire retail-packaging job at their Gujarat plant, which has now been shifted to field packaging at the C&F’s place. The company now dispatches the material in bulk through railways to the C&F agents in 50 kg bags in trainloads to economize on freight. On an average, each C&F agent procures 2000–2500 tonnes of iodized salt from Priya per month. Salt being an essential commodity, the demand for it does not fluctuate too much. However, each C&F agent keeps a safety stock of 50 tonnes, The C&F agent supplies the products to stockists in the required pack sizes of 500 g, 1 kg, 5 kg, and so on. The packaging is done according to the hygiene norms set by Priya. Depending on the sales volumes, Priya has appointed 30 packaging partners as C&F agents, with varying packaging capacity, all over the country. Salt in bulk is supplied to the packaging partner-cum-C&F agent as per the requirements of distributors, who in turn get their requirement from the stockist who is in touch with the retailers. Because of low unit price of the product, the logistics cost of salt distribution is to the tune of 54 per cent of the product-selling price. This means that for the one-kilogram salt pack selling for Rs. 7, the logistics cost works out to Rs. 4.05 per kg.
According to the ORG-MARG retail store survey for April 2002, the size of the iodized branded salt market is 15 lakh tonnes per annum; valued in monetary terms at about Rs 700 crores. Iodized branded salt market is estimated to grow at 20 per cent per annum. The market share of the national brands and the local brands in the iodized salt segment is 70 per cent and 30 per cent respectively. Priya continues to reap the early bird advantage, having 36 per cent share of the national branded salt segment. Due to an effective iodine-deficiency campaign, the penetration of branded iodized salt is about 20 per cent nationally. Even though manufacturers are trying to differentiate through attributes such as “iodized,” “granular,” “free flow,” and “vacuum evaporation” to influence the customer, the consumer preferences are for reputed brands and familiar names like Priya. The salt is a habitual product and the consumer does not prefer frequent brand switches. The housewife looks for the comfort level and the measure of salt. The outcome of the research, conducted by a leading market research organization in the country, is that the Indian consumer is willing to switch among a set of preferred brands, depending on the availability, personal preference and product offering. Similar to other FMCG products, if a consumer gets a certain branded salt free with other purchases, the chances that s/he may continue using that brand are increased. Hence, the market offering and the distribution muscle are the keys to success in the iodized salt market. Priya penetrates urban, semi-urban and rural markets through economy pack sizes and forms and product development for newer and more evolved offerings. The nearest rival of Priya has shown an average increase in market share of one and half percent in the last five years. It has already reached 1500 towns and has a network of 1150 distributors. As against the field packaging strategy of Priya, the packaging for Brand B is done at the factory.
Due to the growing competition, Priya felt a need for reviewing its distribution system and appointed a consultant to review the exiting system and suggest improvement. The consultant indicated that Priya has no direct interaction with channel members leading to the poor information availability about the market. The consultant suggested reducing one channel layer in the distribution chain. The consultant further observed that the distributor-cum-C&F agency is a single entity affecting the distribution, leading to the high level of outstanding payment and longer cash cycle. Therefore, the distributor and C&F functions need to be separated and Priya should directly deal with distributors, opined the consultant. In addition, Priya should IT-enable its distributor chain. The consultants were of the opinion that this structural change would help Priya to have better control over the distribution channel, information availability and a more dynamic response to market conditions. Further, they were of the view that with the new arrangement, Priya would also have better controls on inventory and outstanding payments. This would help Priya to reduce working capital needs and corresponding interest cost leading to higher sales and market share.
The consultants further made a remark that to remain in the leading position, Priya should continuously review its value delivery system. The commodity market will progressively move into the branded portfolio as long as the value delivery is in line with the product price. The margins will continue to be thin till the consumer perception of the differentiated values that brand offer over commodity changes significantly.
REVIEW QUESTIONS
- Review the outbound logistics process at Priya.
- Though Priya has an advantage of being early bird in the iodized salt market, but the next rival is aggressive in bridging the gap in market shares. As distribution is the key element in this market, discuss the logistical strategies Priya should adopt to retain its present position.
- Review the consultant’s suggestions in light of their merits and demerits.
- Does Priya face any barriers in implementing the suggestions?
Case 23.7
CADBURY PRODUCTS*
Lean Supply Chain through Demand Management
Sugar confectionary has seen a transformation with the conventional chocolate Eclair complemented by a host of fruit-filled, soft-centred, coffee, cream and caramelized candies. Broadly, the entire confectionary market can be divided into seven major categories, namely hard boiled (HBC), toffees, éclairs, chewing gum, bubble gum, mint and lozenges. The entire confectionery market in India is estimated to be 80,000 tonnes in volume and INR 7 billion in value terms.

Fig. 23.7.1 Major categories of the confectionery market
The Indian chocolate market grew at the rate of10 per cent per annum in the 1970s and 1980s, mainly among the children segments. However, in the 1990s the industry witnessed a growth of 12 per cent. ORG-MARG estimates that the chocolate penetrated just about 5 per cent of the Indian households in 2000 as against sugar-boiled confectionary that reached 15 per cent of households. Even considering the urban market alone, this category reached just 22 per cent of the urban consumers. Of the total market, chocolate segment constitutes 22,500 tonnes, which is INR 400 crores and is dominated mainly by Cadbury and Nestle.
In the late 1980s when the market started stagnating, Cadbury repositioned its Dairy Milk to an “anytime product” rather than an “occasional luxury.” Its advertisement focused on adults rather than children. Cadbury’s Five Star, the first count chocolate was launched in 1968. Due to its resistance to temperature, the Five Star has become one of the most widely distributed chocolates in the country. Other competing brands, such as GCMMF’s Badam Bar and Nestlé’s Bar, have minor shares. In the early 1990s, high cocoa prices compelled manufacturers to raise product prices and reduce their advertisement budget affecting volumes significantly. The launch of the wafer Kit Kat and Perk spurred volume growth in the 1990s. These chocolates were positioned as snack food rather than on indulgence as a platform, compete with biscuits and wafers.
Chocolates in India are consumed as an indulgence and not as snack food.
The consumption of chocolate in India is extremely low compared to the foreign countries. In India it is around 160 g in urban areas compared to 8–10 kg in the developed countries. In the rural areas it is still less.
Cadbury, a subsidiary of Cadbury Schweppes, is a dominating player in the Indian chocolate market with brands like Dairy Milk, Five Star and Perk. Dairy Milk is in fact the largest selling chocolate brand in India. Chocolates contribute 64 per cent to the Cadbury sales turnover. The confectionery sales account for 12 per cent of the turnover. Cadbury is attempting to expand its confectionary product portfolio with the launch of sugar-based confectionary such as Googly and Fruitus. But it is not a success story. In malted health drink Cadbury has a strong brand Bournvita, which accounts for 43 per cent of the sales turnover.
Cadbury continues to dominate the chocolate market with about 70 per cent market share. Nestle has emerged as a significant competitor with about 20 per cent share. The key competition in chocolate is from Amul and Campco, besides a host of unorganized sector players. Cadbury enjoys 4 per cent market share in confectionary product segment, wherein the leading national players are Nutrine, Ravalgaon, Cadico, Parle’s, Joyco India and Perfetti. The MNCs such as Joyco and Perfetti have aggressively expanded their presence in the country in the last few years.
The malted drink category covers white and brown drink. White drink accounts for two-thirds of the 80,000-tonne market. The south and the east are the largest consuming regions in India for food drinks. Cadbury Bournvita is the leader in the brown drink (cocoa-based) segment. In the white drink segment SmithKline’s Horlicks is the leader. The other significant players are Heinz (Complan), Nestle (Milo), GCMMF’s (Nutramul) and other Smithkline brands (Boost, Maltova and Viva). Cadbury holds 14 per cent share in the health drink market.
Despite tough market conditions and increased competition, Cadbury managed to record 11 per cent top-line growth in 2000. The company achieved a volume growth of 5.2 per cent. This was achieved through innovative marketing strategies and focused advertising campaigns for the flagship brand Dairy Milk. The net profit of the company rose by 41.8 per cent to INR 520 million in 2000. The reduced material cost, effective and efficient logistics operations and tight controls on working capital enabled the company to grow. The company added 6 million consumers and saw the growth of its outlets to 4.5 lakhs and consumers to 60 million.
The Cadbury management has cut down on its growth target by setting a 10 per cent average volume growth for the next three years (as against 12 per cent growth in volume and 20 per cent in value earlier targeted). Coupled with inflationary price increases, this could translate into a top-line growth of 14–15 per cent. This target is also difficult to achieve due to consumer slowdown and the fact that company is dependent on a single category of chocolate to drive growth. In the malted food drinks category, the company faces stiff competition from Smith-Kline Beecham and market share is stagnant around 14 per cent despite company’s efforts and investments in repositioning the brand. Efforts at expanding the confectionery portfolio have also not yielded the desired results. The management has declared its intension to focus on Éclairs in this category for the time being. In chocolate the onus is on 2–3 brands, which have supported growth in the past. Cadbury dominates the Indian chocolate market with 70 per cent market share.
Table 23.7.1 Product Categorywise Contribution to Cadbury’s Scales
| Product Category | Contribution in sales turnover (%) 1994 |
Contribution in sales turnover (%) 2000 |
|---|---|---|
| Chocolate | 59 |
64 |
| Sugar confectionery | 9 |
12 |
| Food drink | 32 |
24 |
Cadbury’s main manufacturing facilities are at Thane (Maharashtra), Gwalior (Madhya Pradesh), Hydrabad (Andhra Pradesh) and Pune (Maharashtra). Cadbury also outsources manufacturing to third parties (vendors) located at Phalton, Warna and Nashik in Maharashtra. The raw material is procured from Uttar Pradesh, Gujarat and Maharashtra.
Table 23.7.2 Cadbury: Income and Profit Growth
| Year | Income (INR million) |
Profit after tax (INR million) |
|---|---|---|
| 2001 | 6263.2 |
597.2 |
| 2000 | 5711.4 |
523.1 |
| 1999 | 5110.8 |
412.3 |
| 1998 | 4283.3 |
264.2 |
| 1997 | 3541.4 |
185.7 |
| 1996 | 3118.0 |
203.2 |
Source: Annual Reports
The company controls its marketing operations through four regional offices located at Mumbai, Delhi, Kolkata and Chennai. Under each branch there are four to six depots managed by carrying and forwarding agents (CFAs). There are 27 CFAs located across the country. The material is supplied to CFAs from four warehouse hubs located at Thane, Gwalior, Hydrabad and Pune. These CFAs supply the material to 2100 stockists, which in turn serve 4,50,000 retailers. The company has a total consumer base of 60 million.
Fig. 23.7.2 Marketing supply chain at Cadbury’s
As the product melts above 35°C, the Cadbury warehouses are installed with temperature-controlled facilities. The CFAs store the products in cold storages with the storage area varying from 2000 to 5000 sq ft. The hub warehouses are bigger with the area varying from 20,000 to 45,000 sq ft, depending on the demand in the region. The product is transported through refrigerated vehicles. The average pack size is 2′ × 2′ × 2′ with a maximum weight of 20 kg. Cadbury has excellent connectivity with branches, CFAs and stockists. The company has a well-developed and extended IT support for the distribution network. Cadbury is attempting to improve the distribution quality. To address the issue of product stability, they have installed Visi coolers at several retail outlets.
For product transportation, Cadbury uses two types of vehicles—the insulated (for chocolates) and the non-insulated (for other products that are not temperature sensitive). In 85 per cent of the cases they go in for containerized vehicles, while in the remaining 15 per cent they use open trucks. All consignments are full-load trucks.
Currently, the company is outsourcing transportation to various parties. In the insulated vehicle category are included NFT, Fresh Express, Assam Transport, Haryana FC, Interstate and others, while the dry-type vehicle category includes Best, DRS, Shivalaya, East India Transports and TCI. The logistics cost on the distribution side is around 10.5 per cent of the sales value. The contribution of transportation cost and warehousing cost in the logistics cost is to the extent of 45 and 55 per cent, respectively.
Cadbury is presently maintaining 15 days finished goods inventory at its various warehouses and 18/20 days at the CFA’s place. For cost reduction the management is planning to reduce the inventory level further down to 8/10 days at warehouse hubs and 15/16 days at CFA’s place, without losing on the market front. The major deciding factor is the demand accuracy. Although the firm has excellent connectivity with the warehouses and CFAs, it has no direct interaction with the retailers and the customers.
REVIEW QUESTIONS
- What measure/s should the company adopt for reduction of inventory level, without compromising on customer service and market share?
- Does Cadbury need to undertake any major changes in its distribution network?
- Discuss the nature of logistics programmes the firm needs to evolve for different channel members?
- “Demand management is essential for operating a lean supply chain.” Discuss. How should Cadbury tackle the issue of demand management for chocolates?
Case 23.8
MWC LTD.*
Looking Beyond the Role of Warehousing
Warehousing Industry
Warehouses in India are divided into two broad categories: (1) warehouses for agricultural produce and (2) warehouses for manufactured products. The warehouses for food grain storage are well organized, as these are mostly under government control. There are two major public warehousing organizations, e.g. Central Warehousing Corporation and the State Warehousing Corporations. They cater to a part of the government’s food grain procurement requirement in handling and public distribution system. In addition to these, Food Corporation of India (government controlled) has a network of its own warehouses, exclusively devoted to the public distribution system. The other agencies are run by the cooperative sector at the village and the taluka levels for storage of food grains. However, the total storage capacity of these agencies (39 million tonnes) is inadequate to take care of the food grain production in the country, which is at the level of 210 million per annum.
For manufactured products the traders and manufacturers use either private, pubic or contract warehouses, or a combination of these, for storage of goods for distribution. This industry is highly fragmented. The privately owned public warehouses offer a variety of services to the depositors and there is stiff competition among the service providers. However, these warehouses do not operate on economies of scale and use manual material-handling methods. As a result, the profit level in these warehouses is low. After liberalization, due to market needs, many foreign-based logistics service suppliers have entered the market and are offering integrated logistics service solutions to their clients. They are building mega-capacity warehouses to operate on scale economies and using the latest technologies to enhance productivity and speed in delivering the products to clients.
MWC Profile
MWC Ltd. was established in 1950 in the state of Maharashtra with two warehousing centres. It is one of the oldest warehousing corporations in India. Over a period, MWC has grown into 130 warehousing centres with a total storage capacity of 10 million tonnes in 2001.
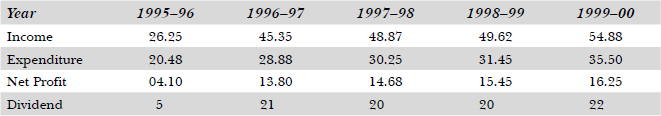
In the beginning MWC was storing stocks from primary agricultural producers and local traders. However, slowly MWC has expanded its activities and started storing all types of agro-based products and fertilizers produced in the country. It started with accepting cement and fertilizer from private and public sector undertakings for storage. MWC is now catering to the needs of importers and exporters through bonded warehouse and container freight stations. It also started storing cotton bales from cotton growers. Ever since its inception MWC is continuously making profits. The financial performance of the company during past five years was excellent and they offered not less than 20 per cent dividend to their shareholders during the period.
Table 23.8.1 Financial Performance (INR Crores)
MWC warehousing space growth is one of the fastest in the industry. It is adding more than 50,0 tonnes of storage capacity every year since the last 4–5 years. The compound growth observed was 10 per cent per annum.
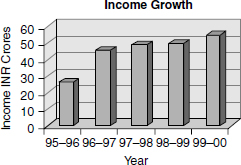
Fig. 23.8.1 Income growth

Fig. 23.8.2 Warehouse capacity growth
The firm’s storage capacity is mostly used for the storage of food grains and other agro-based products. The depositors are mainly cooperatives, public sector undertakings (PSUs), fertilizer firms, traders, and so on.

Fig. 23.8.3 Productwise utilisation

Fig. 23.8.4 Depositorwise utilisation
With the changing face of trade and commerce due to liberalization of the Indian economy, MWC is facing severe competition from the logistics service providers who are developing their network of warehouses and providing integrated logistics services. Further, the MWC’s warehouses are mostly constructed for storage and handling of food grains and agro products.
Business Portfolio
Warehousing Centres. The firm has 130 warehousing centres with 10 million tonnes storage capacity in the state of Maharashtra. These centres are located at the major district and taluka levels and at the major food grains and cotton seed producing and trading centres in the state. The products stored are food grains, cereals, pulses, spices, oil cake, coffee seeds, newsprint reels, cement, fertilizers, sugar, jaggery and industrial products. The storage of industrial products is done at the major industrial centres such as Pune, Nashik, Mumbai, Aurangabad, Jalgaon and Nagpur. The industrial manufactured products contribute 18 per cent of the throughput in tonnage per year. The average storage capacity of one warehouse centre varies from 1800 to 18,000 tonnes of food grains. At one warehouse centre there may be 3–10 buildings, each of such building is 140′ Lx 70′ Wx 30 Ht and can store 1800 tonnes of food grains. The inside storage arrangement is similar to the one indicated below. The maximum permissible storage height of the food grain stack is 15 layers of sacks, each of 3′ × 2′ size, which contains 100 kg of food grains. The storage space in the building is divided into 12 segments, each 30′ × 20′ size and with sufficient space in between the segments for ventilation and movement of persons.
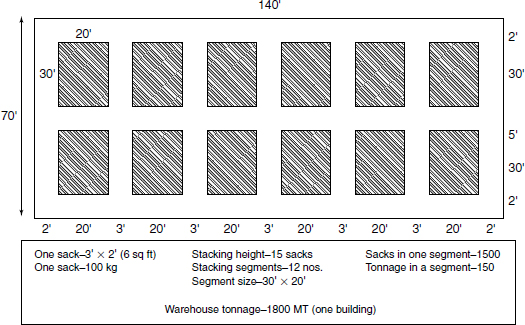
Fig. 23.8.5 Storage arrangement for foodgrains
A good percentage of the warehouses (50 per cent) is more than 20–25 years old and was built to support the public distribution system of the government. The storage capacities of MWC are divided into six regions:
All the warehouses were designed and built for the purpose of storage and handling of agro-based products. Some 3–6 persons, depending on the capacity of the warehouse and the level of throughput, manage each of these warehouses. The stock turnover ratio of these warehouses for food grain is around 8–12, depending on the location. After liberalization of the Indian economy in 1991, MWC began storing products from the manufacturing sector as well. The company finds storing these is remunerative and hassle free, especially from the point of view of less decay and damages during storage, which is otherwise a normal feature for food grains storage. This activity was undertaken by the company at a few places like Mumbai, Pune, Aurangabad, and Nagpur. The stock turnover ratio in the case of industrial products they discovered was 15–18. The warehousing charges for food grains were Rs 4–5 per sq ft per month (food grain being an essential commodity, there was government involvement in distribution and rate fixation in consultation with FCI), while for industrial product they were charging a 30–40 per cent higher rate, according to the warehousing industry practices. Currently, the FMCG companies are shifting their focus from urban to rural markets. They are on the lookout for a warehousing chain to stock their product at strategic locations across the state of Maharashtra so as to penetrate the rural market. This is an excellent opportunity for MWC to deploy its warehousing chain for storage and distribution of products form the manufacturing sector and earn more profits.
Table 23.8.2 Regionwise Storage Capacity of MWC
| Region | Number of Warehouses | Capacities (000 tonnes) |
|---|---|---|
| Pune | 20 |
1650 |
| Mumbai | 8 |
750 |
| Sholapur | 14 |
950 |
| Aurangabad | 12 |
1100 |
| Jalgaon | 22 |
1600 |
| Parbhani | 20 |
1550 |
| Nagpur | 21 |
1430 |
| Nashik | 13 |
970 |
| Total | 130 |
10,000 |
Customs Bonded Warehouse. MWC is operating customs bonded warehouses for import-exports cargo. These warehouses are located in a few places like Mumbai, Pune, Aurangabad, Nahsik, Thane, Navi Mumbai, Jalgaon, Ratnagiri and Nagpur. The business is remunerative because in most of the cases manufactured industrial products are warehoused and the charges are to the depositor’s account. The storage rates here are similar to those for industrial products. However, this accounts for 6–8 per cent of the total business of the company.
Container Freight Stations. To cater to the needs of exporters, the firm has started four container freight stations at Pune, Nagpur, Mumbai and Jalgaon. This is a highly remunerative business and requires a great deal of coordination among the exporters, container-leasing firms and customs authority. Container freight stations (CFSs) are totally devoted to the exports business. However, the firm has plans to expand in this area of business for domestic cargo movements.
Cold Storages. This is a new area wherein the firm has recently entered. MWC has set up a 1000 MT cold storage facility at Navi Mumbai for storage of perishable agricultural products such as fruits and vegetables. The construction cost of the cold storage is around Rs 3000 per MT as against Rs 300–400 per MT storage capacity for dry cargo. Due to the ever-increasing electric power tariff rates, the operating cost is very high. The facility needs to be run on economies of scale for cost advantage. The major cost-spinner in this business is electric power. MWC is planning to use an emerging technology like the ammonia absorption system wherein the energy requirement is 15–18 per cent less than the conventional system run on electricity. There is an excellent scope for cold storage business, as the cold storage capacity is merely sufficient to store 9–10 per cent of the total fruit and vegetable production (110 million tonnes) in the country. According to the surveys conducted by the government and other private agencies, 33 per cent of fruits and vegetables produced in the country perish before these are consumed or processed, mainly because of inadequate cold storage infrastructure in the country. Another area for cold storage requirement is floriculture products, which have great export potential. Currently, cold storage facilities are in great demand in the floriculture, pharmaceutical, horticulture and food processing industries.
Organization Set-up. The firm is headed by the managing director, who is assisted by the general managers heading operations, finance, engineering, administration and business development. The business development department looks after site selection for new warehouses, feasibility study and market development activities. The engineering department is responsible for construction of new warehouses; maintenance of the old ones; and maintenance of the food grain stocks through usage of pesticides and fumigation process. The operations department is concerned with the marketing of storage space, market development and maximizing the storage capacity utilization of the firm. The present average capacity (floor area) utilization over the year is 75 per cent.
In order to avail of the emerging marketing opportunities in a highly competitive environment, The MWC management has done a SWOT analysis to take stock of the situation for formulating a strategic plan for future growth.
Strength
- Excellent warehousing network and geographical coverage
- Huge storage capacity
- Known for food grain storage
- Established customer base
Weakness
- Capacity utilization on the lower side
- Low stock turnover ratio
- Small capacity warehouses
- Manual material-handling facilities
- Traditional way of connectivity in the network
- Low productivity
Opportunities
- Increased trading and distribution activities for manufactured products in FMCG, pharmaceutical, retail chain, automobile and lifestyle products industries, because of liberalization of the economy and emergence of WTO directives
- Other areas of logistics such as transportation, packaging, inventory management in great demand in the manufacturing and trading industry
Threat
- Proliferation of a new breed of logistics companies (mostly with foreign associations) offering integrated logistics solutions
- New logistics companies offering value-added service
- Logistics companies creating mega storage capacities with technology backup to have economies of scale
REVIEW QUESTIONS
For remaining competitive the MWC has to answer the following questions:
- How to increase the productivity of the system?
- Should the company continue to store food grains (where business is assured) or make a shift to storage of manufactured products (facing competition)?
- Whether to continue as warehousing service provider or change the role to an integrated logistic service provider?
- What other logistics products can be offered to the customer as value addition?
- Does MWC need a restructuring of the organization?
Case 23.9
ROX DOC-CARE*
Meeting Market Requirements of Document Warehousing
NEW CONCEPT
ROX Doc-Care (RDC) offers a complete documentation management solution for any organization in India. This Indian venture was started by a group of young professionals for providing the services of warehousing for storage, handling and retrieval of the physical documents over a period, as specified by the depositing company. In today’s cost-conscious and competitive environment, the organization needs to have a complete control over the information documented in the physical or digital form. Organizations are under strategic and legal pressure to keep the documents accessible (to the concerned parties) for information contained therein anytime. These services are, traditionally, organized by the business firms internally. However, many firms pose problems in the maintenance of documentation over a longer period of time due to inadequate resources, or because of an unwillingness on the part of the management to allocate the funds to create such a facility, which is not regarded as a core area of their business operations. The solution to this problem is to outsource this service to someone who is expert in the area and does it for you efficiently and effectively at the least cost. Looking at the growing need of the corporate clients and potential market for such services, RDC started this venture in Mumbai in 1995. This is the first time such services were made available in India to the corporate clients.
RDC provides an efficient IT-enabled storage and physical retrieval system for all major physical documentation media including papers, computer disks, tapes, (master audio and video tapes), films, optical disks, X-ray films, blueprints and product samples. The company’s services include pickup and delivery, filing and organizing, retrieval and destruction of records, database management, and management reporting. The key business drivers of RDC are:
- Providing rapid access to data and reaching the physical data at the right time and place
- Reliability, consistency and confidentiality in services
BUSINESS PROCESS OUTSOURCING
Business process outsourcing (BPO) is gaining momentum in Indian markets. Outsourcing has become an accepted trend after the liberalization of the Indian economy in 1991. In the Indian market the BPO vendors, especially in the CRM and transaction processing segments, are developing rapidly. So far companies in the BPO segment have focused on business development and building delivery capabilities and have grown organically. In the medium-to-long term, tier I companies seek to scale up rapidly, and the rest will expect consolidation to occur either by acquiring tire II/III companies or through mergers among them. Currently, Indian companies offer specialized services or multi-process solutions, such as treasure management, fund administration, customer support, telemarketing, logistics and HR functions. These companies will further build up expertise in multiprocessing in an effort to add value to their offerings. BPO vendors are currently bagging basic people-intensive projects, as the whole movement towards BPO is relatively new and expected to gain momentum in future. The future trends will not be simply to outsource a single function, but to outsource a whole process. This is similar to what clients today prefer: buying a complete system on turnkey basis rather than procuring the individual system components, parts or product and integrating or assembling it themselves. The companies will outsource the entire HR department as opposed to outsourcing only the payroll function.
In the current scenario, organizations store their physical documents either in their office areas or at off-site locations. Some of these documents are required to be stored for statutory purpose, but most are accessed once or twice a year. This leads to inefficient and expensive use of space, which carries a price premium in most central locations in the metros. Hence, systematic record keeping and corporate archiving are important for future referrals.
RDC SERVICE OFFERINGS
RDC advises and also undertakes the job of managing and maintaining the past records and documentation of organizations on a scientific basis. Large business companies, corporate houses, insurance companies, consultants, government establishments and banks can use these services, provided there is a requirement of security and accessibility of documents over a longer time period. RDC services portfolio covers the following services:
- Physical storage of record and documentation in a state-of-the-art warehousing facility
- Timely retrieval of the data/files
- Filing management
- Making the data/files/documents web enabled
THE PROCESS
RDC first assesses the need of the client by the documents’ volume, variety, age, criticality and proposed storage period. The legal contract is signed after the terms are mutually accepted. RDC collects the documents from the client’s place. These documents may be in the form of office files, tapes, floppies, films, and so on. The documents are brought to RDC’s warehouse. The transportation of the documents is done through RDC’s specially designed vehicles. They have various sizes of vehicles suitable for the type and size of documents to be picked up and transported. The documents are verified at the client’s place and also at RDC’s warehouse. Then, they are cleaned, dust-proofed and pest-controlled.
The documents are sealed in polythene bags with the vacuum process to ensure protection from environmental degradation. RDC has developed specialized cartons and packages for unitizing the records for keeping them in easy-to-move package sizes. Currently these cartons are available in 1.1 and 1.6 cu ft volumes and are made up of five ply 125 GSM corrugated paper boxes with customized interlocking buttons. This process is done in the closed room with controlled ambience. The bar code labels are put on the documents and also on the cartons for identification during storage and retrieval process.
RDC has 2 lakhs sq ft of warehouse floor space with a maximum storage height of 30 ft. The specialized storage system is installed for different types of documents. They have shelves, racks and closed cupboards for storage for different types of documents.
The retrieval of the documents will be on the basis of the client’s urgency and at the request of an authorized person. The documents may be retrieved and referred to at the RDC warehouse or they can be taken to the client’s place as per the requirement. These referrals will be on the basis of per-use charges, while the charges for packing are on a one-time basis and for storage on a monthly rental basis.
TRANSPORTATION
RDC is committed to deliver the documents stored in their warehouse to the client located anywhere in Mumbai within four hours of the intimation. The RDC has dedicated vehicles for handling the transportation of the preserved documents. The vehicles are dust and vermin proof with the proper storage system inside the vehicle to accommodate and place the documents during transit without causing any transit damage to them. RDC maintains the fleet of six dedicated vehicles— (2 × 9 tonner HCVs, 2 × 5 tonner MCVs and 1 × 3 tonner LCV)—for the movement of documents to and from the customers.
DOCUMENTS: TRACKING AND TRACING
RDC has developed a special software for tracing and tracking of documents. As soon as the first call from the customer is received, it is loaded in the software, which allows a single file to be shared between all RDC divisions and the staff involved in the service. With web-enabled tracking and tracing, the client can view all the relevant details about their preserved documents, using the assigned password. To monitor performance, minimum standards and quality indicators are incorporated into the software, which provides the relevant reports at regular intervals. The software has features such as powerful query and key word searching, automated record retention, real-time retrieval and searching, generation of report for clients on a regular or as-and-when basis, and finally, an edit box for file data.
CUSTOMER BASE
During the last five years of operation RDC has increased its customer base to184, which includes banks, insurance companies, manufacturing firms, trading houses, business firms, non-banking finance companies, hotels, hospitals, publishing companies and non-governmental organizations (NGOs). The business has grown from INR 2.5 million in 1995 to INR 105 million in 2001. The documents include paper files, videotapes, computer floppies and disks, X-ray films, books, reports and journals. With the increase in the customer base during the last five years, RDC finds the existing warehousing space inadequate to store the ever-increasing volume of documents. In addition to their existing facility in eastern Mumbai, they have plans for another similar facility at a western suburb of the metro.
COMPETITION
Looking at the increasing need of clients for document management in the space-starved metros and the expertise required for organizing the same, there is a huge potential for “document logistics services” in the corporate sector. One competitor has already joined in the race and another is in the process.
REVIEW QUESTIONS
- Draw the supply chain process linkages for RDC.
- What value additions can RDC make to their product offerings?
- In view of the emerging competition, what steps should RDC take to keep the leading position?
- As the CEO of the firm, how would you go about creating a warehousing chain across the country? Discuss the scope, challenges and barriers in building the service chain.
Case 23.10
GATTU WELDING ELECTRODES*
Restructuring Warehousing Network
Welding is the most common and important process for joining the metallic shapes in the fabrication industry. It may be done for production or maintenance purpose in the manufacturing establishment or on the project site. The process involves metallic fusion at a high temperature, which is near to the melting point of the basic metal of which the shapes or parts are made up. At the melting temperature, the metal (in the form of welding rod) is added to the gap between the two parts or shapes to be joined. The added metal gets fused to the parts or shapes to form a cohesive and uniform single joint. There is an alternative method ofjoining, which is known as riveting. However, it is not so reliable for leak-proof application. Moreover, it takes a longer time and is not cost-effective.
Welding electrode industry in India has grown rapidly during the swift phase of industrialization in the country in the last century. Almost all types of welding electrode varieties for all applications are manufactured in India. Gattu Welding Electrodes (GWE) was incorporated in July 1987, in technical and financial collaboration with a Swedish MNC, with an initial share capital of INR 50 million. Today, it employs 1000 people and recorded a sales turnover of INR 1500 million in 2001. The organization operates four manufacturing plants backed by a world-class R&D support from their collaborators. The company has received ISO 9000 and ISO 14000 certification for all the six factories. Gattu Welding Electrodes maintain a well-established all-India marketing and distribution network. GWE is managed by a group of well-qualified and experienced professionals; and is headed by the Managing Director who looks after the company’s day-to-day operations. GWE is the second largest player in the welding industry in India, having a 27 per cent market share. The other major players in the market are:
Table 23.10.1 Welding Industry in India
| Competitors | Market share (%) |
|---|---|
| Advani-Oerinkon | 32 |
| GWE | 27 |
| L&T | 22 |
| D&H | 11 |
| Honavar | 8 |
However, in the total welding electrode market of INR 7000 million in the country, the share of the unorganized sector is almost 50 per cent.
The sale of welding electrodes is strongly correlated with the steel demand in the country. Fresh capital investments and infrastructure projects are expected to lead to higher demand for GWE products. However, the unorganized sector has a strong presence in the Indian welding electrode industry due to the predominance of manual arc welding technology, which is not quality sensitive. There are around 20–25 brands available from the unorganized sector, which mostly cater to the needs of the lower-end price-conscious segment of the market. GWE’s principal activities are: manufacturing of welding electrodes; continuous electrodes/copper-coated wires; welding fluxes; gas and electric cutting and welding equipment and accessories; gas cylinder valves; medical equipment; and so on. According to the 2001 figures, respective share of different products in total revenues is: welding electrodes (49 per cent), welding equipment (28 per cent), continuous coated wires (12 per cent), medical equipment (five per cent), welding flux (four per cent), and gas valves (two per cent).
PRODUCT RANGE
GWE has the widest product range among all the competitors. Due to the strong R&D and close association with their collaborator, they have introduced many new products for welding applications. The other competitors are way behind in product development and mostly copy the GWE products after the market for a product is established. The product range of GWE covers the following:
Welding Electrodes
They manufacture the complete range of electrodes for almost all applications. The product range covers:
- Standard consumables Among these are included mild steel, general-purpose electrodes for structural steel welding; low hydrogen electrodes for critical application in pressure vessel and boiler welding; and gas fluxes for welding and brazing of cast iron, copper, aluminium and silver alloys.
- Special consumables GWE offers a complete range of electrodes for special applications, such as cellulose-coated electrodes, pipe welding electrodes and stainless steel electrodes. This range also includes continuous consumables such as MIG/MAG solid core and flux cored wire with flux combinations.
- Reclamation consumables Every year the Indian industry produces metal wastes worth billions. This waste is in the form of worn-out machineries and replaced-metal components that have failed in giving the proper service. With the industry being more and more competitive, cost saving has become the most effective tool to fight competition. Using the proven process of preventive maintenance welding, the replacement cost can be brought down to 30 per cent of the original. To satisfy the industry needs, GWE manufactures reclamation consumables like cast iron electrodes, hard-facing electrodes, filler wires and flux cored wires.
GWE Welding Equipment
The range covers arc welding equipment, gas welding equipment, metal cutting systems and other environmental system.
Medical Gas Equipment
This covers the critical life support equipment for use in hospitals. It produces anaesthesia machines, regulators and accessories etc.
Cutting Systems
The product range covers oxy-fuel, plasma, laser and water jet metal cutting machines. These are tailor made for specific applications in the industry.
MANUFACTURING FACILITY
GWE’s manufacturing facilities are located at four places across the country covering different product ranges. At the electrode factory in Kolkata, they manufacture general-purpose electrodes and reclamation electrode. At another facility in Kolkata welding equipments are produced. At the Nagpur factory they manufacture MIG (Metal Insert Gas) welding consumables, and at the Chennai factory they manufacture other welding consumables.
MARKET SEGMENTS
GWE has segmented the customers according to the electrode consumption pattern. The “lower segment” market consists of customers consuming less than Rs 25,000 worth of material per year; in the “middle segment” the yearly consumption is Rs 25,000–2,00,000; and in the “upper segment” the consumption is above Rs 2,00,000 per year. Currently, the number of customers in each of the above segments is 8500, 5000 and 1500 respectively. The large accounts constitute 70 per cent of the company’s sales turnover.
LOGISTICS NETWORK BEFORE 1987
Earlier, GWE had a distribution channel consisting of dealers and customers. The material used to flow from the factory to warehouses located at different places across the country. There were 83 warehouses, mostly smaller in size. GWE came to India through the acquisition of two major players in the welding industry. These two players operated the smaller warehouses which are now under GWE control. All GWE products from the factories were dispatched to the warehouses. The dealers used to dispatch the products to the customers from these warehouses. The inventory was under the ownership of the GWE and the stocks of products in the warehouse were kept according to the demand in the region. The primary transportation was the GWE’s responsibility, while the secondary transportation charges (from warehouse to the customer) were the dealer’s responsibility. These warehouses were operated by GWE, with the staff on their payroll.
The biggest drawback of this system was that the inventory at all warehouses was carried by GWE, thus blocking huge working capital. The level of inventory they had was to the tune of 85–87 days. In many states where sales were low (due to low market penetration), the stocks remained unsold for longer periods.
Table 23.10.2 GWE Sales and Inventory Movement

*Based on 300 days a year.
Moreover, because of improper maintenance of these warehouses, some stocks would get damaged or stolen. Low qualified people, who had no formal education or training in inventory and warehouse management, were in charge of these warehouses. They were basically local people who had mostly worked with the transporters. Each warehouse had one in-charge, two clerks and three helpers. The primary transportation cost was also a burden on the company’s profits. In 1996 the company incurred heavy losses due to the high cost of logistics operations and inventory-carrying cost. The management took a serious note of the situation and took aggressive steps to overcome the problem.
NEW LOGISTICS SYSTEM
GWE subsequently scrapped the warehousing system. According to the present system, the company does not keep any warehouse in the field to stock the products. The firm decided to have mother warehouses at the four factories of the company; from where the materials were to be dispatched to the dealers directly.

Fig. 23.10.1 Comparison of new and old logistics systems at GWE
The management reviewed the dealer network and found that the market can be effectively served with lower distribution cost through a lesser number of big dealers. They have reduced the numbers of dealers to 160. These dealers take the customers’ requirements and pass it on to the logistics department of the factory. Each factory has its own logistics department to take care of the inventory planning, maintenance and dispatch as per the market requirement. The company organizes its marketing through four regional offices that are responsible for sales and dealer control in their region. The current marketing set-up of the company is as follows:
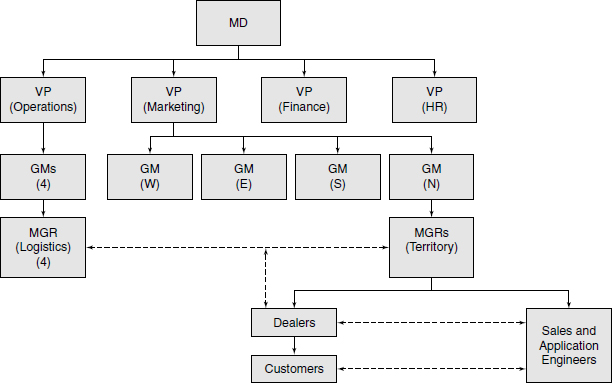
Fig. 23.10.2 Marketing network at GWE
In the new system, the dealer will be responsible for the supply of material to the customer in his territory. He will send the requirement to the logistics department of the respective factories for the product manufactured therein and the material will be dispatched to the dealer. The dealer will store the material in his warehouse till it is further dispatched to the customer. The ownership of the material is now with the dealer. The marketing engineer will facilitate the sales generation and extend the application support to the dealer for generating the sale from the customers in his territory. The primary transportation charges from the factory to the dealer and secondary transportation charges from the dealer to the customer are passed on to the customer’s account for recovery. The dealer will be responsible for payment collections from the customers. The flaw in the new system is that, in case a dealer gets an order for 50 cases of a certain product, they will have to wait till further orders come in from other customers, so that the dealer can ask for a full-load truck from the factory. Otherwise, the freight charges in excess of those committed to the customer will be to the dealer’s account. With the new system, the firm’s inventory level has drastically come down to 35 days. The company started earning profits from the year 2000. The financial results of the company are as follows:
Table 23.10.3 GWE’s Performance between 1998–2001

*Based on 300 days a year
PACKAGING
The company has improved on the packaging. There are three sizes of electrodes: 4 mm, 3.15 mm and 2.5 mm, which go into packs containing 55, 65 and 85 numbers respectively. One case contains six boxes of the above sizes. These cases are loaded on to the transportation vehicles for dispatches to the dealers. The entire packaging operation is outsourced in all the four factories.
CURRENT PROBLEMS
With the new system the company could manage to bring down the inventory to more than half. However, there are a few major problems the firm is facing.
- Business from customers is totally in the hands of dealers. No customer can strike a business deal directly with GWE. In such cases, the dealers who do not deal exclusively in GWE products (as per the industry practice) promote other brands that fetch them handsome profits.
- GWE has no direct linkage with customers. This is creating the barriers to free flow of market information.
- For the dispatches from dealers to the end-customer GWE has no control, and in many cases, although the material has been dispatched from factory on time, it does not reach the customer in time.
- The firm is online with their regional offices. However, the dealer connectivity to the GWE for information flow is poor.
REVIEW QUESTIONS
- The leading player (No.1) in the welding electrode industry is maintaining inventory levels of 22/25 days. How, according to you, should GWE go about to achieve that level?
- Does GWE need to further reorganize its marketing-distribution system to overcome its current problems?
- Do you recommend a change in the marketing set-up (reporting structure)? If yes, how?
Case 23.11
SUMAN CROP PROTECTION*
Moving to the Cost-Effective and Efficient Logistics System
CROP PROTECTION INDUSTRY
The crop protection (CP) industry plays a vital role in Indian agriculture by preventing and reducing crop loss before and after harvesting. A broad and common categorization of CP products (pesticides) is insecticides, herbicides, fungicides, rodenticides and fumigants. Another useful categorization is technical pesticides and formulations. India is one of the largest manufacturers of technical pesticides and there is a significant capacity in the industry.
The CP industry is made up of large companies operating at the national level and a number of smaller companies operating at regional levels. This allows for products to be available all across the country; but has also resulted in a severe competition. Insecticide dominates the market, although the continuing trends in the recent years have been of faster growth in herbicides and fungicides. Cotton is the key crop for pesticides consumption with rice, wheat, plantation, fruits and vegetable being other major crops. The industry is dependent on good monsoon and is labour-intensive in nature.
The Indian seed industry continued to operate in a fragmented manner, with a few large products operating at the national level and many small producers/traders operating at the regional level, particularly in field crops. The industry is likely to witness some consolidation in the near future.
A major development in the industry was the approval granted by government of India for commercial sale of genetically modified (Bt) cotton seeds. In agribusiness, companies have to be strong in research and development in order to survive and grow. This is especially so with the advent of biotechnology in the seed industry.
Successive years of low agricultural growth caused by inadequate rains/drought have affected the industry. However, the past few years saw a revival in agricultural growth, which also spurred Indian GDP growth in a major way. The global industry continued to see further consolidation in agribusiness with the consequent ripple effect also being seen in India. The new agricultural policy announced in 2000 has been followed up by support measures in the Union Budget of both subsequent years and this promises to infuse new vigour into agriculture in India.
The potential for the CP industry is tied to the potential of agricultural growth in India. The longterm potential for the CP industry is positive due to the policy initiatives taken by the government, the increase in high-yielding hybrid cultivation and the growth in irrigation. The opportunities in the food processing industry and increased cultivation of export-oriented crops augur well for the industry.
In India, the use of developed seeds is still at a very low level for many crops. There is a gradual shift to high-value hybrid seeds, particularly in crops such as high-value vegetables and in-field crops like sorghum, pearl millet, corn, sunflower and cotton. Efforts are also being made to develop suitable hybrids in crops like rice, where the use of hybrids is very low. This offers big opportunities to seed companies in India. Producers having modern research facilities will have lots of opportunities not only from sales of seeds, but also from licensing of technology.
The Indian farmer’s acceptance of modern agriculture practice is also a positive factor. For the protection of breeders’ rights, the government has now enacted legislation and is in the process of formulating the necessary rules and regulations. This should help the country get access to more modern technology in the agricultural sector. The low level of capital formation and productivity in agriculture is a matter of concern as is the fluctuation in quality and price of agricultural products. Marketing of spurious pesticides and seeds in the names of big companies is yet another threat.
SUMAN CROP PROTECTION (SCP)
The company started its operation in 1970 as a trading house for the imported crop protection chemicals. Initially, they concentrated their marketing effort in the southern part of the country. They opened their first office in Chennai and subsequently as the business grew, they had offices in Hyderabad, Bangalore and Trivandrum. Looking at the business prospects and the gradual shift of the farmers to using hybrid seed, wherein these chemicals find the application as insecticide and pesticide, SCP decided to start manufacturing activities and they built up a facility in Maharashtra, with the vision to succeed in both the up- and down-country markets. The plant went into operations in 1994 with an installed capacity of 5000 tonnes of agrochemicals, which was subsequently increased to 8000 tonnes. The second plant was put into operation in 1999 in Gujarat with an installed capacity of 5000 tonnes. SCP has achieved rapid growth and commands a market share of 12 per cent, which is next to their rival Tata Rallis, which has a 15 per cent market share.
Table 23.11.1 SCP Performance

*Based on 300 days a year
PRODUCTS
SCP manufactures a wide range of agrochemicals for crop protection, some pesticides for domestic application and seed for crops. The product range covers—
Herbicides—For prevention or elimination of weeds, erosion of soil and water loss. Fungicides—To prevent and cure crop diseases that have severe adverse effects on crop yield and quantity.
Insecticides—Insects like caterpillars and aphids can significantly reduce crop yield through their feeding. Insecticides help in minimizing this damage by controlling the growth of insects.
Professional Products—The pest control chemicals for material protection, vegetation management, gardens and public health.
Seeds—For field crops, vegetables and flowers.
The marketing of the above product categories is organized under two broad business segments, viz. crop protection (CP) division and seeds division. The contribution of the CP division was 86 per cent in the company’s 2001 sales turnover and the balance 14 per cent contribution was from the seeds division. SCP exported products worth INR 121 million in 2001; contributing 2.8 per cent to its sales turnover, which is mostly in the CP division.
RAW MATERIALS
The raw material of SCP is divided into three main categories, namely active ingredients, inter-mediataries and packing material. The percentage contribution of each of the above categories in the total inventory is 30, 62 and 8 respectively. The material is procured from 78 suppliers, which includes suppliers from outside the country. Thirty-five per cent of raw material is imported, which has a 3-month lead time including the time for transportation and customs clearance. All the packaging materials are indigenously procured, which constitutes 10–12 per cent of the product cost. SCP maintains a 45–50 days’ raw material inventory. As the finished products have seasonal demand, most of the raw materials are procured in advance before the season.
PRODUCTION
The agricultural season starts first in northern India followed by west, east and south regions. Suman follows the batch production methods and processes the material according to the region-wise requirement for dispatch—first to the north and the to the other regions in the above sequence. The production planning is done based on the requirement forecast by the regional offices. The production schedules are reviewed every month. The forecast is mainly based on the climatic conditions in the country and the degree of rainfall in the region. As the lead time for imported material is long, the company does not accept any order for shorter delivery periods. The material is quality-tested before packaging, which is available in pack sizes of 50 g, 100 g, 250 g, 500 g, 1 kg, 5 kg, and 10 kg.
DISTRIBUTION
After it stared business in India, SCP had entered into contract with the State Warehousing Corporations in various states for warehousing agrochemicals at the various consumption centres. These are government/public warehousing corporations, which mostly deal in warehousing and distribution of agro-products such as food grains, pulses, sugar and seeds. These corporations are actively associated with the Food Corporation of India (FCI) for procurement and distribution of food grains in the regions. These corporations also stock material (related to agricultural industry) from private manufacturers. Till 1998, SCP was distributing the materials through 350 public warehouses. The management noticed that they were maintaining finished goods inventory stocks of 70–71 days, which was very high compared to their competitor (43–45 days). The company’s regional offices were divided into seven zones and they were coordinating the warehouses for dispatches to the co-operatives and the farmers in their respective regions. Each office was staffed with one regional head, three sales representatives, and three lower grade staff.
Zones
- Western (Maharashtra, Gujarat and Goa)
- Central (MP and Rajastan)
- Northern (UP and Bihar)
- North Western (Punjab, Haryana, HP and J&K)
- Eastern (WB, Assam and North Eastern States)
- South I (TN, Karnataka and Kerala)
- South II (AP and Orissa)
Current System Drawbacks
- High distribution cost—Average INR 12,000–15,000 per year per warehouse
- The primary transportation cost was INR 48–50 lakhs per year
- Less control on the warehousing operations
- Stocks accounting and reporting very poor
- Product damages, pilferage and expiry 1–1.5 per cent
Looking at the problems, SCP in the year 1999 changed its distribution system and restructured the marketing network. The new system consisted of the following:
New Distribution System
- The practice of stocking the materials at public warehouses was abolished
- SCP appointed 200 big distributors to maintain the minimum inventory level as per the norms of the company, which is fixed on the basis of the demand pattern in the region
- The sales target was assigned to each of the dealers. The target was to be monitored by the respective regional office head
- The dealer organizes the storage space for stocking the material
- For the services rendered by the dealer, the compensation was fixed at 7.5 per cent of the purchase he makes. For exceeding the sales target, the dealer will be paid extra, based on the sales slabs he covers
- The dealer would report to the regional office every evening on the sales effected and inventory in stocks
- The dealer will pay to SCP for the sales effected within 30 days of the date of invoice, a copy of which he has to send to the regional and the head office on the same day
- SPC reworked the MRP for all its products. The charges for primary and secondary transportation and other distribution costs (warehousing and handling) were included in the MRP of the product, which is recovered by the company from the customer
New Marketing Set-up
- SCP reduced its zonal offices from eight to four regional offices as profit centres
- They were empowered to monitor and control the sales and marketing in their respective regions
- The dealers’ requirements were met directly from the central warehouses of both the factories on the instruction of regional offices
- All regional offices were connected online with HO (Mumbai) and the factories (Maharastra and Gujarat)
As a result of the above changes, the inventory stocks started reducing (see Table 23.11.1). The non-value-added distribution activities were eliminated. Product damages, pilferages and losses were reduced to the bare minimum. The management is still unable to do anything on the demand front, as the requirement of agrochemicals depends on the crops, which in turn is dependent on the monsoon. The SCP has appointed a consultant to evolve a suitable model to get over the problem of demand forecasting, so that the raw material planning and scheduling can be accurately done to further reduce both the finished goods and the raw material inventory.
REVIEW QUESTIONS
- Compare and contrast the old and new logistics systems of SCP
- Evolve a suitable model for demand forecasting of agrochemicals for the supply chain to be lean?
- Do you feel the revamping of the system is adequate, or would you suggest further changes in the marketing structure to cope with the market requirements in the competitive environment?
- Do you see any scope for outsourcing of any logistics services (apart from transportation) in the new system?
Case 23.12
ASHWINI PHARMA PVT LTD*
A Case of Logistical Packaging for Exports
This case of the pharmaceutical formulation manufacturer deals with the decision on logistical packaging. One of the often-neglected aspects in the movement of goods is the packaging of cargo. The packaging is important as it has a direct bearing on the freight cost. The computation charges are based on two parameters of the consignment, viz. the gross weight and the volume of the cargo. Hence, the dimensions or size of the packages affect freight costs. The optimization of sizes becomes vital when it comes to controlling the freight cost.
By a systematic study of the entire movement of goods, it is possible to identify the areas where cost could be cut or at least controlled. Shashank, logistics manager at Ashwini Pharma (AP), was assigned the job to rationalize the packaging size for export cargo in order to reduce the freight that, as per the industry standard, was on the higher side.
ORGANIZATION
The company was founded in 1980 and has grown into an internationally renowned and fully integrated pharmaceutical organization. AP has world-class expertise in the development and manufacture of organic intermediates and bulk, active and finished, dosage formulations. This expertise enabled the company to provide high-quality and cost-effective pharmaceutical products to capture both domestic and export markets. The exports are mainly to CIS countries. They achieved sales of INR 9500 million with a net profit of INR 476 million in the year 2001. The export contributed to 15.48 per cent of total sales of the company. The average growth observed in export sales during the last five years is 10 percent.
Ashwini Pharma is an ISO 9000 and ISO 14000 accredited company with a strong focus on R&D in new drug formulations. It is a leading company in its product range, commanding almost 30–32 per cent market share. There are five other players in the competition and all of them have strong foreign affiliations, both financial and technical, with their principals. However, AP has over the years developed a strong local R & D base of an international standard. The drugs developed by Ashwini are patented and are popular in the international markets.
Ashwini Pharma today has three manufacturing plants covering 70 per cent of the sales requirements. The balance 30 per cent is outsourced from eight vendors located mostly in southern India. The manufacturing plants are mostly automated. The company has around 500 people on the roll. For local distribution, Ashwini Pharma has four regional offices located at major metros in India. The products are distributed through 26 C&F agents located in each of the Indian states. The stocks are distributed by the company’s distributors (350), who in turn supply the products to the retail drugstores. Currently, AP formulations are available at 80,000 outlets in India.
Looking at the market potential on the export front, AP has organized its export sales through an international division way back in 1995, with the general manager heading that division. Today, the international division is manned by 10 persons, including two managers and one GM, and is treated as a separate profit centre. The company has appointed “country distributors” in the countries of destination for distributing AP’s products in those countries. These country distributors have their sub-distributors for onward distribution of these products over a wider geographical area.
ORDER PROCESSING
The chain of activities for export cargo dispatches is an eight-step process consisting of various activities as described below:
Step 1 The international division receives the order from their overseas distributors.
Step 2 The purchase order is scrutinized, registered and loaded on to Systems Applications Programmes (SAP).
Step 3 The order is automatically taken on production schedule as per the delivery schedule.
Step 4 The manufacturing is done in batches as per the schedule.
Step 5 Finished products are inspected manually.
Step 6 The products cleared through inspection are dispatched for primary packaging in strips, blister or bottle packaging, which is an automated process.
Step 7 The secondary packaging is done manually. The primary packs are manually inserted into the paper boxes which are of predetermined stock keeping unit (SKU) sizes and have printed labels with product information as per the statutory requirements.
Step 8 The secondary packs are inserted in cardboard cartons for unitization. These are the consignments for final dispatch. They are called shippers.
Step 9 A packing list is made for each consignment, which includes product details, manufacturing and expiry dates, batch number, gross and net weight of the consignment, and so on.
Step 10 After the documentation is completed the shippers are transported to the airport for final dispatch to the customer abroad.
The packing is done on the basis of instructions issued by the packaging development department. These specifications are made on the basis of the following parameters:
- The minimum quantity to be packed in the shipper
- The distance and time needed to reach the final destination
- The climatic conditions of the destination country
- The cost of procuring the packaging materials
- Specifications issued by the authorities concerned/customer
The packing instructions are issued in the form of packing pattern such as 72 × 5 × 2 × 10. This is to be read as:
- 10 tablets/capsules in a strip
- 2 strips in a box
- 5 boxes in a carton
- 72 cartons in a shipper
The minimum quantity that is packed in the shipper is determined by the sales and marketing department, keeping in mind the factors like business potential of the buyer and demand pattern of product at the end-user’s level. Hence, it is evident that for each country different shippers and different packing patterns have to be used.
At Aswini Pharma the role of the packaging development department is important in designing the cost-effective packaging for safe consignment movement during the transit through varying handling, storage and climatic conditions. After the final design is made, the packaging material is procured from two/three suppliers.
COMPUTATION OF AIR FREIGHT
The chargeable weight of the air consignment is the actual gross weight of the consignment for consignment size below 6,000 cubic centimetre. However, for the consignment above 6,000 cubic centimetre size, the weight is computed as follows:
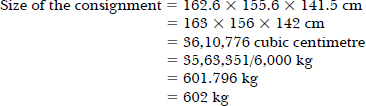
The freight forwarder manually measures the dimensions of the consignment and calculates the weight to compute the total freight charges to prepare the Air Way Bill.
At Ashwini Pharma, on an average 67 shipments are exported every month. Each shipment is of 0.14 million kilogram valued at INR 163 million. The average freight cost per month is INR 12.90 million, which is 7.89 per cent of the value of the products exported. The above averages are based on the export shipments during the last nine months (see Table 23.12.1).
Ashwini Pharma sends most of its shipments to CIS countries in mainly four product categories A, B, C & D. Due to difference in the cargo agent’s measurements of dimensions and the actual size of consignment, Ashwini Pharma was paying freight on the higher side. Shashank found that the excess freight paid was varying from 6 to 14 per cent on the different consignment sizes sent mainly to three CIS countries (Tables 23.12.2–23.12.4).
The results of the random audits of different consignment sizes dispatched to three countries during the last nine months showed the large deviations in weight calculated by the consignment agent and the actual gross weight of the shipper (Table 23.12.5).
Table 23.12.1 Export Shipments

Table 23.12.2 Weight Differential

Table 23.12.3 Excess Freight Paid
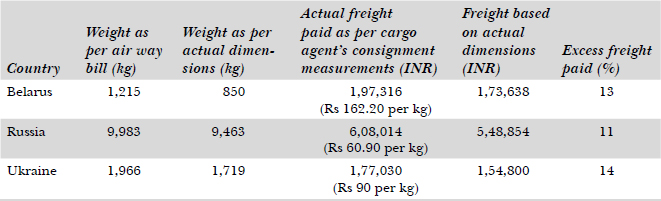
Table 23.12.4 Country-wise Product-wise Dispatches during the Last Nine Months (000 kg)

Table 23.12.5 Product-wise Packing Pattern

Table 23.12.6 Country -wise and Packing Size-wise Dispatches during the Last Nine Months
| Products | Country | Packing Pattern |
|---|---|---|
| A | Russia Russia Belarus Belarus Ukraine |
6 × 16 × 5 × 3 × 10 4 × 24 × 5 × 2 × 10 36 × 5 × 2 × 10 12 × 10 × 4 72 × 5 × 2 × 10 |
| B | Russia Russia Belarus Belarus Ukraine |
140 × 5 × 2 × 10 45 × 10 × 2 × 10 144 × 5 × 2 × 10 60 × 5 × 2 × 10 20 × 10 × 1 × 4 |
| C | Russia Russia Belarus Belarus Ukraine |
144 × 5 × 2 × 10 90 × 5 × 2 × 10 24 × 24 × 1 × 4 180 × 5 × 2 × 10 12 × 42 × 4 |
| D | Russia Russia Belarus Belarus Ukraine |
150 × 5 × 2 × 10 4 × 60 × 5 × 2 × 10 75 × 10 × 2 × 5 16 × 15 × 4 × 5 50 × 15 × 5 × 5 |
Shashank identified the following reasons for the excess freight charges:
- The dimensions used by the cargo agents are higher than the actual dimensions of the shipper
- Mismatch of dimensions due to bulging in the consignments is to the tune of 50 per cent of the total shippers dispatched. The reason for the bulging is that the inner four lids of the shipper do not touch each other and so fail to put enough pressure on the goods inside. Hence the backward pressure causes the bulge in the shipper
- The order for the products comes in multiples of 10, 100 or 1000, while the units contained in the shippers are in multiples of 12, 120 and 1200. Hence, the balance of the order is packed in another shipper. Thus, an additional shipper is required for the packing, resulting in additional freight charges
- On average 800 export dispatches are made every year. Each dispatch consists of 100 shippers resulting in 80,000–85,000 shippers per year. The packing density of the shipper is low and hence freight calculated on the basis of shipper dimensions causes the increase in freight cost
- The chartered cargo plane to Masco can carry 60 tonne of goods. But because of low density of the shipper only 27 tonne of material is loaded
REVIEW QUESTIONS
- As a logistics manager, what measures do you suggest to reduce the export freight cost?
- How will you eliminate the variations in dimensional measurements by the cargo agent?
- Has the marketing department any role to play in helping to reduce the freight cost?
- Does containerization resolve the issue? And at what cost?
Case 23.13
ADITYA DIGITAL TV*
Deciding on Warehouse Locations
Due to liberalization of the Indian economy, the TV industry in India is facing two problems: overcapacity among the local manufacturers and the killing competition on the marketing front. Apart from the national brands of the Indian manufacturers, there are the foreign brands that command a considerable market share, which is worrying the local players such as Aditya Digital TV Ltd. (ADTV)—a company that started manufacturing B&W TV sets way back in 1983 and had a strong hold on the state of Maharashtra. ADTV was enjoying a leading position during the first five years of its operations, as the competition in the market was not so severe. In 1988 the company started manufacturing colour TV sets in 14-, 21- and 27-inch screen sizes at their existing factory in Panvel. However, today 80 per cent of their production is in the 21-inch screen size. The company began to face competition in urban markets from both national and international brands. Although ADTV had 12 per cent of the market share up to 1992, they witnessed a drop in their market share in 1993 by 2 points and a further 2 per cent by 1994. In spite of ADTV recording a growth in sales volumes, it could not do much to maintain its market share. The company further witnessed saturation in urban markets and severe competition for their brand in the urban market.
In view of the prevailing situation, in 1994 ADTV had taken the decision to move to the semiurban and rural markets in Maharashtra, which other local brands were trying to reach.
As a sequel to their decision, they opened two more regional offices in Nagpur and Kolhapur, besides their offices at Mumbai and Pune (see Table 23.13.1 for division of territory).
ADTV is currently supplying the materials to regional warehouse hubs from their mother warehouse located at Kalambori (near Panvel) in Navi Mumbai. The finished products (TV sets) from the Panvel factory and from manufacturing associates (outsourced) are brought to Kalambori warehouse for further distribution in the state of Maharashtra. The production capacity of ADTV is sufficient to take care of the demand for their products in the next 3–4 years, which is growing at a rate of 5–6 per cent per year. Before branch offices were opened at Nagpur and Kolhapur, the material was supplied to the Nagpur dealer from the Mumbai warehouse and to the Kolhapur dealer from the Pune depot for further distribution in the regions. With the limited infrastructure and financial resources, the dealers could not penetrate deep into rural markets and tap the potential. In order to develop rural markets, ADTV had divided the territory in four regions, viz. Mumbai, Pune, Kolhapur and Nagpur, and expanded the dealer network to 36 dealers to have at least one dealer at each of the district locations. The main dealer at the district town had sub-dealers under him at taluka places.
ADTV had no direct dealings with sub-dealers. ADTV now has regional warehouse hubs at Pune, Nagpur and Kolhapur, supervised and controlled by the respective regional offices. The average monthly demand for TV sets in these districts is as follows:
Table 23.13.1
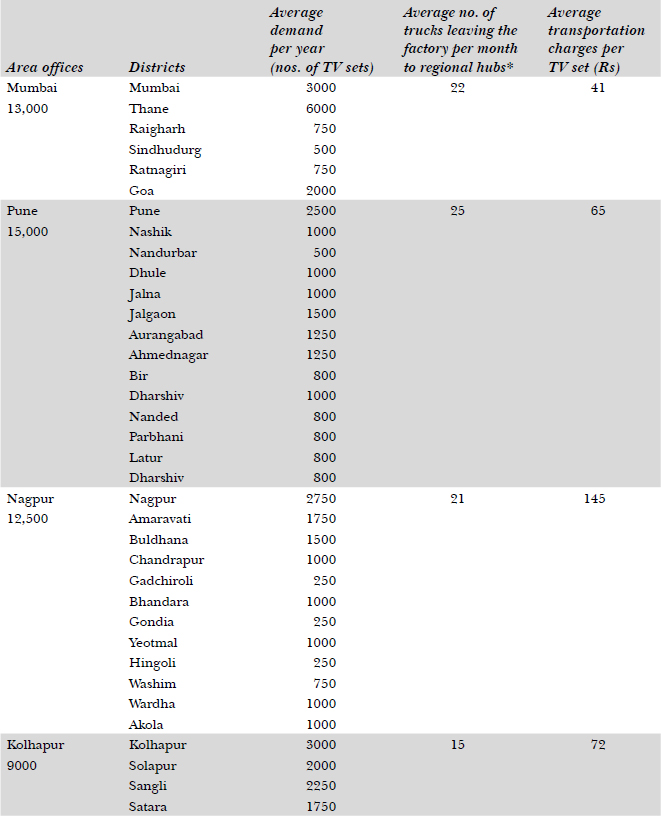
*50 no. 21-inch TV sets in specially designed trucks for transporting TV sets.
The primary transportation from Mumbai to the regional hubs along with local octroi charges was taken care of by the ADTV central hub at Mumbai. The Mumbai mother warehouse was also operating as regional hub for Mumbai region. However, the secondary transportation charges from hubs to dealers were taken care of by the regional hubs. The local octroi charges were to be paid by dealers for the material shifted from the warehouse to the shop within the municipal limits of the respective town. Invariably, all the dealers had their warehouses located outside the municipal city limits, except at places like Raigarh, Ahmednagar, Satara and Wardha. The octroi charges at Mumbai are 5 per cent and at other places in Maharashtra 2.5 per cent of the MRP, which is Rs 14,500 for a 21-inch TV. Dispatches from the regional hubs to the respective dealers in the district were made on a weekly basis and the dispatch pattern observed was:
Table 23.13.2 Dispatch Pattern
| Dispatch schedule | Dispatch pattern (% of average monthly demand) |
|---|---|
| 1st week | 10 |
| 2nd week | 15 |
| 3rd week | 25 |
| 4th week | 50 |
The regional hubs had to dispatch the material to multiple dealers spread over different districts in the region in the same vehicle, thus necessitating multiple stoppages and deliveries. The dealers in Raigarh, Ahmednagar, Sangali and Wardha do not have their warehouses outside the municipal octroi limits of their respective towns. So, the truck had to enter the municipal limits of these towns in order to drop a few TV sets at the dealers’ warehouses, thus obligating ADTV to pay the octroi on the entire consignment load carried by the vehicle, irrespective of the fact that the rest of the consignments were meant for dealers in other districts. The octroi paid is refundable, but the refund may take six months or more and involves too many hassles. ADTV had the option of opening a satellite warehouse located outside the city octroi limits at each of the above towns. The operating charges of such a warehouse (on rental basis) will be approximately Rs 15,000 per month, including the salary of ADTV staff and contract labour. The additional transportation charges from the proposed warehouses (at four places) to the dealers’ places at Raigarh, Ahmednagar, Sangli and Wardha were estimated at Rs 20 per TV set. The regional hubs found that the secondary transportation charges increase and vary from month to month, depending on the vehicle route they choose. On an average, they pay Rs 16–19 per kilometre on secondary transportation.
Table 23.13.3 Road Distances
| From | To | Kilometres |
|---|---|---|
| Navi Mumbai (Kalambori) | Mumbai | 35 |
| Pune | 130 |
|
| Nagpur | 863 |
|
| Kolhapur | 336 |
|
| Thane | 35 |
|
| Raigarh | 98 |
|
| Sindhudurg | 321 |
|
| Ratnagiri | 225 |
|
| Goa | 425 |
|
| Pune | Nashik | 202 |
| Nandurbar | 425 |
|
| Dhule | 351 |
|
| Jalna | 275 |
|
| Jalgaon | 395 |
|
| Aurangabad | 214 |
|
| Ahmednagar | 125 |
|
| Bir | 210 |
|
| Nanded | 484 |
|
| Parbhani | 308 |
|
| Latur | 315 |
|
| Dharshiv | 395 |
|
| Nagpur | Amaravati | 110 |
| Buldhana | 340 |
|
| Chandrapur | 195 |
|
| Gadchiroli | 275 |
|
| Bhandara | 150 |
|
| Gondia | 250 |
|
| Yeotmal | 150 |
|
| Hingoli | 260 |
|
| Washim | 225 |
|
| Akola | 250 |
|
| Kolhapur | Solapur | 247 |
| Sangli | 197 |
|
| Satara | 79 |
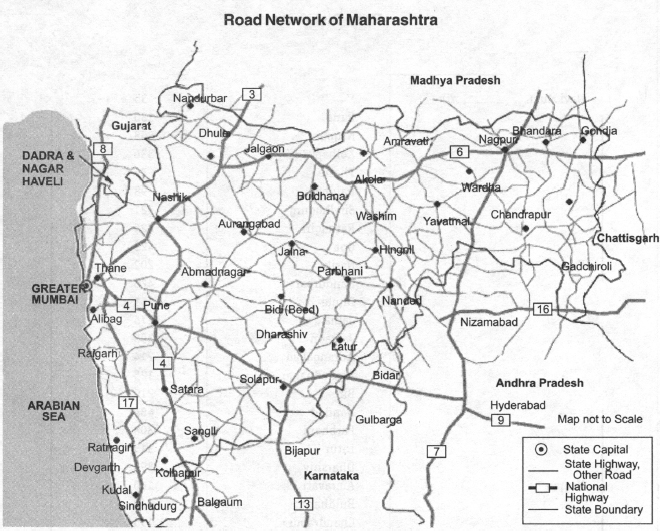
Fig. 23.13.1
REVIEW QUESTIONS
- Work out the cost-benefit analysis for ADTV maintaining warehouses at Raigarh, Ahmednagar, Satara and Wardha.
- For freight rationalization, what are the route options for secondary transportation?
- Do the regional hubs have vehicle options (smaller size) for freight economy?
- Is it a case for relocation of the regional hubs?
Case 23.14
KARAN AUTOMOTIVES COMPANY*
Restructuring Physical Distribution System
Karan Automotives Co. (KAC) was founded in 1960 to manufacture automotive spark plugs and diesel fuel injection equipment in India. The company has a virtual monopoly in the products range they manufacture. The other products they manufacture include auto-electrical, special-purpose machines, hydraulic and pneumatic equipment, portable electrical tools, and so on. With the growing markets, more and more new competitors are entering the race and to deal with competition in replacement markets, KAC has increased its dealer network to more than 3000 in FY 2001. To keep with emission norms, KAL has introduced fuel injection equipment complying to Euro I.
The domestic auto ancillary industry is highly fragmented, with hardly any player with a global-scale capacity. Technology is the key factor in the product manufacture but it has remained static. The small-scale manufacturers have captured the replacement market to a great extent, because of the following three reasons:
- The industry is not capital intensive.
- The market growth is very high.
- End-users are price-conscious and ready to compromise on quality.
All the original equipment manufacturers (OEMs) are mainly served by the players in the organized sector. The industry, which until recently was on a growth pedestal, has to face the repercussions of a slowdown in the auto sector. But riding piggyback on the ever-growing replacement sector and scope for exports in this industry might just seem to hold its own in the face of growing uncertainty.
Fuel injection pumps (FIP) are used in diesel engines to pump diesel to the combustion chamber in the engine. Multi-cylinder FIPs are used in the commercial vehicles, while single-cylinder FIPs are used in agricultural pump sets and power tillers. Spark plugs are used for ignition of the compressed air-fuel mixture in an engine cylinder. The requirement is one spark plug per cylinder. The average life of the spark plug is 15,000 km.
In order to brace itself for the concept of world-class manufacturing and continuous process improvement, the company has adopted the principles of total quality management (TQM) and innovation for keeping the customer satisfied. This calls for an overall approach to improvement in all organizational areas. As a major step toward TQM the company has upgraded its corporate metallurgical and chemical laboratory in FY 2000. The company plans to continuously develop and design the fuel injection system taking cognizance of fuel consumption, emission and greater safety of the end-user.
The distribution network is the backbone of KAC. Distribution served as the link between the company and the retailer, who finally sells the product to the end-user. KAC distributes its products through the main distributor, dealer and the retailer, who is the final link with the end-user. Of late, KAC had sensed a major problem in its distribution link. The company management observed that the promotional schemes evolved and introduced by the company never reached down the line. As a result, the coverage and awareness about the new products was limited for lack of motivation. After an investigation the KAC management found that the dealers never allowed the benefits of the schemes to go down the line. The dealers used to promote those products wherein the margins were good. KAC decided to restructure the channel structure. They identified the following weakness in their distribution system:
- Communication gap between the distributors and the company
- Inadequate or low compensation for going products such as spark plugs
- Limited market coverage
However, on the product front KAC found that the product is well accepted in the market and there are no quality complaints. It was clear to them that the product has a good brand image in the market. The firm identified that there is good scope for its products in the two-wheeler segment, which is growing at 15 per cent per annum. Further, the company discovered that because of the excellent product quality, invariably all OEMs were using KAC products; nevertheless, in the replacement market the firm could not achieve the desired coverage and sales growth, owing mainly to the dealers’ inaction to pass on the promotional schemes down the line. In view of this, the KAC management has taken the decision to do away with the dealers. The retailers were served by the company’s main distributers.

Fig. 23.14.1 Old and new distribution network
As per the existing compensation package the C&F agents, distributors and dealers are compensated on percentage basis on the sales generated.
C&F agents: |
1 per cent |
Main distributors: |
4 per cent for spark plugs |
Dealers: |
3 per cent on spark plug |
In the new structure, KAC has removed the dealers and increased the compensation of the main distributors. The distributors were now getting 7 per cent on spark plugs and 10 per cent on other products. The KAC management has also introduced new incentive schemes linked to performance on targeted sales, turnover discount, quantity discount, and so on, so as to have faster sales growth and wider market coverage. The new scheme on infrastructure commission of 2 per cent was also introduced for distributors having two salesmen and one deliveryman. KAC has decided to work on a uniform pricing policy and have the maximum retail price (MRP) printed on the products. This new scheme was backed up by the following:
- Goods were sent to distributors on freight-paid basis
- Octroi on KAC’s account
- Resale tax paid by KAC
KAC has reorganized its sales through 4 sales zones, 23 sales offices, 41 distributors and 26 C&F agents (one in each state) across the country. Under the new scheme the distributors were asked to invest in communication and information processing facilities for online connectivity with KAC HO and factories. KAC has adopted the hub-and-spoke system of distribution. They have organized storage of finished goods at four hubs located at Bangalore, Delhi, Jamshedpur and Nagpur (all near to their four manufacturing plants) to supply the material to C&F agents located in the nearby states. KAC has entered into a long-term contract with one of the leading transporters in the country. However, the warehousing infrastructure is owned and managed by KAC. This arrangement reduced their logistics cost to 4.5 per cent (of sales) from 7.5 per cent earlier. They have achieved better control over inventory movement, thereby reducing inventory-related costs to half. Their finished goods inventory stocks have come down to 18–20 days from 30–35 days earlier.
KAC management wants to further reduce the finished good inventory to 8–10 days and the logistics cost from 4.5 per cent to 2.5 per cent of the sales in the next three years. However, the investments required for the logistical and information system front are estimated at INR 200 million. The current sales turnover of the company is INR 8000 million. However they are determined to boost the figure up to INR 10,000 million in the next three years.
In the current system, KAC is facing a lot of problems in transit damages that are to the tune of 1 per cent. In addition, for goods rejected on quality grounds and those damaged in transit, KAC has no returned goods policy. The goods returned for replacement reach the factory (in most of the cases) after its guarantee period is over. The complaints resolution takes a lot of time and sometimes it becomes very difficult for the distributors to handle the annoyed customer. For overcoming this problem, KAC has considered two alternatives. One is to have a well laid out returned good policy supported by a reverse logistics system controlled by a senior executive of the company. The second is to empower the distributor to handle and resolve the return goods complaints on their own with support from HO or the regional office. KAC thought of an incentive scheme for distributors to control and reduce the return goods complaints.
REVIEW QUESTIONS
- Compare and contrast KAC’s existing and new systems of distribution.
- Is the new proposal on infrastructure investment viable? What is the payback period? (Assume 300 working days per year and the current bank interest rates.)
- Evolve a return goods policy for KAC to get over the present situation.
- Do you recommend the services of a 3PL service provider to run the KAC warehouses? How will you go about deciding on this?
Case 23.15
MOHINI ELECTRONICS LTD*
Supply Chain Initiative Reaping Benefits
INDIAN CONSUMER DURABLES INDUSTRY
The consumer durables industry in India has become highly competitive in the recent past. The entry of large-scale players has irrevocably changed the landscape, serving the Indian consumer like never before with bewildering array of products. Today, in addition to the multiple choices in the models, the products are home-delivered without the customer having to take the trouble of visiting a dealer’s shop. Due to fierce competition, the industry players are resorting to the following:
- Cost reduction by eliminating wasteful efforts in business process
- Redesigning the supply network to extend excellent service to the customer
- More emphasis on product innovations and shortening the life cycle for their existing products
- Getting closer to the customer through CRM programs
- Production on make-to-order rather than make-to-stock basis
- Emphasis on the value chain rather than the supply chain
Today, the Indian consumer durable (white goods) industry stands at INR 15,000 crores. TVs contribute the maximum share followed by refrigerators, washing machines and air conditioners.
Table 23.15.1 Indian Consumer Durable Industry

Perhaps more than in any other industry, the push system has worked well in the consumer durable industry for many years; but now the pull system is becoming the next logical step in the industry’s development in the market-oriented Indian economy. The push system is basically a replenishment system fraught with inherent inefficiencies like extended credit terms, stockpiling, sluggish orders and pipeline inventories. The pull system by contrast is based on demand creation and only make-to-order as per the customer requirements. In consumer durables the push system was used because the market was limited, buying power was limited and dealers were compensated with credit. Until 1995 the push system was the primary business process. However, today there is a total shift to demand-based manufacturing planning using sophisticated software tools. Appliances are built according to actual customer demand, and with the response time being reduced from 5 weeks to 5 days, the replenishment of inventory at dealer’s showroom is done automatically, production cost has reduced, and inventory at all levels has dramatically come down. Consequently, responsiveness to customer demand has improved considerably.
Despite the consistent demand for consumer durables, the companies did not focus on the cost of servicing and distribution until 1995. An analysis of the top six companies in the industry shows that the overall selling cost as a percentage of net sales jumped from 20 per cent in 1995 to 29 per cent in 1996. This was mainly because of increased competition forcing more above-the-line advertisement and below-the-line sales promotions to dealers. The selling expenses to net sales had touched 33 per cent in 1999, when new players stepped up activities to expand the market share. The past few years have seen a drop in sales in most of the segments, which reflected in the lower distribution cost. The good sign was the focus on the supply chain and the saving in costs related to it. The earlier analysis of stocks at various levels in the white goods industry had shown the higher side as a percentage of total sales. However, today the picture is totally changed and firms are focusing more on making the supply chain lean.
Several factors have spurred interest in the supply chain in the consumer goods industry. The main reason was a dip in sales growth (during 99–00) to 16 per cent from 34 per cent (in 1998) due to an overall slowdown in the economy. Most companies had gone in for setting up capacities in the early 1990s to cater to the vast, unexploited Indian market. But in 90s the market growth slowed down and competition increased manifold, resulting in sharing of market between many players.
The sector trends (consumer durables) show that overall logistics cost has decreased from 5.9 per cent in 1996 to 5.1 per cent in 2000. However, the finished goods inventory had shown declining trends from 32 days in 1996 to 23 days in 2000. These numbers show a distinct improvement from the situation 5 years ago. It must be remembered that the importance of supply chain and its role in business came to be appreciated only around the period 1997–1998. A better performance is expected in the next 5 years as the key issues of inventory management, logistical network and technology adoption are being addressed properly. The freight cost seems to be of much concern to most of the companies in the white goods sector. The freight cost is under control but there needs to be a marked improvement in the quality of transportation (to reduce transit damages). Manufacturers have reduced the number of transporters and retained only a few as their logistics partners to provide logistics solutions. Many white goods companies have reengineered their distribution network and adopted the hub-and-spoke model for their distribution network. They have evolved a proper performance measurement system for the logistics partners. The service providers are rewarded and penalized based on their actual performance against the targets. A few companies such as Samsung and Godrej are using railways transportation for bulk dispatches to their distribution hubs to economize on the freight cost.
Table 23.15.2 Sector Trends

*Based on 300 days a year.
MOHINI ELECTRONICS LTD. (MEL)
MEL is an Indian subsidiary of a world-renowned consumer electronic company having a presence in 65 countries. The Indian company was set up in 1994. Within 6 years of its operations in India, it achieved a sales turnover of INR 2800 million in 2001 through its innovative manufacturing and distribution strategies. The company achieved a growth rate of 25 per cent per year. Over the last year the consumer electronic division had shown a growth of 26 per cent, while the growth in home appliances was 24 per cent. In spite of recessionary market trends, MEL had shown a remarkable performance among the industry players.
MEL is very aggressive on the new product front. It has so far launched 12 new models in colour TV and six models in home appliances. The parent company, which is operating in 65 countries, has achieved sales of USD 30 billion in 2000.
Table 23.15.3 MEL Performance

MEL is comparatively a new player in the industry, and had to go through many ordeals in establishing themselves in the Indian market. For starters like MEL, the established Indian companies reacted strongly. However, MEL competed first on the product quality and then on the price front. Besides, there was the simultaneous entry of such companies as Electrolux, Carrier, Whirlpool, GE and LG, and all of them raised stakes in the market.
Supply chain management (SCM) is relatively a new concept in Indian industry. MEL was the first company in the consumer durables industry to introduce SCM. Earlier, the white goods producers were more production and sales oriented. MEL brought the SCM concept from the day they started operating in the Indian markets. The underlying philosophy is that it is good to innovate on the process rather than functions. They made a paradigm shift from inventory made-to-stock to inventory made-to-order. They developed their distribution network on the hub-and-spoke system for better control on the customer service and the inventory in pipeline.
In accordance with the industry standard, MEL has the lowest logistics cost as the percentage of sales. Due to aggressive marketing efforts, the MEL market penetration level was the highest among the competitors. Their market share in the colour TV segment has grown from 9 per cent in 1999 to 11 per cent in 2001. MEL has increased its capacity to 8,00,000 units in colour in 2001. They had plans to reach a target of INR 50,000 million in sales in 2003.
OUTBOUD LOGISTICS
MEL products are sold through 22 branch offices, 26 CFAs, 4 regional distribution centres and 5000 dealers all over India. They have 550 service centres for service backup for their products. The logistics costs for outbound operations were 1.80 and 1.62 per cent of sales in 1999 and 2000 respectively, which fell to 1.25 per cent in 2001. MEL has engineered their supply chain to market conditions with the make-to-order policy. The main stumbling block here was the accuracy in forecast and the frequency of forecast review, which has been taken care of through the weekly rolling plan for manufacturing schedules. To support the weekly rolling plan, MEL had gone in for the online connectivity to its dealers. The dealers’ requirements are consolidated and finally sized up at the regional offices and further consolidated at HO for direct dispatch from the warehouse hub to the dealers’ place. The online connectivity has helped the MEL marketing team to get an insight into market trends, feedback and information on competition sales. The data forms the base for future action to translate into sales, production, stock, and dispatch plans. These plans are prepared and reviewed on a weekly basis. MEL has adopted the two-tier distribution warehouse system to supply the material anywhere in India within 48 hours and make it more cost-effective.
MEL has a plant warehouse located near Delhi, wherefrom the goods are moved to 4 regional distribution centres (including Delhi) for further dispatches to the dealers’ warehouses. At this point the sales signal goes back to the MEL system for stock replenishment. To cater to the needs of smaller dealers the C & F operators are equipped with 6–8 different sizes of vehicles to ensure that within 4 hours material is delivered to the top 10 dealers in the city. A major improvement in the company has been in the field of their focus on distribution planning. The imported products are planned before the order is placed, as port allocation is done in advance. After allowing goods movement across all four ports in the country, the outbound distribution cost has been drastically reduced. The regional distribution centres now get the material from the nearest port. This eliminates inter-branch stock transfer, thereby reducing the transportation costs drastically.
MEL uses EDI for connectivity and information. The system gives the vendor the weekly purchase plan and weekly delivery schedule for material supply to all 5000 dealers across the country, within 48 hours of receipt of an order from them.
The new system called “logistics innovation” has helped to reduce the delivery by 2 days and the inventory level by 25–30 per cent.
The finished goods are dispatched from the factory warehouse within one day of production. MEL has currently engaged, on a long-term basis, five transporters instead of the 17 they had in 1998. Of the 17 transporters they had before, one was carrying 30 per cent of the goods produced and another 18 per cent. With the current arrangement, the transportation cost has come down by 30 per cent from its 1998 level. For safe transportation, container trucks are in use to keep product damages within the norms. The inventory levels at MEL now are 30 days as against 90 days in 1998.
Another issue in distribution is the availability of spare parts at the 550 service centres across the country. The company’s service centres are linked to global resource centres for procurement of spare parts. The parts flow from assigned international hubs to the regional distribution centre directly. The new system has reduced the spare parts order cycle time from 45 days to 30 days. The global spare part sourcing is a single window clearance system that makes tracking of 7000 spare parts easier. The system automation, which is still in the planning stage, will reduce in future the spare parts order cycle time to 7 days and in effect considerable reduction in transaction cost will be achieved.
The logistical connectivity at MEL is based on V-Sat that is linked to SAP. This has helped in reducing MEL’s receivable payments from 60 days in 1998 to 21 days in 2001. The spread of the company’s dealers now is 31 per cent in the north, 28 per cent in the west, 22 per cent in the south and 19 per cent in the east. The total number of dealers has gone up from 2700 in 1998 to 5000 in 2001.
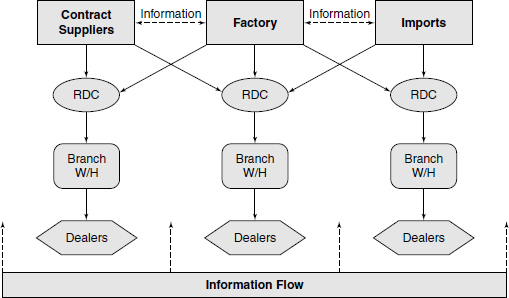
Fig. 23.15.1 MEL information and product flow
INBOUND LOGISTICS
MEL meets 60 per cent of its raw material, components and CKD kits requirement through imports from its parent company. It also imports complete units of certain models of CTVs, washing machines and refrigerators. The raw material inventory average does not exceed 17 days at any point of time.
The ordering base of the raw materials is the rolling forecast that is reviewed weekly. The ordering for imported items is done in smaller lots on a weekly basis to minimize the implications of risk and costs. The planning is done for 12 weeks, but firm call-ups are done on a weekly basis with permissible contract variations of 10 per cent. The same holds good for the local purchase items. The production schedules are made available to the vendors to plan their manufacturing and raw material procurement schedules. All MEL vendors are responsible for 100 per cent quality checks for the material they are supplying.
MEL’s vendor base consists of 55 suppliers. Out of these, 38 are within a distance of 100 km from their Delhi factory, which takes a maximum of three hours to transport the materials. Eleven vendors are beyond 100 km and the remaining six are located overseas. Local parts can be procured with a one-day intimation, while overseas vendors require at least 12 weeks notification. MEL has classified its vendors into A and B classes. Currently, they have 18 “A” class vendors supplying “A” class items contributing to 60 per cent of their material bill. “A” class items are procured on the JIT basis. All “A” class imported high-value, small-size, low-volume items are transported by air. All the raw material is palletized. MEL encourages the vendors to use plastic recyclable boxes for material packing. These boxes are unitized on the recyclable pallets. Both pallets and plastic boxes are returned to the respective vendors for reuse. The TV cabinets are procured locally and are palletized to avoid damage during transit. MEL’s logistics partner ensures that the landed consignment is cleared through customs and reaches the Delhi factory within 10 days of landing. The inbound logistics cost of MEL is the lowest in the industry at just 0.75 per cent of the sales.
MEL is connected via G-net logistics system and Z-Spare-SYS to their worldwide network. These systems are used in India for their inbound and outbound logistics operations to gain on cost-effectiveness, operational efficiency and asset productivity.
MEL NET SERVICES
MEL is making a big push at streamlining its sales service through the net. The firm has invested in Rs. 5 crores on intra-net to connect 550 authorized service centres with HO. It is also offering customer call logging, under which a customer can register a service call at the site. Once a customer makes an online call, he/she is given an ID number, detailing product and customer data. The information goes to the authorized service centre (ASC) nearest to the customer to provide services within 24 hours of the call. In case a call is not attended within 48 hours, it is automatically forwarded to the regional service centre head. Even then if it is not attended within 7 days, it goes to the service head at MEL factory. All MEL key suppliers (local and overseas) are linked through the EDI system for speedy business transactions. EDI is integrated with the ERP system (SAP) for the entire supply chain integration of MEL operations.
MEL AUTOMATED INVENTORY MANAGEMENT
For high storage density, and speedy pickup and storage operations MEL uses horizontal carousel, which has increased the picking speed to 150 items per hour, from 30 items per hour with the conventional system. The loading capacity of carousel proved 300 per cent more than the previously used shelving system. With carousel, the storage space requirement has been reduced by 50 per cent; picking efficiency has increased to 99 per cent; and the inventory level is reduced by 55 per cent. Earlier, MEL pickers had to search the rows of shelving, which was a time-consuming and difficult task. With automated carousel now in place, the parts automatically come in front of pickers, helping them to attain a level of shipping 75000 parts in 1500 SKUs within 3 hours from one day earlier. All this helped MEL to gain high level of customer satisfaction.
AUTOMATED ORDER PROCESSING
In 1998 MEL, due to rapid increase in operations, experienced problems in data storage and analysis capabilities of the system then in operation. The order cycle time took 40 days and there were multiple information re-entry and updating points. To shorten the order cycle time, MEL invested in the custom-built automated order processing software package and made modifications in the supporting operating systems. The factory, HO, branch offices and RDC were connected through intranet, while the dealers were connected through extranet for online data flow and analysis. The new system facilitated online order processing, resulting in a marked improvement on the customer service and demand management fronts.
REVIEW QUESTIONS
- Compare and contrast the old and new logistics systems at MEL.
- With the objective of doubling the sales in 2003, outline challenges MEL may face in logistics operations?
- Will the existing logistics system be suitable for volumes and complexity of operations in future?
Case 23.16
RUBBER PRODUCTS*
Redesigning Supply Chain on the Technology Platform
Indian tyre industry is at a crossroads due to the various challenges it is facing after the liberalization of the Indian economy in 1991. It is a technology-driven industry and very much dependent on rubber as the major raw material input to the final product. Firms that have their rubber plantations have a better control on costs and deliveries. There are big players in automotive tyre with technology backup from the world giants. The major players are CEAT, MRF, Apollo, Bridgestone and JK. The industry is highly competitive. Today, brands like CEAT, JK, MRF and RP are very strong in OEM markets. However, Apollo captured the replacement market in the commercial vehicle segment. On the technology front everyone is trying to bring in radial tyres to Indian markets, as they are being readily accepted by customers due to their advantages.
After the liberalization of the economy, the approach to tyre pricing was driven by market forces instead of the cost-plus-profit formula earlier used by the manufacturers. Due to cutthroat competition organizations were forced to offer a competitive price irrespective of the product cost, which, however, needs to be controlled through some internal mechanism. To remain competitive tyre manufacturing firms started relooking at their business process and costs associated with production and distribution of the product. The major reason was the high cost of operations due to system inefficiencies, higher inventory levels and low productivity of assets. They started looking for ways to improve their efficiencies, effectiveness and productivity in order to sustain growth.
RP was a considerably younger player in tyre manufacturing but had its inefficiencies spilled over from the pre-liberalization era, when the businesses were under government controls, manufacturing capacities were limited due licensing process and manufacturers had government protection. RP being a relatively new company had state-of-the-art manufacturing facilities and very little problem on the manufacturing front. The area of inefficiency was logistics on the distribution side. They felt that the need of the hour is speed in reaching the customer with efficiency and cost-effectiveness. RP decided to go in for a system based on the latest information and communication technologies to enhance coordination across the supply chain so as to reduce cost and increase asset utilization.
RP had taken a strategic decision in the mid-1990s to be a cost-based and customer service-based differentiator for remaining competitive in the automotive tyre market. They undertook a compete redesign of the existing supply chain and made the coordination of the various activities and linkages of the business process an independent function. The company decided to go in for the SCM initiative through the change process to work on the open culture. Through SCM they further decided to integrate the procurement, manufacturing and distribution activities of RP using the latest information and communication technology tools for bringing speed in information and inventory flow. As a result of aggressive SCM strategies, the company could boast the achievements mentioned in Table 23.16.1.
Table 23.16.1 SCM Initiative Achievements
| Parameters | Achievements |
|---|---|
| Finished goods inventory | Reduced from 55 to 20 days |
| Sales lost opportunities | Reduced from 25 to 5/6 per cent |
| Factory compliance | Increased from 40 to 80 per cent |
| Replenishment at distribution locations | Reduced from 8/10 days to 24 hours from hubs |
| Delays in transit | From 30 to within 5 per cent |
On account of the SCM initiative RP dealers are now assured of supplies per their requirements. The inventory level in the distribution channel has drastically reduced to 15/18 days as against 45/50 days earlier. The assets and funds blocked in inventory are now reduced to half. The job for the sales personnel in the field has become easier. Their efforts are now focused more on sales generation than chasing goods at the factory or depots, resulting in a reduction in time spent on non-value-added activities. RP, which was earlier more worried about the customer service level in the competitive environment, now talks about the enhanced customer satisfaction level and the improved customer value delivery system through its SCM initiatives.
With the SCM initiative RP reviewed its existing practices and introduced drastic changes to bring about efficiency, cost-effectiveness and productivity in the system at the operating level. The following were the changes introduced:
FROM PUSH TO PULL SYSTEM OF SUPPLY CHAIN
RPL had the push system in practice for distribution. This system required production to be planned on the aggregate sales forecast based on the past trends, resulting in a very high level of inventory. With the change to the pull system, the production planning is now based on the actual sales requirement from the point of sales. To support the pull system RP has worked out inventory norms based on demand variations, transit time and load frequency. The latest IT tools were introduced for information collection, analysis and dissemination. In this system the stock-keeping units (SKUs) sales information was to be punched on a daily basis and sent to the factory, which was the responsibility of the dealer, C&F agent and hubs, in order to ensure ease and speed in the replenishment activity.
HUB-AND-SPOKE DISTRIBUTION
From the earlier multiple stock point systems RP has gone in for the warehousing hub system. The firm has mother warehouses at their three factories producing tyres for two-wheelers, commercial vehicles and four-wheeler passenger cars. The four regional warehousing hubs (at Mumbai, Delhi, Bangalore and Calcutta) now receive supplies from the three factories and two contract manufacturers in and around Mumbai. The hub warehouses are owned and managed by the 3PL service providers. The material from the factories is sent to the hubs through full-load trucks and also through the rails containers.
The ratio of road to rail dispatches is 75 to 25. The hub warehouses are equipped with mechanized material-handling systems for speedy inventory movements. The 3PL firm has it own selfdeveloped Warehouse Management System package that is linked with the company’s ERP system. The material from the warehouse hubs is directly sent to the 24 distribution centres (one in almost every state) that are managed by the C&F agents. The material from C&F agents reaches the dealers within 24 hours.
SPEEDY INFORMATION FLOW
RP invested nearly Rs 120 million on an information processing and communication system to ensure that all branch offices, warehouse hubs, distribution centres, dealers and factories are connected online with one another. For stock taking the information updates are made twice a day.
INTEGRATED LOGISTICS
RP’s real strength lies in logistics, which is totally outsourced to TCI who has dedicated container trucks to transport the products from factories to the regional warehouse hubs. TCI’s local offices are responsible for organizing the trucks, LCVs or smaller capacity vehicles for transporting the tyres from hubs to the C&F agents. The dealers pay the secondary transportation charges, however, the C&F agents are fully responsible for organizing the secondary transportation. TCI has provided RP with the trace and track system to find out the whereabouts of material dispatched to hubs and C&F agents. The contract is based on the reward and penalty system. As a result, transit delays have come down to within 5 per cent as against 30 per cent earlier. Further efforts are on to reduce this further to within 3 per cent.
LEAN INVENTORY
With the SCM initiative, the myth of higher customer satisfaction with higher inventory, which RP earlier believed in, has been totally destroyed. The WMS across all the three mother warehouses and four hub warehouses is integrated to logistics operations and C&F agents to plan and fulfil the requirements at dealers’ end, with the result that RP’s finished goods inventory has drastically come down to 20 days from 55 days earlier. Due to information flow, the inventory flow has increased manifold, resulting in inventory turns of 15 from a figure of 6 earlier. Today RP is able to deliver the right product mix at the right place and at the right time with lower inventory levels.
DISTRIBUTION PLANNING
The supplies are made from three factories and two contract manufacturers in and around Mumbai. RP’s HO is responsible for meeting the requirements of tyres for the two-wheeler, commercial vehicle and passenger car segments. HO at Mumbai runs a system to ensure that all the requirements of the three segments are met. Mother warehouses at factories and contract manufacturers send their materials to regional hubs based in four locations across the country. These hubs supply the product to C&F agents at 24 locations, from where it is supplied to a dealer network of 3200 to service the replacement markets. All OEM customers and exports are directly handled by HO. The supplies to OEMs directly go to the customers’ plants from the factories. In exports, the product goes to the port from the factories and finally to the customer via shipping lines, complying with government regulations.
The product allocations for OEMs, exports and replacement markets are done by the HO, which has online access to information on product requirements and inventory at all dispatch points across the country.
CUSTOMER SERVICE
In the tyre industry the quality of service is more important than product quality. The latter is a poor product differentiator. In the Indian context, all tyre manufacturers produce world-class goods with technical know-how from world-renowned manufacturers. Hence, the product quality being almost the same, the other major differentiator is quality of service. This means, the customer needs of “what he wants and when he wants” should be met through service. The customer makes his choice based on who provides him with the most effective service in terms of cost & time. In the replacement market, the dealer is an important customer, who in turn services the end customer. The dealer will minimize his investment risk through minimum inventory. If assured by the manufacturer the dealer will stock lesser quantity of the product. Through the SCM initiative, RP has developed a system that triggers a response not just at the warehouse hub but also at the plants.
CUSTOMER FOCUS
RPL supplys the products to three major market segments.
- Replacement markets
- OEM
- Exports
In the replacement markets, the product is supplied to 3200 dealers across the country, resulting in complexity in distribution. In efficient and cost-effective distribution, information and communication technology plays a major role by way of providing customized software solution for warehousing management, production planning, inventory controls and distribution planning, and can be integrated to the firm’s ERP system.
In the case of OEM customers like Mahindras and Maruti who follow the JIT system, the product should arrive at the assembly line just in time so they do not have to carry any inventory. For exports, the requirements are quality and on-time delivery, taking into consideration the hassles of customs clearance, documentations, and multi-modal transportation. With the ERP in place the product requirements of both OEM customers and exports are efficiently handled by RP.
PERFORMANCE MEASUREMENT AND CONTROLS
For maintaining the system performance, RP has devised a performance measurement system for identifying causes and taking corrective action thereafter. The factors responsible for customer satisfaction are the on-time delivery, order fill rate and minimum errors in dispatches, which are measured against the targets for rewards and penalties. As these services are outsourced, the selection of the right 3PL partners becomes crucial.
The other factor that is difficult to assess is the lost sales or opportunity at point of sales for the period of say, a month. RP designed a measurement system that relates lost sales to the sales affected and the minimum inventory held over the period of a month. RP has established that for having sales of 24 tyres a week, the minimum stock at the point of selling should be 4 tyres per day. RP is aiming at having the sales lost figure brought down to within five per cent from the present level of 25 per cent. Similarly, for the inventory level the control figure is 20 days. The factor applicable at warehouse was the inventory turn ratio, which RPL improved to 15 from a level of 6 and further wants to increase to 18.
In a nutshell, with the SCM initiative on the technology platform, RP could reduce its finished goods inventory to a bare minimum of 20 days. Factory compliance to the market demand improved by 80 per cent with a marked achievement in manufacturing flexibility. The other achievement was reliability in delivery with 95 per cent consistency through alliance with 3 PL partners.
REVIEW QUESTIONS
- Discuss how RP channeled its resources for maximizing the benefits.
- RP wants the inventory to be reduced to 12 days from the existing level of 20 days. According to you, what should be RP’s plan of action to achieve this?
- Discuss the importance of the performance measurement system in the context of RP
- What are the critical linkages of SCM for integration in this case?
- Discuss the tactical solutions RP has implemented to get over the changing market situation.
Case 23.17
TUSHAR ENTERPRISES*
Consolidating Distribution Systems
Tushar Enterprises is one of the biggest and oldest business houses in the country involved in manufacturing and trading of pharmaceuticals, consumer durables, FMCG and industrial products. The products handled by the company are either commanding number one or two positions in the respective industry sectors. Tushar Enterprises, a proprietary concern, started its activities in 1957 as a trading company dealing in pharmaceutical products then manufactured by leading foreign companies. The company initially focused on the government and big private hospitals for the high-tech drugs used in the treatment of TB, cancer and diseases related to the heart and brain systems, since these drugs were not manufactured in India at that time. Initially, the company owned a small office in Mumbai and started the business operations with a staff of five people. The owner, Shashank, employed two salesmen and two office staff to assist him in his business operations. In the beginning, they focused their activities in the Central Province (consisting of Maharashtra, Gujarat and part of MP). With consistent hard work, Tushar Enterprises could achieve sales of Rs 20,000 in the first year of its operation. This was a great achievement for Shashank who started the business with a capital of only Rs 5000.
After trading in pharmaceutical products for the next 10 years and reaching the sales figure of Rs 15,00,000 in 1967, Shashank ventured into the trading of consumer durables such as fans (table, pedestal and ceiling) looking at the large potential market for them in the near future. By this time the staff strength of the company had grown to 40. Tushar could successfully manage the exclusive dealership of the fan to market the product in the state of Maharashtra. In 1970 the owner of the fan manufacturing company wanted to sell his fan units due to family problems. Shashank had the foresight to see this as a great opportunity to enter the manufacturing sector. With the excellent relations he had developed with the fan manufacturer as a star dealer, Shashank could clinch the purchase deal on deferred payment terms for five years and a partnership of 10 % for the owner in the business. From 30,000 fans in 1967, the manufacturing capacity had now grown to 0.25 million fans per year in the year 1980, achieving a turnover of INR 150 million. In the year 1981 Tushar went public and got registered on the Mumbai Stock Exchange. In 2001, Tushar had three fan units in Mumbai, Nashik and Panjim (Goa) manufacturing 1 million fans annually and a sales figure of INR 1000 million. The marketing and distribution network now consists of four regional warehouses, 1200 dealers, 12 C&F agents, four regional offices and 12 branch offices.
Like the fan division, the pharma division has also grown from a sales figure of Rs 20,000 in 1957 to INR 2500 million in sales for 2001. The company acquired four pharma units (Mumbai, Pune, Indore and Noida) during the period from 1984 to 1990. The pharma products are marketed and distributed through a network of four regional warehouses, 16 C&F Agents, 75 stockists and more than 5500 retail outlets (pharma shops). The marketing set-up consists of four regional offices and 10 branch offices (resident executives).
During its business acquisition spree Tushar ventured into the FMCG sector and purchased outright three sick units located in Gujarat, AP and MP in 1992, 1993 and 1995 respectively. The product portfolio of the soap and detergent division consists of five national brands in soap and two brands in detergent, mostly serving the low-end of the market. The logistics infrastructure of this division was a part of the purchase deal of the units. The products are distributed through five big capacity warehouses (depots) located at Ahmedabad, Mumbai, Delhi, Bangalore and Kolkata. The products are marketed through 22 C&F agents, 80 distributors, 300 sub-stockists and the retail shops (over 10,000). They have four regional offices and 25 branch offices for the sales administration. This division has achieved sales of INR 4000 million in 2001.
Table 23.17.1 Division of Sales across the Factories in 2001
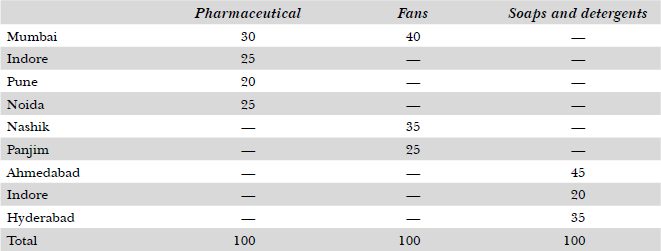
The manufacturing, marketing and distribution activities of all three divisions are handled separately. Even the regional offices are located in different buildings in the same city. Each division is headed by a CEO reporting to the Chairman (Shashank, in this case, who, incidentally, celebrated his 75th birthday on 26 January 2001).
After the liberalization of the Indian economy in 1991, the Tushar group started experiencing the pressure of competition. Their customer base has widened with the varied customer service requirements over the years. The group observed that during the last five years the sales growth had come down and they were losing their market share. The external agency that conducted the study for the top management came out with certain facts and suggestions. The main area of concern was the distribution, as it directly affected customer satisfaction. Many retail chains and large distributors and C&F agents had complained about the delays in delivery. The major observations of the agency were:
- At all levels in the company, employee orientation was towards production. It should rather be towards marketing in today’s competitive and dynamic market scenario
- The cost of product distribution is the highest in the industry
Table 23.17.2 Outbound Logistics Costs

In the total outbound logistics cost the ratio of transportation, warehousing and administrative cost respectively was 60:25:15 for the phrama division, 57:30:13 for the fan division and 63:20:17 for the soaps division. On an average warehouse space utilization factor varies from 77–80 per cent. But for the fan division this factor jumps to 95 per cent during the peak season and drops to 65–68 per cent during the slack season.
- There is duplication of logistics operations for products in the different divisions, with each division having its own manufacturing plants and regional warehouses for distributing the products across the country.
Table 23.17.3 Region-wise Material Shipments*

*Base—Tonnage.
- In more than 20 per cent of the trips to regional warehouses or to C&F agents, the material dispatched is less than a truckload, resulting in higher transportation costs.
Table 23.17.4 Division-wise Shipments per Annum

- On-time delivery performance for 78 per cent of shipments—a result of slow information flow and inadequate connectivity across the system, resulting into a longer order-processing cycle.
- Transit damages 1.5–2.0 per cent due to improper logistical packaging and inadequate material-handling equipment. The industry average is less than 1 per cent.
- The finished goods inventory, with all the divisions, is above the best-managed company in the respective industry and has much scope for reduction to improve the bottom line.
Table 23.17.5 Finished Goods Inventory

- For improving the quality of the logistics service, the consultant suggested improvement in the coordination between different logistics operations. The firm needs to set up a faster communication and information-processing system. The connectivity across the logistics chain, which includes the factory, regional warehouse, C&F agents, distributors and other channel partners, needs improvements. The firm should first decide its customer service-level goals prior to making any investment-related decision about the system. To revamp the current system, the alternatives need to be thoroughly studied with regard to their implications for costs and benefits.
REVIEW QUESTIONS
- Is this a case for consolidation of the distribution systems of three divisions into one system using a few warehousing hubs?
- How will you go about redesigning the warehousing network to service the customer and reduce the operating cost?
- Do the distribution systems of the three divisions have synergy in operations in the markets they are serving? Compare and contrast the operating requirements of the three distribution systems.
- Discuss the implications of elimination of regional warehouses from the distribution network and organizing the dispatches directly from factories to C&F agents.
- Analyze the option of outsourcing the entire logistics operations to a 3 PL firm.

Fig. 23.17.1
Table 23.17.6 Road Distance of Major Cities (Kilometres)

CFA Locations: + for Soap Division (22)
@ for Pharma Division (16)
# for Fan Division (12)
Case 23.18
PADMINI MOTORS LTD*
A Lean Supply Chain through the ‘Just-In-Time’ System
After the liberalization of the Indian economy in 1991, the auto sector was one of the first few industries to face stiff competition from the foreign MNCs, who sought a foothold on Indian soil to tap the fast-growing market. The auto manufacturers lost their government protection umbrella and had no other alternative but to remain competitive by developing cost-based or differential-based competitive strategies. Within the short span of five to six years, the market was flooded with world-class passenger car models and multi-utility vehicles produced in India by the world auto giants such as Ford, Mercedes, Hyundai, Toyota, and others.
Company Profile
Padmini Motors Ltd. (PML) was among the old Indian veterans having started manufacturing auto vehicles way back in the 1950s. Its first plant in Mumbai started manufacturing a sturdy vehicle—the jeep—in a single model, to suit the poor road conditions prevailing at that time. Padmini had a virtual monopoly in the jeep market, commanding 85 per cent market share till 1991. After the liberalization the scene changed. It became a buyer’s market rather than a seller’s, which was the situation prevailing prior to 1991. One world-class manufacturer and one old Indian player entered the Indian market with a number of multi-utility vehicle models, giving more choices to the Indian customers. In the globalized, privatized and liberalized (GPL) economic environment, Padmini lost its monopoly and its share was reduced to 55 per cent. The other two players shared the balance market equally. In the changed competitive environment Padmini observed the following:
- Heightened customer expectations
- Faster new product introduction
- Shortening of product life cycle
- Intense competition for market share
To remain competitive and arrest the declining market share, Padmini adopted both cost-based and differentiation-based marketing strategies. However, for the cost-based strategy Padmini decided to focus on its supply chain to take cost out so as to make the supply chain leaner.
Padmini is currently manufacturing around 60,000 multi-utility vehicles per annum. The product range covers 150 models. The firm has three main assembly plants, of which two are located in Maharashtra and one in Uttar Pradesh. The assembly plants are supported by four sub-assembly plants exclusively dedicated to engines (two), axle and transmission gears. The firm has a vendor base of over 900 suppliers for 7000 parts. The vendors are located in and around Mumbai, Delhi and Vapi. Padmini is marketing its products through 20 area offices, which control a network of 160 Padmini dealers spread across the country.
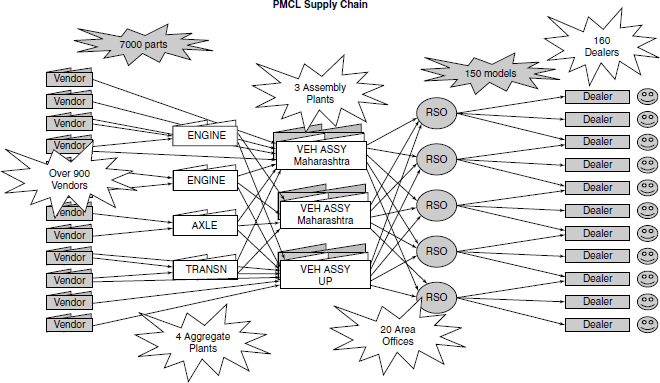
Fig. 23.18.1 PMCL supply chain
Padmini employs a local workforce of about 2000 skilled personnel, intensively trained in their areas of specialization. The company endorses equal opportunities and encourages women’s participation in the organization’s growth. The company has exports contributing to 10 per cent of its sales turnover. The Padmini products are well accepted by the local and international buyers because of their world-class quality and the backup after-sales service offered by the company to its clients.
Paradigm Shift
The company has gained a reputation over the years for its consistent efforts in providing quality products to its clients in a variety of models to suit their requirements. The real efforts started after the liberalization, when the company got the first jolt by way of substantial reduction in its market share in subsequent years. To counter the competition and remain differentiated, the company focused on its supply chain. It adopted the concepts of JIT based on the “Toyota Production System.”
Traditionally, the company was planning its production on the forecasts based on the customer demand trends observed in the past. The prevailing practices were:
- Monthly requirements of sales based on forecast
- Monthly production plan based on requirements of sales
- Production plan translated into schedules
- Vendor schedules based on production plan
- Frequent changes in production plan due to demand variance
- Corresponding changes in vendor schedules
Create Demand Pull
The push system, which was based on forecast, proved wrong due to change in the customer’s taste, demand patterns and competition. The production planned on the basis of forecasts was either inadequate or in excess of the actual demand. This resulted into excessive inventory to meet the desired level of customer service. The products thus manufactured were pushed through the dealer network to sell. To get over this problem the company decided to adopt the principle of “sell one, make one” and go in for the pull system so as to let production be demand-driven rather than forecast-driven. They integrated their distribution, manufacturing and procurement operations by using the latest IT tools and connectivity equipments based on the latest technologies. The firm now had all the supply chain participants connected online with each other, with proper informationsharing security policy. The current practices under the newly introduced pull system are:
- Replenishment action to start from dealers
- Dealers’ sales will be replenished by the Regional Sales Office
- Sales from Regional Sales Office will be replenished with fresh production
The firm had reviewed its product range and regrouped its products into two categories as under:
- Models (33) contributing to 88 per cent of the company’s sales
- Models (117) contributing to 12 per cent of the company’s sales.
Table 23.18.1 Product Groups
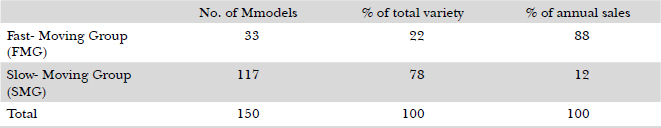
It was further decided that only FMG would be carried in the buffer stocks, while SMG models will be strictly manufactured against the firm orders. The buffer quantity for replenishment was worked out, considering the following:
- Forecasted average retail sales
- Lead time variable factor (considering logistics slip-ups)
- Demand variable factor (seasonal, short-term and regional pattern)
Thus getting daily orders from the dealers for FMG and SMG models created the demand-pull. With the buffer maintained at the depots, the dealer’s requirements for FMG models were fulfilled within 48 hours from regional offices. The weekly orders (firm) from regional offices were sent to plants on both FMG and SMG models for replenishment.
Planning and Scheduling
To support the field requirements, Padmini stressed on the planning and scheduling of the manufacturing activities. The firms adopted a system of preparing the rolling quarterly sales forecasted for planning its manufacturing capacity and resources, and preparing its monthly production plans. The firm makes a clear distinction between the manufacturing planning and scheduling. The planning was for capacity booking and organizing resources, while the scheduling was for resources allocation and actual physical production of the product on the shop floor. From the traditional practice of monthly production schedule, Padmini had shifted to weekly production schedules to meet the replenishment at regional sales offices. The weekly schedules were further refined by the daily replenishment requirement from the regional sales offices, which were further getting the replenishment requirement from the dealers on a daily basis.

Fig. 23.18.2 Finished goods inventory
Flexible Manufacturing
To support the pull system, Padmini had further adopted and implemented the concept of “let demand drive the production” with the objectives of:
- 100 per cent order fulfilment
- Reduction in order-to-delivery time
- Minimum pipeline inventory
To attain these objectives the company had identified four key thrust areas:
- Manufacturing flexibility
- Synchronous production of aggregate
- Increase in the frequency of ordering
- Speed, frequency and automation of the information processing system
The company invested heavily in the latest IT tools such as EPR and installed SAP for supply chain coordination on a real-time basis. It had gone in for manufacturing flexibility by regrouping its critical assemblies/components into two categories:
- Stocks
- Make-to-order
Table 23.18.2 Critical Assemblies/Components Growth

For all the above assemblies and components the delivery lead time was planned every 24 hours. However, the buffers were maintained for FMG assemblies and components, and for SMG it was decided to manufacture the same against actual orders. The firm went in for daily order processing for faster fulfilment of orders as against the weekly order processing earlier. The kanban system was introduced for speedy replenishment at the assembly line from the sub-assembly and components stores.
Material System
To support flexible manufacturing, the demand-pull was further extended to vendors. A material system was devised to ensure the availability of all the materials to meet the scheduled production of the sub-assemblies and vehicles with simultaneous reduction in acquisition costs. Padmini used the latest tool for inventory planning and kanban for material scheduling. Over 90 per cent of the material was put on the kanban replenishment system for speed, accuracy and reliability.
Padmini has a wide base of 900 vendors spread across the country. To ensure reliable and speedy deliveries, the entire inbound logistics activities were outsourced to a 3PL firm for transportation and storage at various points. The firm divided its vendors into seven zones for its plants. The 3PL firm was responsible for the daily milk run (in each zone) to collect the material as per the schedule, to either send it to the plant warehouse in case of full truckload or keep it at the hub warehouse in the zone until more material arrived to complete a truckload for dispatch to plants.
Table 23.18.3
| Zones | Vendors | Parts |
|---|---|---|
| Nashik | 27 |
325 |
| Delhi | 30 |
180 |
| Bangalore | 18 |
176 |
| Chennai | 20 |
165 |
| Pune | 17 |
90 |
| Daman | 10 |
65 |
| Total | 110 |
1194 |
The limit for stock level at the hub was always one day and daily shipments were planned from the hub to plants with a limitation on transit time (five days, from Delhi to Nashik or other plants) to meet the JIT requirements at the plant.
Achievements
As a result of the supply chain initiative, Padmini achieved its strategic objective of cost leadership. The firm’s products are price competitive in the market and command comfortable margins as compared to the competitors. The inventory-related cost is reduced to more than half compared to the cost four years back. The average finished goods inventory level has come down to 5350 in 2002 from 12,500 in 1999. For the differentiation-based objective the firm has a very wide product range of 150 models for the customers to choose from, which is supported by a network of countrywide service centres for the after-sales service. With the enhanced service-level backup, the customer satisfaction level is much above than that of the nearest competitor who commands a market share only half of Padmini. Although the market share of Padmini did not grow, the SCM initiative helped the company to improve its profit margins and customer service.
REVIEW QUESTIONS
- Compare and contrast the SCM and traditional approaches adopted by Padmini to remain competitive in the market.
- Discuss the role of the 3PL partner in meeting the strategic objectives set by the company.
- What were the system inputs Padmini had planned for the successful implementation of the SCM initiative?
- What are the challenges and limitations for flexible manufacturing?
Case 23.19
DORA CERAMIC TILES*
Preparing to Meet Supply Chain Challenges of Tomorrow
Ceramic Tiles is one of the few Indian industries having a very high growth potential. This is due to the rapid changes in lifestyles and tastes of the people during the last 10 years. Tiles (wall and flooring) have been accepted as lifestyle products and are used for the interior decoration of houses. From the traditional use of tiles for flooring, their application has extended to decorating and smartening walls. Earlier, this usage of tiles was restricted to the walls of toilets and bathrooms. It has now extended to the kitchen, bedroom and drawing halls too. For flooring application, there are a variety of products available in the market that are competing with ceramic tiles. However, the ceramic tiles industry in India is growing at a rate of 12–15 per cent due to rapid changes in buyers’ lifestyles and tastes, and also because these tiles are a better substitute for mosaic tiles, which are traditionally used for flooring application.
In India per capita consumption of tiles is 0.1 sq m as against 0.2 sq m in China and 3.5 sq m in the developed countries like Spain, Italy, UK and the United States. India accounts for 2 per cent of the world’s ceramic tiles production capacity (5.5 × 10⁹ sq m), while China accounts for 37 per cent followed by Italy and Spain with 16 per cent each. Asia accounts for 41 per cent of the world’s ceramic tiles production, while it accounts for only 13 per cent of the world’s consumption as against 52 per cent in all European countries together. India exports 10 per cent of its ceramic tiles production, which accounts for 0.05 per cent of world exports. The total ceramic tiles market in India is estimated at INR 14,000 million, which is 10 per cent of the total tiles (mosaic, marble, granite, stone and synthetic together) market in India. The ceramic tile industry in India is highly competitive, having many players both from the organized and the unorganized sectors. The share of the unorganized sector is to the tune of 35–40 per cent. The major players in the organized sector are Johnson, Kajaria, Somany, Bell, Peddar, Orient and Spartek, which are national brands having technology tie-ups with Italian manufacturers. The capacity utilization in the Industry is 80–85 per cent. The analysis of the ceramic tiles industry in India through the five-force competition model of Porter is revealed in Figure 23.19.1.
This industry is pegged with excess capacity and intense competition, particularly from the unorganized sector with 30–40 per cent cheaper prices. The industry profitability has decreased over the years due to the bargaining power of buyers and new entrants in the industry. The threat from substitutes is low as these products cater to the low-end market. The high-end market has different buying criteria.
In such industry environment, Dora Tiles started its operations in India way back in the 1990s and established its first manufacturing plant in Gujarat in the organized sector, with a manufacturing capacity of 50,000 sq m per annum. The plant being located in the backward area, the firm was exempted from paying sales tax (tax holiday) for five years on the sales processed for these products. The plant manufactures both wall and floor tiles and has two dedicated production lines for each of these product categories. Dora had purchased technology from one of the leading Italian tiles manufacturer. The company started marketing its products through a dealer network. However, institutional sales were directly negotiated through the company’s own sales force. Dora had a sales growth of 20–25 per cent in the first five years of operation. They could achieve a market share of 6 per cent in 1995. Due to growth in the ceramic tiles market and the growing demand for Dora products, the company in 1996 invested INR 500 million on a new plant in Karnataka. The plant was equipped with the latest technology involving the dry process of manufacturing ceramic tiles. This technology was being used for the first time in India and had distinct advantages such as faster production cycle, lower rejections and lower input cost, as water, which is a major ingredient in the wet process, is eliminated.

Fig. 23.19.1 Five force competition model for tiles industry
The new plant was fully operational in 1995 with a 50,000 sq m tiles manufacturing capacity. This plant was fully dedicated to floor tiles. Being located in the backward area, the plant had the advantages of tax exemption on sales tax and tax holiday on income tax. Due to the tax exemption, Dora had the price advantage over the products of other organized sector manufacturers. All these years the company’s focus was mainly on institutional selling to contractors, corporate sector and projects. They never seriously thought of the retail sector, which was growing faster and the other players had already started focusing on this sector. After the tax exemption period was over in 2001, Dora lost its price advantage over the competitors and started feeling the effect due to loss in market share, which had reached 11 per cent in 2001.
To counter the situation, the company identified the following key success factors, which could help them to increase the market share and achieve the targeted growth.
- Products Features
- Variety and new designs with speed to reach the market
- Types of finish and look of the product
- Sample distribution
- Retail Network
- Sales force strength
- No. of dealers/retailers
- Logistics network
- Efficiency and effectiveness of logistics
- Product Focus
- Wall tiles (less competition and increased usage trends)
- Operational Focus
- Working capital management
- Capacity utilization
- Production flexibility
- Process rejection controls
- Cost Structure
- Freight cost (both in- and out-bound)
- Fixed cost reduction
- Brand Awareness
- Through low cost options

Fig. 23.19.2 Dora’s distribution network
- Through low cost options
Dora had the technology edge over its rivals and also the cost and quality advantage over similar products available in the markets. The firm decided to focus on the marketing and distribution side. They slowly expanded their marketing network to 40 branches, 20 depots, 1000 dealers and over 3500 retailers. Dora was the first tile manufacturing company in India to introduce the depot concept. Traditionally, manufacturers dispatched their material directly to dealers, who had the responsibility of maintaining the warehouse. With the depot system, Dora could supply the product (in varieties) much faster than its rivals. As the dealer has a limited capacity to stock in terms of SKUs and the quantity, the customer requirements of quantity and variety can be met through the depots by maintaining adequate stocks in each SKU, numbering 225 in all. The order cycle had now come down to 48 hours compared to over two weeks earlier. The company installed the Distribution Requirement Planning (DRP) software and invested in online connectivity of all depots with branches and the factories.
The locations of depots were selected based on the potential sales in the area, number of dealers to cover and the distances for deliveries. Dora had totally outsourced the depot operation to C&F agents, who were selected on the basis of their experience, financial standing, infrastructure facility, office automation and technical expertise. The depots were responsible for order processing, order execution, collection, sample distribution and report generation. The performance evaluation criteria were based on quality of the work, minimum errors, average time frame for order execution, inventory, and outstanding payment norms. The DRP system was linked to the Enterprise Resource Planning (ERP) system installed in the plant to take care of the production and procurement planning.
The movement of primary freight from plants to depots is the company’s responsibility, while the dealer has to pay for the secondary transportation, which is covered in the MRP.
Currently, Dora spends 2.25 per cent of its sales on the logistics operation. The inventory level had come down to 25 days as against 40–45 days earlier. The payment outstanding is 45 days, which is lower than the industry average of 60–65 days. The order cycle time has been reduced to 48 hours due to faster communication and the shorter new design planning and execution cycle. Dora has a separate “new product design” department that studies the market trends and interacts with customers and channel members regularly. The samples are prepared in the pilot plants dedicated for new design and sent to the field for feedback. The company introduces on an average 8–12 new designs per month in the market.
Dora has engaged two 3PL firms (one for each factory) for primary transportation of goods from the factories to the depots. They have a dedicated fleet of vehicles for transportation of tiles. Based on the production and demand trends, the dispatch schedules are planned at least a week in advance to avoid delays and waiting. Dora has standardized three different box sizes for packaging of 8″×12″, 12″×12″ and 16″×16″ size tiles. The boxes are designed to accommodate 16 tiles. For safe transportation, each corrugated box is strapped and 48 boxes are unitized on the pallet with shrink-wrapping to avoid movement of individual boxes during transit. Ten pallets, each with 48 boxes, cover the entire volume of the 9-tonne truck. The loading and unloading of the pallets is done with the forklifts available at factories and depots.
The Logistical Information System collects and analyzes the information, and generates the following reports for the depots, branches, HO and factory:
- Daily order acknowledgement
- Order acknowledged for the month and also to-date
- Depot sales on daily basis
- Depot sales for month and to-date
- Payment collection on daily basis and to-date
- Payment collection for month to date
- Reports on customer rejects, wrong dispatches, damages, short supplies, wrong invoices, and so on
- Transit time for lorry from factory to depot
Looking at the changing market scenario, Dora had recognized the need for changing the traditional role of the distribution channel to the one required for achieving total customer satisfaction. This new role is necessary not only for growth but also for survival as well.
Table 23.19.1 Role of Distribution Channel
| Past role | Current/future role |
|---|---|
| Stock points—To make product available to end customer | Facilitator & planner for maximum inventory turnover Problem solver Customer educator |
| Order booking, dispatches, and payment collection | Work towards
|
| Periodic reporting | Speeding data collection, analysis and reporting Faster decision on customer service |
Looking at the pace of changes taking place due to globalization of businesses and the ever increasing customer expectations from suppliers in the competitive markets, Dora management has visualized the following trends that will be observed in the tiles industry in the next few years:
- Product
- More tiling options
- Quality a sine qua non
- Merging of product and services
- Commoditization
- Market
- A very large number of players (direct imports)
- Shakeouts/mergers/acquisitions
- Margins under pressure
- Customization for segments
- Dealers/Retailers
- Demanding with respect to product range, delivery time, after-sales service
- One-stop solution for aesthetics and home beautification
- Power shift to retail chain
- Customers
- More knowledgeable about the products and services
- Opting for do-it-yourself kits
- Customized product and service requirements
- Looking for one-stop solutions
The Dora management has already taken some initiatives on the change process to meet the ensuing challenges and sustain growth in the dynamic business environment.
REVIEW QUESTIONS
- Discuss how Dora should go about to meet the future challenges.
- How far Dora’s present SCM initiative has been successful in keeping pace with the environmental changes?
- Discuss the various key operational, tactical, control and strategic issues in the supply chain that Dora will have to address in future.
- Explain the role that logistics will have to play in the coming years in the tile industry.
Case 23.20
SHREE CEMENTS*
Freight Reduction through Transportation Mix
India perhaps is the only country in the world offering incentives for setting up cement plants. But these tax incentives often give an unfair advantage to the new players by allowing them to retain the sales tax collected from consumers. The players use these incentives to penetrate the market by undercutting their competitors and in the process distort the market. As a result, even inexperienced entrepreneurs have been tempted to enter the field. That is why the Indian cement industry is the most fragmented (except China) in the world. It is a peculiar situation where none of the players has a market share over 12 per cent, making it impossible to maintain price discipline. Currently there are 35 companies in India manufacturing cement used for various applications.

Fig. 23.20.1 Market share of major Indian cement manufacturers
Cement is a product that is inexpensive to make and has a huge demand. Most of the raw materials such as limestone, fly ash, gravel and coal are available in abundance and do not cost much. The raw material cost accounts for 30 per cent of the total cost required for making cement. A cement plant costs Rs 3500 per tonne, which implies that with an investment INR 350 crores, a company can put up a world-class cement plant. Shree Cements is a relatively new entrant in cement manufacturing in India, having set up its cement manufacturing plant with a capacity of 1 million tones in the coastal area in Gujarat. The state is rich in limestone reserves. The plant started its operations in the 1980s. The technology of cement manufacture was based on the dry process, with the advantage of lower power input per tonne of cement produced, enabling Shree Cements to have the cost advantage over the other cement manufacturers that were using the wet process. Analysis of input cost shows that, apart from the small portion directly attributed to efficiency, cost is almost impossible to control. This is because more than 70 per cent of the inputs come under the purview of the government. Coal prices, power tariff, railway freight, royalty and cess payment on limestone are totally controlled by the government. A look at the main inputs will give a clearer picture of the cost structure in cement industry.

Fig. 23.20.2 Main inputs in cement manufacture
Cement being a bulk commodity, transportation is a vital component of the cement company’s cost sheet. It accounts for a large part of the cost involved in distributing the cement. Shree Cements, having the manufacturing cost advantage due to the dry process technology, had its major focus on the logistics planning to curb the total cost.
Transportation Modes
Cement is sold either through the trade or directly to the non-trade customers. The trade sales of the company are directly through a network of 150 CFAs and 4500 stockists. The non-trade sale is by supplying cement directly to large construction sites. Shree Cements use rail transportation for transporting cement over longer distances, that is, above 350 kilometres. However, for distances below 350 kilometres, they use road transportation to destinations that are not connected by rail. With sales growth, the firm is relying more on rail than road transportation. The travel mix of the cement confirms the above fact.
Table 23.20.1 Transportation Mix of Shree Cements

Shree Cements have the advantage of being located on the seacoast of Gujarat and can use sea transport for cement dispatches to the cement-consuming centres located along the Indian coasts (both east and west). The share of sea transportation across the coastal area is not so significant. Apart from sea transportation, Shree Cements is studying the feasibility of transporting cement through inland waterways. This is the most economical form of transportation. The studies conducted by Shree Cements show that there is a fuel (diesel) consumption of 40 litres for transporting 1000 tonnes/km by road, 15 litres by rail and 5.6 litres by water. The company plans to slowly shift its focus more to water and rail, and reduce the share of road dispatches to control the freight cost and thereby gain the competitive advantage.
In the case of road transportation, Shree Cements is using the 40-tonner Volvo or the 16- to 20- tonne Taurus trucks, which give a 10 per cent cost saving as against the 9-tonner trucks.
The whole process of cement transportation depends on the marketing plan of the company. The distribution is the most important aspect of the industry and the entire strategic planning of the company revolves around it. In a bid to reduce its distribution cost, Shree Cements is focusing on markets that have rail and water links, and integrating its distribution and marketing plans to minimize the cost of transportation for every shipment from the factory.
Shree Cements in 1999 started dispatching cement in bulk rather than in the packed form in cement bags weighing 50 kg each. In bulk transportation the cement from the factory is vacuum-filled into a vessel of transportation, either a truck or a ship at the bulk terminal. Shree Cements have developed such a terminal at its Gujarat factory located on the seacoast. At the receiving ports, Shree Cements have developed packing facilities for bulk cement to be packed in 50 kg bags to be finally delivered to the dealers or construction sites. Such facilities have recently been developed at the Cochin and Vizag ports.
Ready-Mix Concrete (RMC)
Shree Cements, in a bid to add value to its product offering, have started offering Ready-Mix Concrete to its clients, particularly in the field of large scale construction such as dams, flyovers, seaports, highways and airports. RMC is nothing but a ready-to-use concrete—a blend of cement, sand, aggregates and water mixed in the required proportions. Shree Cements have launched this project in the major metros. The economics of RMC is simple. It takes just INR 7–8 crores to set up a 100 cubic meters per hour cement mixing plant, with 4–5 transit mixers. Each additional transit mixture costs INR 25 lakhs. The plant has a 3- to 4-month gestation period. For the builder it means faster construction period and availability of durable and quality cement with flexibility in mix. In addition, it does not cause air pollution and lowers storage requirements. These plants have the incentive of zero per cent excise duty. Shree Cements started this venture to meet 0.5 per cent of the total cement demand in the country, which is growing every year.
Dispatches
Shree Cements enjoy the benefits of proximity to the markets. They are mainly serving the markets in Maharshtra (almost 50 per cent of dispatches), Rajasthan (20 per cent), Gujarat (10 per cent), Kerala (10 per cent) and Eastern India (10 per cent). Being located in a backward area in Gujarat, it enjoys the tax incentives as well as a cost advantage of 7.5 per cent over its competitors. The freight cost is the lowest (15 %) in the cement industry.
Conclusion
Shree Cements foresee a lot of potential for cost savings in the cement industry. Therefore, they plan to shift the emphasis in their logistics operation to bring the distribution cost even further down. Shree Cements have the location advantage over their rivals and made a lot of effort to develop markets that can be served through rails and sea route to have the freight cost advantage. However, they are under the constant threat of withdrawal of the tax incentives by the government, which may disturb their cost structure leaving a long-term effect on their competitiveness on the price front.
REVIEW QUESTIONS
- “Freight is a major cost-spinner in cement marketing.” How could Shree Cements manage it through transportation mix?
- Considering the market locations, does Shree Cements possess further scope to reduce its outbound logistics costs?
- #x201C;For tapping the huge potential of cost reduction in the cement industry in India, a structural shift in the marketplace is required that may not be possible in the short run.” Comment.