
J. Using the Debugger
Objectives
In this appendix you’ll learn:
• To set breakpoints to debug applications.
• To use the run command to run an application through the debugger.
• To use the stop command to set a breakpoint.
• To use the cont command to continue execution.
• To use the print command to evaluate expressions.
• To use the set command to change variable values during program execution.
• To use the step, step up and next commands to control execution.
• To use the watch command to see how a field is modified during program execution.
• To use the clear command to list breakpoints or remove a breakpoint.
And so shall I catch the fly.
—William Shakespeare
We are built to make mistakes, coded for error.
—Lewis Thomas
What we anticipate seldom occurs; what we least expect generally happens.
—Benjamin Disraeli
He can run but he can’t hide.
—Joe Louis
It is one thing to show a man that he is in error, and another to put him in possession of truth.
—John Locke
Outline
J.1 Introduction
J.2 Breakpoints and the run, stop, cont and print Commands
J.3 The print and set Commands
J.4 Controlling Execution Using the step, step up and next Commands
J.5 The watch Command
J.6 The clear Command
J.7 Wrap-Up
J.1 Introduction
In Chapter 2, you learned that there are two types of errors—syntax errors and logic errors—and you learned how to eliminate syntax errors from your code. Logic errors do not prevent the application from compiling successfully, but they do cause an application to produce erroneous results when it runs. The JDK 5.0 includes software called a debugger that allows you to monitor the execution of your applications so you can locate and remove logic errors. The debugger will be one of your most important application development tools. Many IDEs provide their own debuggers similar to the one included in the JDK or provide a graphical user interface to the JDK’s debugger.
This appendix demonstrates key features of the JDK’s debugger using command-line applications that receive no input from the user. The same debugger features discussed here can be used to debug applications that take user input, but debugging such applications requires a slightly more complex setup. To focus on the debugger features, we have opted to demonstrate the debugger with simple command-line applications involving no user input. You can also find more information on the Java debugger at java.sun.com/javase/6/docs/tooldocs/windows/jdb.html.
J.2 Breakpoints and the run, stop, cont and print Commands
We begin our study of the debugger by investigating breakpoints, which are markers that can be set at any executable line of code. When application execution reaches a breakpoint, execution pauses, allowing you to examine the values of variables to help determine whether logic errors exist. For example, you can examine the value of a variable that stores the result of a calculation to determine whether the calculation was performed correctly. Note that setting a breakpoint at a line of code that is not executable (such as a comment) causes the debugger to display an error message.
To illustrate the features of the debugger, we use application AccountTest (Fig. J.1), which creates and manipulates an object of class Account (Fig. 3.13). Execution of AccountTest begins in main (lines 7–24). Line 9 creates an Account object with an initial balance of $50.00. Recall that Account’s constructor accepts one argument, which specifies the Account’s initial balance. Lines 12–13 output the initial account balance using Account method getBalance. Line 15 declares and initializes a local variable depositAmount. Lines 17–19 then print depositAmount and add it to the Account's balance using its credit method. Finally, lines 22–23 display the new balance. [Note: The Appendix J examples directory contains a copy of Account.java identical to the one in Fig. 3.13.]
Fig. J.1. AccountTest class creates and manipulates an Account object.

In the following steps, you’ll use breakpoints and various debugger commands to examine the value of the variable depositAmount declared in AccountTest (Fig. J.1).
1. Opening the Command Prompt window and changing directories. Open the Command Prompt window by selecting Start > Programs > Accessories > Command Prompt. Change to the directory containing the appendix’s examples by typing cd C:examplesdebugger [Note: If your examples are in a different directory, use that directory here.]
2. Compiling the application for debugging. The Java debugger works only with .class files that were compiled with the -g compiler option, which generates information that is used by the debugger to help you debug your applications. Compile the application with the -g command-line option by typing javac -g AccountTest.java Account.java. This command compiles both AccountTest.java and Account.java. The command java -g *.java compiles all of the working directory’s .java files for debugging.
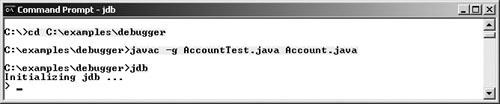
3. Starting the debugger. In the Command Prompt, type jdb (Fig. J.2). This command will start the Java debugger and enable you to use its features.
Fig. J.2. Starting the Java debugger.
4. Running an application in the debugger. Run the AccountTest application through the debugger by typing run AccountTest (Fig. J.3). If you do not set any breakpoints before running your application in the debugger, the application will run just as it would using the java command.
Fig. J.3. Running the AccountTest application through the debugger.

5. Restarting the debugger. To make proper use of the debugger, you must set at least one breakpoint before running the application. Restart the debugger by typing jdb.
6. Inserting breakpoints in Java. You set a breakpoint at a specific line of code in your application. The line numbers used in these steps are from the source code in Fig. J.1. Set a breakpoint at line 12 in the source code by typing stop at AccountTest:12 (Fig. J.4). The stop command inserts a breakpoint at the line number specified after the command. You can set as many breakpoints as necessary. Set another breakpoint at line 19 by typing stop at AccountTest:19 (Fig. J.4). When the application runs, it suspends execution at any line that contains a breakpoint. The application is said to be in break mode when the debugger pauses the application’s execution. Breakpoints can be set even after the debugging process has begun. Note that the debugger command stop in, followed by a class name, a period and a method name (e.g., stop in Account.credit) instructs the debugger to set a breakpoint at the first executable statement in the specified method. The debugger pauses execution when program control enters the method.
Fig. J.4. Setting breakpoints at lines 12 and 19.

7. Running the application and beginning the debugging process. Type run AccountTest to execute your application and begin the debugging process (Fig. J.5). Note that the debugger prints text indicating that breakpoints were set at lines 12 and 19. The debugger calls each breakpoint a “deferred breakpoint” because each was set before the application began running in the debugger. The application pauses when execution reaches the breakpoint on line 12. At this point, the debugger notifies you that a breakpoint has been reached and it displays the source code at that line (12). That line of code is the next statement that will execute.
Fig. J.5. Restarting the AccountTest application.

8. Using the cont command to resume execution. Type cont. The cont command causes the application to continue running until the next breakpoint is reached (line 19), at which point the debugger notifies you (Fig. J.6). Note that AccountTest’s normal output appears between messages from the debugger.
Fig. J.6. Execution reaches the second breakpoint.

9. Examining a variable’s value. Type print depositAmount to display the current value stored in the depositAmount variable (Fig. J.7). The print command allows you to peek inside the computer at the value of one of your variables. This command will help you find and eliminate logic errors in your code. Note that the value displayed is 25.0—the value assigned to depositAmount in line 15 of Fig. J.1.
Fig. J.7. Examining the value of variable depositAmount.

10. Continuing application execution. Type cont to continue the application’s execution. There are no more breakpoints, so the application is no longer in break mode. The application continues executing and eventually terminates (Fig. J.8). The debugger will stop when the application ends.
Fig. J.8. Continuing application execution and exiting the debugger.

In this section, you learned how to enable the debugger and set breakpoints so that you can examine variables with the print command while an application is running. You also learned how to use the cont command to continue execution after a breakpoint is reached.
J.3 The print and set Commands
In the preceding section, you learned how to use the debugger’s print command to examine the value of a variable during program execution. In this section, you’ll learn how to use the print command to examine the value of more complex expressions. You’ll also learn the set command, which allows the programmer to assign new values to variables.
For this section, we assume that you have followed Step 1 and Step 2 in Section J.2 to open the Command Prompt window, change to the directory containing this appendix’s examples (e.g., C:examplesdebugger) and compile the AccountTest application (and class Account) for debugging.
1. Starting debugging. In the Command Prompt, type jdb to start the Java debugger.
2. Inserting a breakpoint. Set a breakpoint at line 19 in the source code by typing stop at AccountTest:19.
3. Running the application and reaching a breakpoint. Type run AccountTest to begin the debugging process (Fig. J.9). This will cause AccountTest’s main to execute until the breakpoint at line 19 is reached. This suspends application execution and switches the application into break mode. At this point, the statements in lines 9–13 created an Account object and printed the initial balance of the Account obtained by calling its getBalance method. The statement in line 15 (Fig. J.1) declared and initialized local variable depositAmount to 25.0. The statement in line 19 is the next statement that will execute.
Fig. J.9. Application execution suspended when debugger reaches the breakpoint at line 19.

4. Evaluating arithmetic and boolean expressions. Recall from Section J.2 that once the application has entered break mode, you can explore the values of the application’s variables using the debugger’s print command. You can also use the print command to evaluate arithmetic and boolean expressions. In the Command Prompt window, type print depositAmount - 2.0. Note that the print command returns the value 23.0 (Fig. J.10). However, this command does not actually change the value of depositAmount. In the Command Prompt window, type print depositAmount == 23.0. Expressions containing the == symbol are treated as boolean expressions. The value returned is false (Fig. J.10) because depositAmount does not currently contain the value 23.0—depositAmount is still 25.0.
Fig. J.10. Examining the values of an arithmetic and boolean expression.

5. Modifying values. The debugger allows you to change the values of variables during the application’s execution. This can be valuable for experimenting with different values and for locating logic errors in applications. You can use the debugger’s set command to change the value of a variable. Type set depositAmount = 75.0. The debugger changes the value of depositAmount and displays its new value (Fig. J.11).
Fig. J.11. Modifying values.

6. Viewing the application result. Type cont to continue application execution. Line 19 of AccountTest (Fig. J.1) executes, passing depositAmount to Account method credit. Method main then displays the new balance. Note that the result is $125.00 (Fig. J.12). This shows that the preceding step changed the value of depositAmount from its initial value (25.0) to 75.0.
Fig. J.12. Output displayed after the debugging process.

In this section, you learned how to use the debugger’s print command to evaluate arithmetic and boolean expressions. You also learned how to use the set command to modify the value of a variable during your application’s execution.
J.4 Controlling Execution Using the step, step up and next Commands
Sometimes you’ll need to execute an application line by line to find and fix errors. Walking through a portion of your application this way can help you verify that a method’s code executes correctly. In this section, you’ll learn how to use the debugger for this task. The commands you learn in this section allow you to execute a method line by line, execute all the statements of a method at once or execute only the remaining statements of a method (if you have already executed some statements within the method).
Once again, we assume you are working in the directory containing this appendix’s examples and have compiled for debugging with the -g compiler option.
1. Starting the debugger. Start the debugger by typing jdb.
2. Setting a breakpoint. Type stop at AccountTest:19 to set a breakpoint at line 19.
3. Running the application. Run the application by typing run AccountTest. After the application displays its two output messages, the debugger indicates that the breakpoint has been reached and displays the code at line 19 (Fig. J.13). The debugger and application then pause and wait for the next command to be entered.
Fig. J.13. Reaching the breakpoint in the AccountTest application.

4. Using the step command. The step command executes the next statement in the application. If the next statement to execute is a method call, control transfers to the called method. The step command enables you to enter a method and study the individual statements of that method. For instance, you can use the print and set commands to view and modify the variables within the method. You’ll now use the step command to enter the credit method of class Account (Fig. 3.13) by typing step (Fig. J.14). The debugger indicates that the step has been completed and displays the next executable statement—in this case, line 21 of class Account (Fig. 3.13).
Fig. J.14. Stepping into the credit method.

5. Using the step up command. After you have stepped into the credit method, type step up. This command executes the remaining statements in the method and returns control to the place where the method was called. The credit method contains only one statement to add the method’s parameter amount to instance variable balance. The step up command executes this statement, then pauses before line 22 in AccountTest. Thus, the next action to occur will be to print the new account balance (Fig. J.15). In lengthy methods, you may want to look at a few key lines of code, then continue debugging the caller’s code. The step up command is useful for situations in which you do not want to continue stepping through the entire method line by line.
Fig. J.15. Stepping out of a method.

6. Using the cont command to continue execution. Enter the cont command (Fig. J.16) to continue execution. The statement at lines 22–23 executes, displaying the new balance, then the application and the debugger terminate.
Fig. J.16. Continuing execution of the AccountTest application.

7. Restarting the debugger. Restart the debugger by typing jdb.
8. Setting a breakpoint. Breakpoints persist only until the end of the debugging session in which they are set—once the debugger exits, all breakpoints are removed. (In Section J.6, you’ll learn how to manually clear a breakpoint before the end of the debugging session.) Thus, the breakpoint set for line 19 in Step 2 no longer exists upon restarting the debugger in Step 7. To reset the breakpoint at line 19, once again type stop at AccountTest:19.
9. Running the application. Type run AccountTest to run the application. As in Step 3, AccountTest runs until the breakpoint at line 19 is reached, then the debugger pauses and waits for the next command (Fig. J.17).
Fig. J.17. Reaching the breakpoint in the AccountTest application.

10. Using the next command. Type next. This command behaves like the step command, except when the next statement to execute contains a method call. In that case, the called method executes in its entirety and the application advances to the next executable line after the method call (Fig. J.18). Recall from Step 4 that the step command would enter the called method. In this example, the next command causes Account method credit to execute, then the debugger pauses at line 22 in AccountTest.
Fig. J.18. Stepping over a method call.

11. Using the exit command. Use the exit command to end the debugging session (Fig. J.19). This command causes the AccountTest application to immediately terminate rather than execute the remaining statements in main. Note that when debugging some types of applications (e.g., GUI applications), the application continues to execute even after the debugging session ends.
Fig. J.19. Exiting the debugger.

In this section, you learned how to use the debugger’s step and step up commands to debug methods called during your application’s execution. You saw how the next command can be used to step over a method call. You also learned that the exit command ends a debugging session.
J.5 The watch Command
In this section, we present the watch command, which tells the debugger to watch a field. When that field is about to change, the debugger will notify you. In this section, you’ll learn how to use the watch command to see how the Account object’s field balance is modified during the execution of the AccountTest application.
As in the preceding two sections, we assume that you have followed Step 1 and Step 2 in Section J.2 to open the Command Prompt, change to the correct examples directory and compile classes AccountTest and Account for debugging (i.e., with the -g compiler option).
1. Starting the debugger. Start the debugger by typing jdb.
2. Watching a class’s field. Set a watch on Account’s balance field by typing watch Account.balance (Fig. J.20). You can set a watch on any field during execution of the debugger. Whenever the value in a field is about to change, the debugger enters break mode and notifies you that the value will change. Watches can be placed only on fields, not on local variables.
Fig. J.20. Setting a watch on Account’s balance field.

3. Running the application. Run the application with the command run AccountTest. The debugger will now notify you that field balance’s value will change (Fig. J.21). When the application begins, an instance of Account is created with an initial balance of $50.00 and a reference to the Account object is assigned to the local variable account (line 9, Fig. J.1). Recall from Fig. 3.13 that when the constructor for this object runs, if parameter initialBalance is greater than 0.0, instance variable balance is assigned the value of parameter initialBalance. The debugger notifies you that the value of balance will be set to 50.0.
Fig. J.21. AccountTest application stops when account is created and its balance field will be modified.

4. Adding money to the account. Type cont to continue executing the application. The application executes normally before reaching the code on line 19 of Fig. J.1 that calls Account method credit to raise the Account object’s balance by a specified amount. The debugger notifies you that instance variable balance will change (Fig. J.22). Note that although line 19 of class AccountTest calls method credit, it is line 21 in Account’s method credit that actually changes the value of balance.
Fig. J.22. Changing the value of balance by calling Account method credit.

5. Continuing execution. Type cont—the application will finish executing because the application does not attempt any additional changes to balance (Fig. J.23).
Fig. J.23. Continuing execution of AccountTest.

6. Restarting the debugger and resetting the watch on the variable. Type jdb to restart the debugger. Once again, set a watch on the Account instance variable balance by typing the watch Account.balance, then type run AccountTest to run the application (Fig. J.24).
Fig. J.24. Restarting the debugger and resetting the watch on the variable balance.

7. Removing the watch on the field. Suppose you want to watch a field for only part of a program’s execution. You can remove the debugger’s watch on variable balance by typing unwatch Account.balance (Fig. J.25). Type cont—the application will finish executing without reentering break mode.
Fig. J.25. Removing the watch on variable balance.

8. Closing the Command Prompt window. Close the Command Prompt window by clicking its close button.
In this section, you learned how to use the watch command to enable the debugger to notify you of changes to the value of a field throughout the life of an application. You also learned how to use the unwatch command to remove a watch on a field before the end of the application.
J.6 The clear Command
In the preceding section, you learned to use the unwatch command to remove a watch on a field. The debugger also provides the clear command to remove a breakpoint from an application. You’ll often need to debug applications containing repetitive actions, such as a loop. You may want to examine the values of variables during several, but possibly not all, of the loop’s iterations. If you set a breakpoint in the body of a loop, the debugger will pause before each execution of the line containing a breakpoint. After determining that the loop is working properly, you may want to remove the breakpoint and allow the remaining iterations to proceed normally. In this section, we use the compound interest application in Fig. 5.6 to demonstrate how the debugger behaves when you set a breakpoint in the body of a for statement and how to remove a breakpoint in the middle of a debugging session.
1. Opening the Command Prompt window, changing directories and compiling the application for debugging. Open the Command Prompt window, then change to the directory containing this appendix’s examples. For your convenience, we have provided a copy of the Interest.java file in this directory. Compile the application for debugging by typing javac -g Interest.java.
2. Starting the debugger and setting breakpoints. Start the debugger by typing jdb. Set breakpoints at lines 13 and 22 of class Interest by typing stop at Interest:13, then stop at Interest:22 (Fig. J.26).
Fig. J.26. Setting breakpoints in the Interest application.

3. Running the application. Run the application by typing run Interest. The application executes until reaching the breakpoint at line 13 (Fig. J.27).
Fig. J.27. Reaching the breakpoint at line 13 in the Interest application.

4. Continuing execution. Type cont to continue—the application executes line 13, printing the column headings "Year" and "Amount on deposit". Note that line 13 appears before the for statement at lines 16–23 in Interest (Fig. 5.6) and thus executes only once. Execution continues past line 13 until the breakpoint at line 22 is reached during the first iteration of the for statement (Fig. J.28).
Fig. J.28. Reaching the breakpoint at line 22 in the Interest application.

5. Examining variable values. Type print year to examine the current value of variable year (i.e., the for’s control variable). Print the value of variable amount too (Fig. J.29).
Fig. J.29. Printing year and amount during the first iteration of Interest’s for.

6. Continuing execution. Type cont to continue execution. Line 22 executes and prints the current values of year and amount. After the for enters its second iteration, the debugger notifies you that the breakpoint at line 22 has been reached a second time. Note that the debugger pauses each time a line where a breakpoint has been set is about to execute—when the breakpoint appears in a loop, the debugger pauses during each iteration. Print the values of variables year and amount again to see how the values have changed since the first iteration of the for (Fig. J.30).
Fig. J.30. Printing year and amount during the second iteration of Interest’s for.

7. Removing a breakpoint. You can display a list of all of the breakpoints in the application by typing clear (Fig. J.31). Suppose you are satisfied that the Interest application’s for statement is working properly, so you want to remove the breakpoint at line 22 and allow the remaining iterations of the loop to proceed normally. You can remove the breakpoint at line 22 by typing clear Interest:22. Now type clear to list the remaining breakpoints in the application. The debugger should indicate that only the breakpoint at line 13 remains (Fig. J.31). Note that this breakpoint has already been reached and thus will no longer affect execution.
Fig. J.31. Removing the breakpoint at line 22.

8. Continuing execution after removing a breakpoint. Type cont to continue execution. Recall that execution last paused before the printf statement in line 22. If the breakpoint at line 22 was removed successfully, continuing the application will produce the correct output for the current and remaining iterations of the for statement without the application halting (Fig. J.32).
Fig. J.32. Application executes without a breakpoint set at line 22.

In this section, you learned how to use the clear command to list all the breakpoints set for an application and remove a breakpoint.
J.7 Wrap-Up
In this appendix, you learned how to insert and remove breakpoints in the debugger. Breakpoints allow you to pause application execution so you can examine variable values with the debugger’s print command. This capability will help you locate and fix logic errors in your applications. You saw how to use the print command to examine the value of an expression and how to use the set command to change the value of a variable. You also learned debugger commands (including the step, step up and next commands) that can be used to determine whether a method is executing correctly. You learned how to use the watch command to keep track of a field throughout the life of an application. Finally, you learned how to use the clear command to list all the breakpoints set for an application or remove individual breakpoints to continue execution without breakpoints.