CHAPTER 5 Balance Sheet and Statement of Cash Flows
LEARNING OBJECTIVES
After studying this chapter, you should be able to:
- Explain the uses and limitations of a balance sheet.
- Identify the major classifications of the balance sheet.
- Prepare a classified balance sheet using the report and account formats.
- Indicate the purpose of the statement of cash flows.
- Identify the content of the statement of cash flows.
- Prepare a basic statement of cash flows.
- Understand the usefulness of the statement of cash flows.
- Determine which balance sheet information requires supplemental disclosure.
- Describe the major disclosure techniques for the balance sheet.
Hey, It Doesn't Balance!
A good accounting student knows by now that Total Assets = Total Liabilities + Total Equity. From this equation, we can also determine net assets, which are determined as follows: Total Assets − Total Liabilities = Net Assets. O.K., this is simple so far. But let's look at the recent discussion paper by the FASB/IASB on how the statement of financial position (the balance sheet) should be structured.
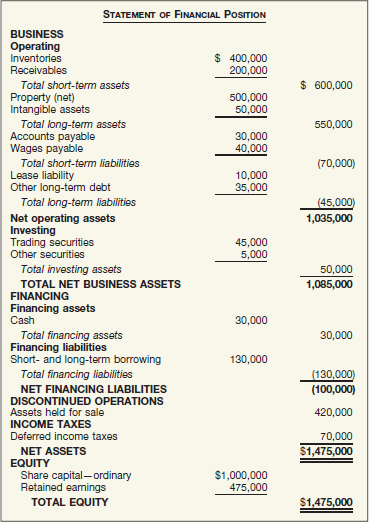
The statement of financial position is divided into five major parts, with many assets and liabilities netted against one another. Here is the general framework for the new statement of financial position:

The statement does look a bit different than the traditional balance sheet. Let's put some numbers to the statement and see how it works. (See the example on the facing page.)
Well, it does balance—in that net assets equal equity—but isn't it important to know total assets and total liabilities? As some have observed, the statement of financial position will not balance the way we expect it to. That is, assets won't equal liabilities and equity. This is because the assets and liabilities are grouped into the business, financing, discontinued operations, and income taxes categories. This new model raises a number of questions, such as:
- Does separating “business activities from financing activities” provide information that is more decision-useful?
- Does information on income taxes and discontinued operations merit separate categories?
The FASB and IASB are working to get answers to these and other questions about this proposed model. One thing is for sure—adoption of the new financial statements will be a dramatic change but hopefully one for the better.
- See the Underlying Concepts on pages 227, 228, 237, 240, and 241.
- Read the Evolving Issue on page 243 for a discussion of balance sheet reporting.
![]() INTERNATIONAL FOCUS
INTERNATIONAL FOCUS
- See the International Perspectives on pages 231 and 242.
- Read the IFRS Insights on pages 277–284 for a discussion of:
- Classification in the statement of financial position
- Equity
- Revaluation equity
- Fair presentation
Sources: Marie Leone and Tim Reason, “How Extreme Is the Makeover?” CFO Magazine (March 1, 2009); and Preliminary Views on Financial Statement Presentation, FASB/IASB Discussion Paper (October 2008).
PREVIEW OF CHAPTER 5
As the opening story indicates, the FASB and IASB are working to improve the presentation of financial information on the balance sheet, as well as other financial statements. In this chapter, we examine the many different types of assets, liabilities, and equity items that affect the balance sheet and the statement of cash flows. The content and organization of the chapter are as follows.
BALANCE SHEET
The balance sheet, sometimes referred to as the statement of financial position, reports the assets, liabilities, and stockholders' equity of a business enterprise at a specific date. This financial statement provides information about the nature and amounts of investments in enterprise resources, obligations to creditors, and the owners' equity in net resources. It therefore helps in predicting the amounts, timing, and uncertainty of future cash flows.
Usefulness of the Balance Sheet
By providing information on assets, liabilities, and stockholders' equity, the balance sheet provides a basis for computing rates of return and evaluating the capital structure of the enterprise. Analysts also use information in the balance sheet to assess a company's risk1 and future cash flows. In this regard, analysts use the balance sheet to assess a company's liquidity, solvency, and financial flexibility.
Liquidity describes “the amount of time that is expected to elapse until an asset is realized or otherwise converted into cash or until a liability has to be paid.”2 Creditors are interested in short-term liquidity ratios, such as the ratio of cash (or near cash) to short-term liabilities. These ratios indicate whether a company, like Amazon.com, will have the resources to pay its current and maturing obligations. Similarly, stockholders assess liquidity to evaluate the possibility of future cash dividends or the buyback of shares. In general, the greater Amazon's liquidity, the lower its risk of failure.
Solvency refers to the ability of a company to pay its debts as they mature. For example, when a company carries a high level of long-term debt relative to assets, it has lower solvency than a similar company with a low level of long-term debt. Companies with higher debt are relatively more risky because they will need more of their assets to meet their fixed obligations (interest and principal payments).
Liquidity and solvency affect a company's financial flexibility, which measures the “ability of an enterprise to take effective actions to alter the amounts and timing of cash flows so it can respond to unexpected needs and opportunities.”3 For example, a company may become so loaded with debt—so financially inflexible—that it has little or no sources of cash to finance expansion or to pay off maturing debt. A company with a high degree of financial flexibility is better able to survive bad times, to recover from unexpected setbacks, and to take advantage of profitable and unexpected investment opportunities. Generally, the greater an enterprise's financial flexibility, the lower its risk of failure.
Limitations of the Balance Sheet

Some of the major limitations of the balance sheet are:
- Most assets and liabilities are reported at historical cost. As a result, the information provided in the balance sheet is often criticized for not reporting a more relevant fair value. For example, Georgia-Pacific owns timber and other assets that may appreciate in value after purchase. Yet, Georgia-Pacific reports any increase only if and when it sells the assets.
- Companies use judgments and estimates to determine many of the items reported in the balance sheet. For example, in its balance sheet, Dell estimates the amount of receivables that it will collect, the useful life of its warehouses, and the number of computers that will be returned under warranty.
- The balance sheet necessarily omits many items that are of financial value but that a company cannot record objectively. For example, the knowledge and skill of Intel employees in developing new computer chips are arguably the company's most significant assets. However, because Intel cannot reliably measure the value of its employees and other intangible assets (such as customer base, research superiority, and reputation), it does not recognize these items in the balance sheet. Similarly, many liabilities are reported in an “off-balance-sheet” manner, if at all.
The bankruptcy of Enron, the seventh-largest U.S. company at the time, highlights the omission of important items in the balance sheet. In Enron's case, it failed to disclose certain off-balance-sheet financing obligations in its main financial statements.4
What do the numbers mean? GROUNDED
The terrorist attacks of September 11, 2001, showed how vulnerable the major airlines are to falling demand for their services. Since that infamous date, major airlines have reduced capacity and slashed jobs to avoid bankruptcy. United Airlines, Northwest Airlines, US Airways, and several smaller competitors filed for bankruptcy in the wake of 9/11.
Delta Airlines made the following statements in its annual report issued shortly after 9/11:
“If we are unsuccessful in further reducing our operating costs… we will need to restructure our costs under Chapter 11 of the U.S. Bankruptcy Code…. We have substantial liquidity needs and there is no assurance that we will be able to obtain the necessary financing to meet those needs on acceptable terms, if at all.”
These financial flexibility challenges have continued, exacerbated by ever-increasing fuel prices, labor costs, and the economic downturn in response to the financial crisis. Not surprisingly, several of the major airlines (Delta and Northwest, Continental and United, and Airtran and Southwest) merged recently as a way to build some competitive synergies and to bolster their financial flexibility. Others (American Airlines and US Airways) are exploring mergers.
Source: R. Seaney, “Airline Mergers: Good for Travelers?” http://abcnews.go.com/Travel/airline-merger-mania-cost/story?id=16227892 (April 27, 2012).
Classification in the Balance Sheet
LEARNING OBJECTIVE ![]()
Identify the major classifications of the balance sheet.
Balance sheet accounts are classified. That is, balance sheets group together similar items to arrive at significant subtotals. Furthermore, the material is arranged so that important relationships are shown.
The FASB has often noted that the parts and subsections of financial statements can be more informative than the whole. Therefore, the FASB discourages the reporting of summary accounts alone (total assets, net assets, total liabilities, etc.). Instead, companies should report and classify individual items in sufficient detail to permit users to assess the amounts, timing, and uncertainty of future cash flows. Such classification also makes it easier for users to evaluate the company's liquidity, financial flexibility, profitability, and risk.
To classify items in financial statements, companies group those items with similar characteristics and separate items with different characteristics.5 For example, companies should report separately:
- Assets that differ in their type or expected function in the company's central operations or other activities. For example, IBM reports merchandise inventories separately from property, plant, and equipment.
- Assets and liabilities with different implications for the company's financial flexibility. For example, a company that uses assets in its operations, like Walgreens, should report those assets separately from assets held for investment and assets subject to restrictions, such as leased equipment.
- Assets and liabilities with different general liquidity characteristics. For example, Boeing Company reports cash separately from inventories.
The three general classes of items included in the balance sheet are assets, liabilities, and equity. We defined them in Chapter 2 as follows.
ELEMENTS OF THE BALANCE SHEET
- ASSETS. Probable future economic benefits obtained or controlled by a particular entity as a result of past transactions or events.
- LIABILITIES. Probable future sacrifices of economic benefits arising from present obligations of a particular entity to transfer assets or provide services to other entities in the future as a result of past transactions or events.
- EQUITY. Residual interest in the assets of an entity that remains after deducting its liabilities. In a business enterprise, the equity is the ownership interest.6
Companies then further divide these items into several subclassifications. Illustration 5-1 indicates the general format of balance sheet presentation.

A company may classify the balance sheet in some other manner, but in practice you usually see little departure from these major subdivisions. A proprietorship or partnership does present the classifications within the owners' equity section a little differently, as we will show later in the chapter.
Current Assets
Current assets are cash and other assets a company expects to convert into cash, sell, or consume either in one year or in the operating cycle, whichever is longer. The operating cycle is the average time between when a company acquires materials and supplies and when it receives cash for sales of the product (for which it acquired the materials and supplies). The cycle operates from cash through inventory, production, receivables, and back to cash. When several operating cycles occur within one year (which is generally the case for service companies), a company uses the one-year period. If the operating cycle is more than one year, a company uses the longer period.
Current assets are presented in the balance sheet in order of liquidity. The five major items found in the current assets section, and their bases of valuation, are shown in Illustration 5-2.

A company does not report these five items as current assets if it does not expect to realize them in one year or in the operating cycle, whichever is longer. For example, a company excludes from the current assets section cash restricted for purposes other than payment of current obligations or for use in current operations. Generally, if a company expects to convert an asset into cash or to use it to pay a current liability within a year or the operating cycle, whichever is longer, it classifies the asset as current.
This rule, however, is subject to interpretation. A company classifies an investment in common stock as either a current asset or a noncurrent asset depending on management's intent. When it has small holdings of common stocks or bonds that it will hold long-term, it should not classify them as current.
Although a current asset is well defined, certain theoretical problems also develop. For example, how is including prepaid expenses in the current assets section justified? The rationale is that if a company did not pay these items in advance, it would instead need to use other current assets during the operating cycle. If we follow this logic to its ultimate conclusion, however, any asset previously purchased saves the use of current assets during the operating cycle and would be considered current.
Another problem occurs in the current-asset definition when a company consumes plant assets during the operating cycle. Conceptually, it seems that a company should place in the current assets section an amount equal to the current depreciation charge on the plant assets, because it will consume them in the next operating cycle. However, this conceptual problem is ignored. This example illustrates that the formal distinction made between some current and noncurrent assets is somewhat arbitrary.
Cash. Cash is generally considered to consist of currency and demand deposits (monies available on demand at a financial institution). Cash equivalents are short-term highly liquid investments that will mature within three months or less. Most companies use the caption “Cash and cash equivalents,” and they indicate that this amount approximates fair value.
A company must disclose any restrictions or commitments related to the availability of cash. As an example, see the excerpt from the annual report of Alterra Healthcare Corp. in Illustration 5-3 (page 218).
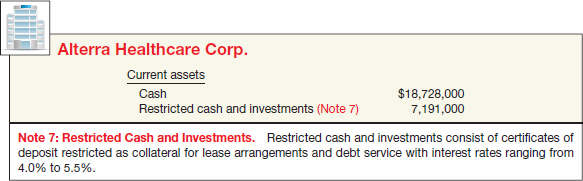
Alterra Healthcare restricted cash to meet an obligation due currently. Therefore, Alterra included this restricted cash under current assets.
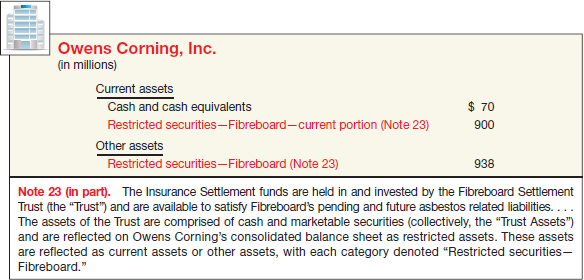
If a company restricts cash for purposes other than current obligations, it excludes the cash from current assets. Illustration 5-4 shows an example of this, from the annual report of Owens Corning, Inc.
Short-Term Investments. Companies group investments in debt and equity securities into three separate portfolios for valuation and reporting purposes:
Held-to-maturity: Debt securities that a company has the positive intent and ability to hold to maturity.
Trading: Debt and equity securities bought and held primarily for sale in the near term to generate income on short-term price differences.
Available-for-sale: Debt and equity securities not classified as held-to-maturity or trading securities.
![]() See the FASB Codification section (page 255).
See the FASB Codification section (page 255).
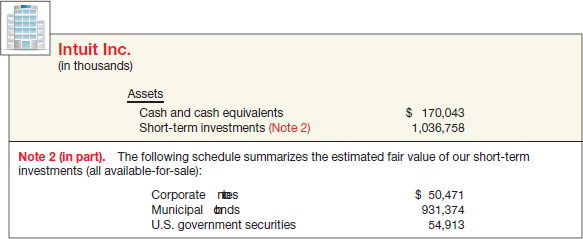
A company should report trading securities (whether debt or equity) as current assets. It classifies individual held-to-maturity and available-for-sale securities as current or noncurrent depending on the circumstances. It should report held-to-maturity securities at amortized cost. All trading and available-for-sale securities are reported at fair value. [1]7
For example, Illustration 5-5 is an excerpt from the annual report of Intuit Inc. with respect to its available-for-sale investments.
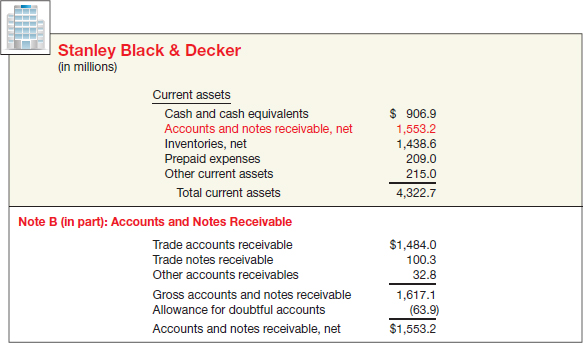
Receivables. A company should clearly identify any anticipated loss due to uncollectibles, the amount and nature of any nontrade receivables, and any receivables used as collateral. Major categories of receivables should be shown in the balance sheet or the related notes. For receivables arising from unusual transactions (such as sale of property, or a loan to affiliates or employees), companies should separately classify these as long-term, unless collection is expected within one year. Stanley Black & Decker reported its receivables as shown in Illustration 5-6.
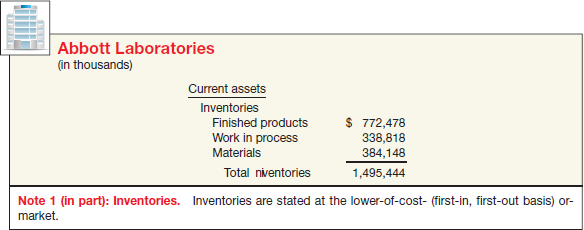
Inventories. To present inventories properly, a company discloses the basis of valuation (e.g., lower-of-cost-or-market) and the cost flow assumption used (e.g., FIFO or LIFO). A manufacturing concern (like Abbott Laboratories, shown in Illustration 5-7 on page 220) also indicates the stage of completion of the inventories.
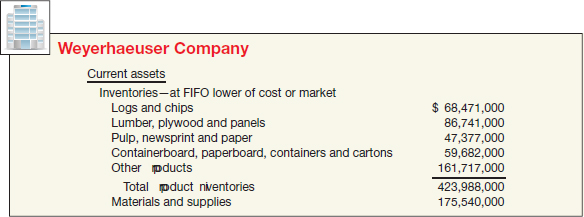
Weyerhaeuser Company, a forestry company and lumber manufacturer with several finished-goods product lines, reported its inventory as shown in Illustration 5-8.
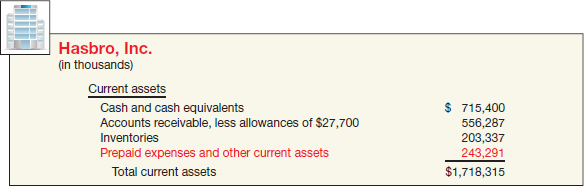
Prepaid Expenses. A company includes prepaid expenses in current assets if it will receive benefits (usually services) within one year or the operating cycle, whichever is longer. As we discussed earlier, these items are current assets because if they had not already been paid, they would require the use of cash during the next year or the operating cycle. A company reports prepaid expenses at the amount of the unexpired or unconsumed cost.
A common example is the prepayment for an insurance policy. A company classifies it as a prepaid expense because the payment precedes the receipt of the benefit of coverage. Other common prepaid expenses include prepaid rent, advertising, taxes, and office or operating supplies. Hasbro, Inc., for example, listed its prepaid expenses in current assets as shown in Illustration 5-9.
Noncurrent Assets
Noncurrent assets are those not meeting the definition of current assets. They include a variety of items, as we discuss in the following sections.
Long-Term Investments. Long-term investments, often referred to simply as investments, normally consist of one of four types:
- Investments in securities, such as bonds, common stock, or long-term notes.
- Investments in tangible fixed assets not currently used in operations, such as land held for speculation.
- Investments set aside in special funds, such as a sinking fund, pension fund, or plant expansion fund. This includes the cash surrender value of life insurance.
- Investments in nonconsolidated subsidiaries or affiliated companies.
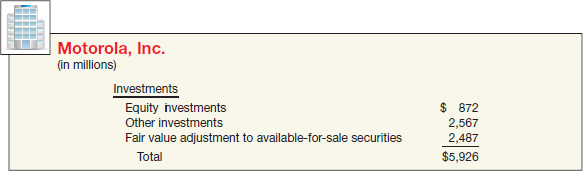
Companies expect to hold long-term investments for many years. They usually present them on the balance sheet just below “Current assets,” in a separate section called “Investments.” Realize that many securities classified as long-term investments are, in fact, readily marketable. But a company does not include them as current assets unless it intends to convert them to cash in the short-term—that is, within a year or in the operating cycle, whichever is longer. As indicated earlier, securities classified as available-for-sale are reported at fair value, and held-to-maturity securities are reported at amortized cost.
Motorola, Inc. reported its investments section, located between “Property, plant, and equipment” and “Other assets,” as shown in Illustration 5-10.
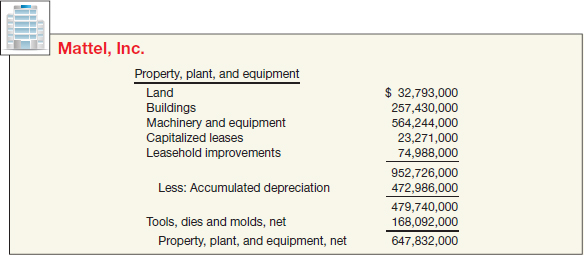
Property, Plant, and Equipment. Property, plant, and equipment are tangible long-lived assets used in the regular operations of the business. These assets consist of physical property such as land, buildings, machinery, furniture, tools, and wasting resources (timberland, minerals). With the exception of land, a company either depreciates (e.g., buildings) or depletes (e.g., timberlands or oil reserves) these assets.
Mattel, Inc. presented its property, plant, and equipment in its balance sheet as shown in Illustration 5-11 (page 222).
A company discloses the basis it uses to value property, plant, and equipment; any liens against the properties; and accumulated depreciation—usually in the notes to the financial statements.
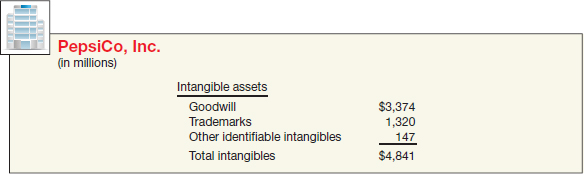
Intangible Assets. Intangible assets lack physical substance and are not financial instruments (see page 238 for the definition of a financial instrument). They include patents, copyrights, franchises, goodwill, trademarks, trade names, and customer lists. A company writes off (amortizes) limited-life intangible assets over their useful lives. It periodically assesses indefinite-life intangibles (such as goodwill) for impairment. Intangibles can represent significant economic resources, yet financial analysts often ignore them, because valuation is difficult.
PepsiCo, Inc. reported intangible assets in its balance sheet as shown in Illustration 5-12.
Other Assets. The items included in the section “Other assets” vary widely in practice. Some include items such as long-term prepaid expenses, prepaid pension cost, and noncurrent receivables. Other items that might be included are assets in special funds, deferred income taxes, property held for sale, and restricted cash or securities. A company should limit this section to include only unusual items sufficiently different from assets included in specific categories.
Liabilities
Similar to assets, companies classify liabilities as current or long-term.
Current Liabilities. Current liabilities are the obligations that a company reasonably expects to liquidate either through the use of current assets or the creation of other current liabilities. This concept includes:
- Payables resulting from the acquisition of goods and services: accounts payable, wages payable, taxes payable, and so on.
- Collections received in advance for the delivery of goods or performance of services, such as unearned rent revenue or unearned subscriptions revenue.
- Other liabilities whose liquidation will take place within the operating cycle, such as the portion of long-term bonds to be paid in the current period or short-term obligations arising from the purchase of equipment.
At times, a liability that is payable within the next year is not included in the current liabilities section. This occurs either when the company expects to refinance the debt through another long-term issue [3] or to retire the debt out of noncurrent assets. This approach is used because liquidation does not result from the use of current assets or the creation of other current liabilities.
Companies do not report current liabilities in any consistent order. In general, though, companies most commonly list notes payable, accounts payable, or short-term debt as the first item. Income taxes payable, current maturities of long-term debt, or other current liabilities are commonly listed last. For example, see Halliburton Company's current liabilities section in Illustration 5-13.
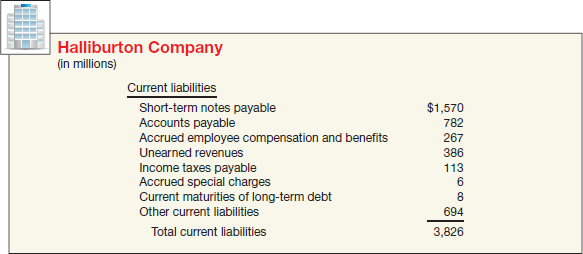
Current liabilities include such items as trade and nontrade notes and accounts payable, advances received from customers, and current maturities of long-term debt. If the amounts are material, companies classify income taxes and other accrued items separately. A company should fully describe in the notes any information about a secured liability—for example, stock held as collateral on notes payable—to identify the assets providing the security.
The excess of total current assets over total current liabilities is referred to as working capital (or sometimes net working capital). Working capital represents the net amount of a company's relatively liquid resources. That is, it is the liquidity buffer available to meet the financial demands of the operating cycle.
Companies seldom disclose on the balance sheet an amount for working capital. But bankers and other creditors compute it as an indicator of the short-run liquidity of a company. To determine the actual liquidity and availability of working capital to meet current obligations, however, requires analysis of the composition of the current assets and their nearness to cash.
What do the numbers mean? “SHOW ME THE ASSETS!”
Before the dot-com bubble burst, concerns about liquidity and solvency led creditors of many dot-com companies to demand more assurances that these companies could pay their bills when due. A key indicator for creditors is the amount of working capital. For example, when a report predicted that Amazon.com's working capital would turn negative, the company's vendors began to explore steps that would ensure that Amazon would pay them.
Some vendors demanded that their dot-com customers sign notes stating that the goods shipped to them would serve as collateral for the transaction. Other vendors began shipping goods on consignment—an arrangement whereby the vendor retains ownership of the goods until a third party buys and pays for them.
Another recent bubble in the real estate market created a working capital and liquidity crisis for no less a revered financial institution than Bear Stearns. What happened? Bear Stearns was one of the biggest investors in mortgage-backed securities. But when the housing market cooled off and the value of the collateral backing Bear Stearns's mortgage securities dropped dramatically, the market began to question Bear Stearns's ability to meet its obligations. The result: The Federal Reserve stepped in to avert a collapse of the company, backing a bailout plan that guaranteed $30 billion of Bear Stearns's investments. This paved the way for a buy-out by JPMorgan Chase at $2 per share (later amended to $10 a share)—quite a bargain since Bear Stearns had been trading above $80 a share just a month earlier.
Source: Robin Sidel, Greg Ip, Michael M. Phillips, and Kate Kelly, “The Week That Shook Wall Street: Inside the Demise of Bear Stearns,” Wall Street Journal (March 18, 2008), p. A1.
Long-Term Liabilities. Long-term liabilities are obligations that a company does not reasonably expect to liquidate within the normal operating cycle. Instead, it expects to pay them at some date beyond that time. The most common examples are bonds payable, notes payable, some deferred income tax amounts, lease obligations, and pension obligations. Companies classify long-term liabilities that mature within the current operating cycle as current liabilities if payment of the obligation requires the use of current assets.
Generally, long-term liabilities are of three types:
- Obligations arising from specific financing situations, such as the issuance of bonds, long-term lease obligations, and long-term notes payable.
- Obligations arising from the ordinary operations of the company, such as pension obligations and deferred income tax liabilities.
- Obligations that depend on the occurrence or non-occurrence of one or more future events to confirm the amount payable, the payee, or the date payable, such as service or product warranties and other contingencies.
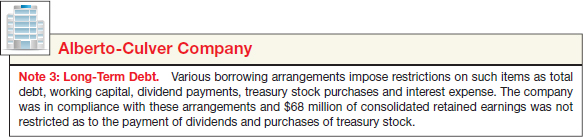
Companies generally provide a great deal of supplementary disclosure for long-term liabilities because most long-term debt is subject to various covenants and restrictions for the protection of lenders.8
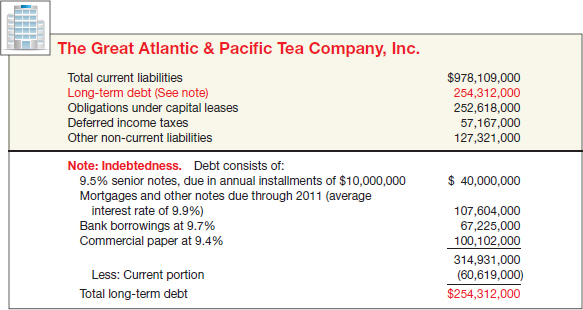
It is desirable to report any premium or discount separately as an addition to or subtraction from the bonds payable. Companies frequently describe the terms of all long-term liability agreements (including maturity date or dates, rates of interest, nature of obligation, and any security pledged to support the debt) in notes to the financial statements. Illustration 5-14 provides an example of this, taken from an excerpt from The Great Atlantic & Pacific Tea Company's financials.
Owners' Equity
The owners' equity (stockholders' equity) section is one of the most difficult sections to prepare and understand. This is due to the complexity of capital stock agreements and the various restrictions on stockholders' equity imposed by state corporation laws, liability agreements, and boards of directors. Companies usually divide the section into six parts:
STOCKHOLDERS’ EQUITY SECTION
- CAPITAL STOCK. The par or stated value of the shares issued.
- ADDITIONAL PAID-IN CAPITAL. The excess of amounts paid in over the par or stated value.
- RETAINED EARNINGS. The corporation's undistributed earnings.
- ACCUMULATED OTHER COMPREHENSIVE INCOME. The aggregate amount of the other comprehensive income items.
- TREASURY STOCK. Generally, the amount of ordinary shares repurchased.
- NONCONTROLLING INTEREST (MINORITY INTEREST). A portion of the equity of subsidiaries not wholly owned by the reporting company.
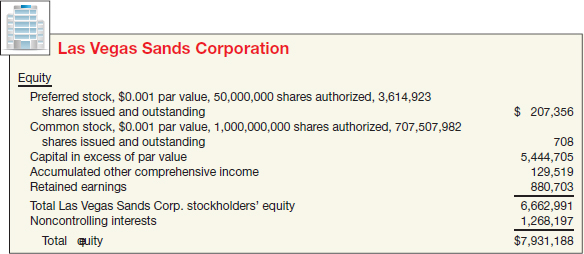
For capital stock, companies must disclose the par value and the authorized, issued, and outstanding share amounts. A company usually presents the additional paid-in capital in one amount although subtotals are informative if the sources of additional capital are varied and material. The retained earnings amount may be divided between the unappropriated (the amount that is usually available for dividend distribution) and restricted (e.g., by bond indentures or other loan agreements) amounts. In addition, companies show any capital stock reacquired (treasury stock) as a reduction of stockholders' equity. Accumulated other comprehensive income includes such items as unrealized gains and losses on available-for-sale investments and unrealized gains and losses on certain derivative transactions. Noncontrolling interest (discussed in Chapter 4 and sometimes referred to as minority interest) is also shown as a separate item (where applicable) as a part of equity.
Illustration 5-15 (page 226) presents an example of the stockholders' equity section from Las Vegas Sands Corporation.
The ownership or stockholders' equity accounts in a corporation differ considerably from those in a partnership or proprietorship. Partners show separately their permanent capital accounts and the balance in their temporary accounts (drawing accounts). Proprietorships ordinarily use a single capital account that handles all of the owner's equity transactions.
What do the numbers mean? WARNING SIGNALS
Analysts use balance sheet information in models designed to predict financial distress. Researcher E. I. Altman pioneered a bankruptcy-prediction model that derives a “Z-score” by combining balance sheet and income measures in the following equation.
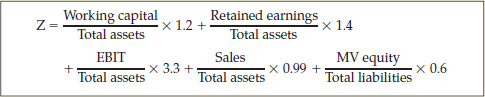
Following extensive testing, Altman found that companies with Z-scores above 3.0 are unlikely to fail. Those with Z-scores below 1.81 are very likely to fail.
Altman developed the original model for publicly held manufacturing companies. He and others have modified the model to apply to companies in various industries, emerging companies, and companies not traded in public markets.
At one time, the use of Z-scores was virtually unheard of among practicing accountants. Today, auditors, management consultants, and courts of law use this measure to help evaluate the overall financial position and trends of a firm. In addition, banks use Z-scores for loan evaluation. While a low score does not guarantee bankruptcy, the model has been proven accurate in many situations.
Source: Adapted from E. I. Altman and E. Hotchkiss, Corporate Financial Distress and Bankruptcy, Third Edition (New York: John Wiley and Sons, 2005).
Balance Sheet Format
LEARNING OBJECTIVE ![]()
Prepare a classified balance sheet using the report and account formats.
One common arrangement that companies use in presenting a classified balance sheet is the account form. It lists assets, by sections, on the left side, and liabilities and stockholders' equity, by sections, on the right side. The main disadvantage is the need for a sufficiently wide space in which to present the items side by side. Often, the account form requires two facing pages.
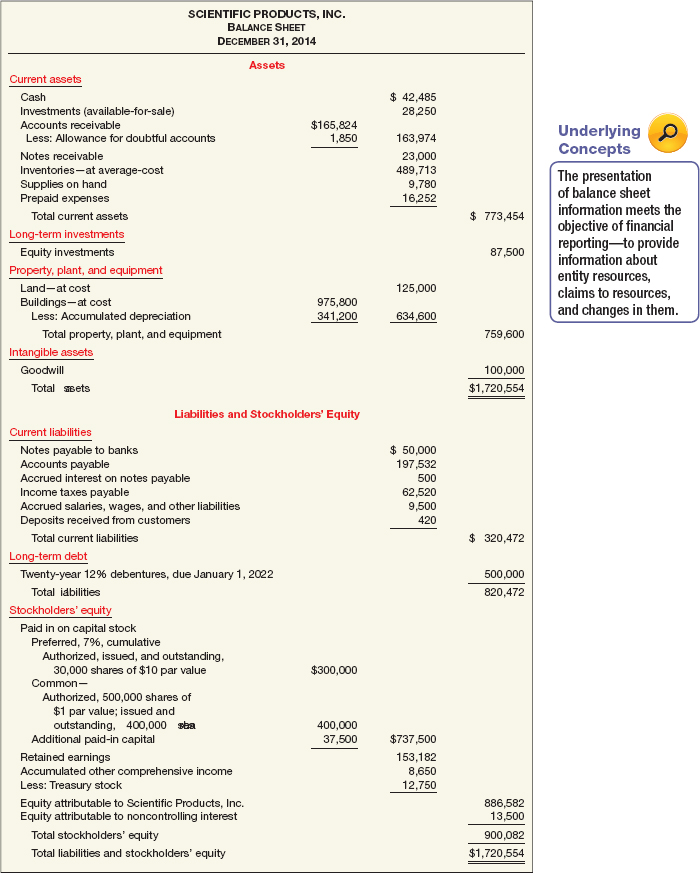
To avoid this disadvantage, the report form lists the sections one above the other, on the same page. See, for example, Illustration 5-16, which lists assets, followed by liabilities and stockholders' equity directly below, on the same page.9
Infrequently, companies use other balance sheet formats. For example, companies sometimes deduct current liabilities from current assets to arrive at working capital. Or, they deduct all liabilities from all assets.
STATEMENT OF CASH FLOWS
LEARNING OBJECTIVE ![]()
Indicate the purpose of the statement of cash flows.
Chapter 2 indicated that an important element of the objective of financial reporting is “assessing the amounts, timing, and uncertainty of cash flows.” The three financial statements we have looked at so far—the income statement, the statement of stockholders' equity, and the balance sheet—each present some information about the cash flows of an enterprise during a period. But they do so to a limited extent. For instance, the income statement provides information about resources provided by operations but not exactly cash. The statement of stockholders' equity shows the amount of cash used to pay dividends or purchase treasury stock. Comparative balance sheets might show what assets the company has acquired or disposed of, and what liabilities it has incurred or liquidated.
![]() Underlying Concepts
Underlying Concepts
The statement of cash flows meets the objective of financial reporting—to help assess the amounts, timing, and uncertainty of future cash flows.
Useful as they are, none of these statements presents a detailed summary of all the cash inflows and outflows, or the sources and uses of cash during the period. To fill this need, the FASB requires the statement of cash flows (also called the cash flow statement). [5]
What do the numbers mean? WATCH THAT CASH FLOW
Investors usually focus on net income measured on an accrual basis. However, information on cash flows can be important for assessing a company's liquidity, financial flexibility, and overall financial performance. The graph below shows W. T. Grant's financial performance over 7 years.
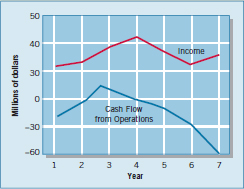
Although W. T. Grant showed consistent profits and even some periods of earnings growth, its cash flow began to “go south” starting in about year 3. The company filed for bankruptcy shortly after year 7. Financial statement readers who studied the company's cash flows would have found early warnings of its problems. The Grant experience is a classic case, illustrating the importance of cash flows as an early-warning signal of financial problems.
A more recent retailer case is Target. Although Target has shown good profits, some are concerned that a bit too much of its sales have been made on credit rather than cash. Why is this a problem? Like W. T. Grant, the earnings of profitable lenders can get battered in future periods if they have to start adding large amounts to their bad-loan reserve to catch up with credit losses. And if losses ramp up on Target-branded credit cards, Target may get hit in this way.
Source: Peter Eavis, “Is Target Corp.'s Credit Too Generous?” Wall Street Journal (March 11, 2008), p. C1.
Purpose of the Statement of Cash Flows
The primary purpose of a statement of cash flows is to provide relevant information about the cash receipts and cash payments of an enterprise during a period. To achieve this purpose, the statement of cash flows reports the following: (1) the cash effects of operations during a period, (2) investing transactions, (3) financing transactions, and (4) the net increase or decrease in cash during the period.10
Reporting the sources, uses, and net increase or decrease in cash helps investors, creditors, and others know what is happening to a company's most liquid resource. Because most individuals maintain a checkbook and prepare a tax return on a cash basis, they can comprehend the information reported in the statement of cash flows.
The statement of cash flows provides answers to the following simple but important questions:
- Where did the cash come from during the period?
- What was the cash used for during the period?
- What was the change in the cash balance during the period?
Content and Format of the Statement of Cash Flows
LEARNING OBJECTIVE ![]()
Identify the content of the statement of cash flows.
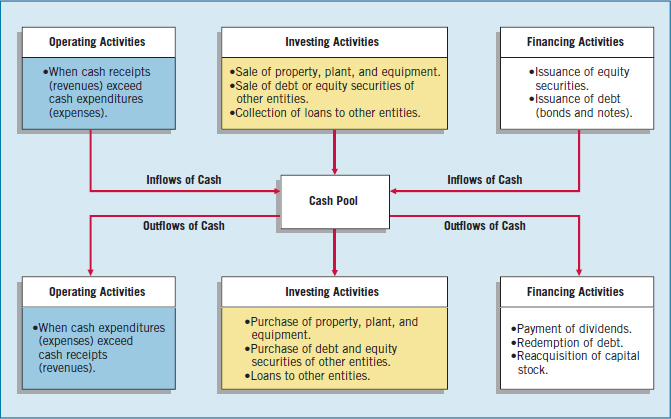
Companies classify cash receipts and cash payments during a period into three different activities in the statement of cash flows—operating, investing, and financing activities, defined as follows.
- Operating activities involve the cash effects of transactions that enter into the determination of net income.
- Investing activities include making and collecting loans and acquiring and disposing of investments (both debt and equity) and property, plant, and equipment.
- Financing activities involve liability and owners' equity items. They include (a) obtaining resources from owners and providing them with a return on their investment, and (b) borrowing money from creditors and repaying the amounts borrowed.
Illustration 5-17 shows the basic format of the statement of cash flows.
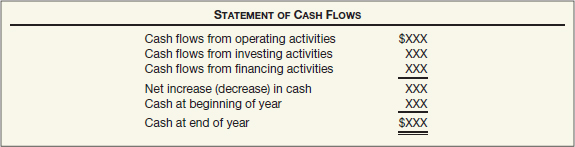
Illustration 5-18 (page 230) graphs the inflows and outflows of cash classified by activity.
The statement's value is that it helps users evaluate liquidity, solvency, and financial flexibility. As stated earlier, liquidity refers to the “nearness to cash” of assets and liabilities. Solvency is the firm's ability to pay its debts as they mature. Financial flexibility is a company's ability to respond and adapt to financial adversity and unexpected needs and opportunities.
We have devoted Chapter 23 entirely to the detailed preparation and content of the statement of cash flows. The intervening chapters will cover several elements and complex topics that affect the content of a typical statement of cash flows. The presentation in this chapter is introductory—a reminder of the existence of the statement of cash flows and its usefulness.
Overview of the Preparation of the Statement of Cash Flows
Sources of Information
LEARNING OBJECTIVE ![]()
Prepare a basic statement of cash flows.
Companies obtain the information to prepare the statement of cash flows from several sources: (1) comparative balance sheets, (2) the current income statement, and (3) selected transaction data.
The following simple example demonstrates how companies use these sources in preparing a statement of cash flows.
On January 1, 2014, in its first year of operations, Telemarketing Inc. issued 50,000 shares of $1 par value common stock for $50,000 cash. The company rented its office space, furniture, and telecommunications equipment and performed marketing services throughout the first year. In June 2014, the company purchased land for $15,000. Illustration 5-19 shows the company's comparative balance sheets at the beginning and end of 2014.
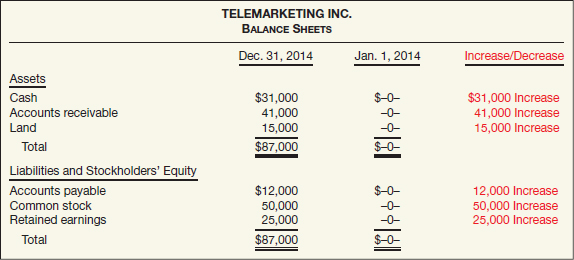
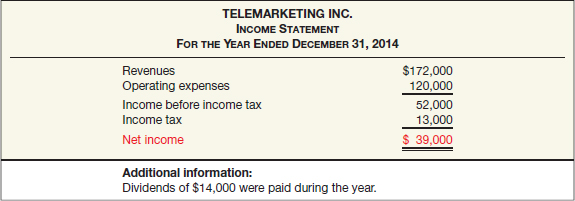
Illustration 5-20 presents the income statement and additional information.
Preparing the Statement of Cash Flows
Preparing the statement of cash flows from these sources involves four steps:
- Determine the net cash provided by (or used in) operating activities.
- Determine the net cash provided by (or used in) investing and financing activities.
- Determine the change (increase or decrease) in cash during the period.
- Reconcile the change in cash with the beginning and the ending cash balances.
Net cash provided by operating activities is the excess of cash receipts over cash payments from operating activities. Companies determine this amount by converting net income on an accrual basis to a cash basis. To do so, they add to or deduct from net income those items in the income statement that do not affect cash. This procedure requires that a company analyze not only the current year's income statement but also the comparative balance sheets and selected transaction data.
Analysis of Telemarketing's comparative balance sheets reveals two items that will affect the computation of net cash provided by operating activities:
- The increase in accounts receivable reflects a noncash increase of $41,000 in revenues.
- The increase in accounts payable reflects a noncash increase of $12,000 in expenses.
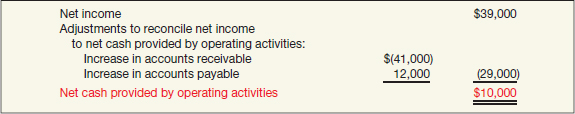
Therefore, to arrive at net cash provided by operating activities, Telemarketing Inc. deducts from net income the increase in accounts receivable ($41,000), and it adds back to net income the increase in accounts payable ($12,000). As a result of these adjustments, the company determines net cash provided by operating activities to be $10,000, computed as shown in Illustration 5-21.
![]() International Perspective
International Perspective
IFRS requires a statement of cash flows. Both IFRS and GAAP specify that the cash flows must be classified as operating, investing, or financing.
Next, the company determines its investing and financing activities. Telemarketing Inc.'s only investing activity was the land purchase. It had two financing activities. (1) Common stock increased $50,000 from the issuance of 50,000 shares for cash. (2) The company paid $14,000 cash in dividends. Knowing the amounts provided/used by operating, investing, and financing activities, the company determines the net increase in cash. Illustration 5-22 (page 232) presents Telemarketing Inc.'s statement of cash flows for 2014.
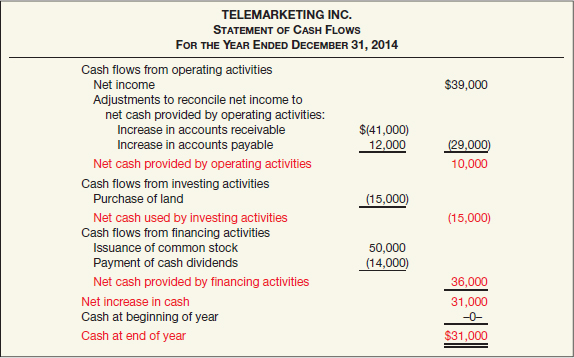
The increase in cash of $31,000 reported in the statement of cash flows agrees with the increase of $31,000 in cash calculated from the comparative balance sheets.
Significant Noncash Activities
Not all of a company's significant activities involve cash. Examples of significant non-cash activities are:
- Issuance of common stock to purchase assets.
- Conversion of bonds into common stock.
- Issuance of debt to purchase assets.
- Exchanges of long-lived assets.
Significant financing and investing activities that do not affect cash are not reported in the body of the statement of cash flows. Rather, these activities are reported in either a separate schedule at the bottom of the statement of cash flows or in separate notes to the financial statements. Such reporting of these noncash activities satisfies the full disclosure principle.
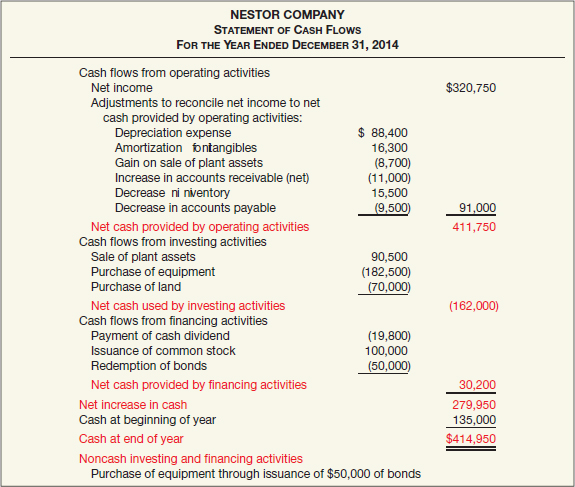
Illustration 5-23 shows an example of a comprehensive statement of cash flows. Note that the company purchased equipment through the issuance of $50,000 of bonds, which is a significant noncash transaction. In solving homework assignments, you should present significant noncash activities in a separate schedule at the bottom of the statement of cash flows.
Usefulness of the Statement of Cash Flows
LEARNING OBJECTIVE ![]()
Understand the usefulness of the statement of cash flows.
“Happiness is a positive cash flow” is certainly true. Although net income provides a long-term measure of a company's success or failure, cash is its lifeblood. Without cash, a company will not survive. For small and newly developing companies, cash flow is the single most important element for survival. Even medium and large companies must control cash flow.
Creditors examine the cash flow statement carefully because they are concerned about being paid. They begin their examination by finding net cash provided by operating activities. A high amount indicates that a company is able to generate sufficient cash from operations to pay its bills without further borrowing. Conversely, a low or negative amount of net cash provided by operating activities indicates that a company may have to borrow or issue equity securities to acquire sufficient cash to pay its bills. Consequently, creditors look for answers to the following questions in the company's cash flow statements.
- How successful is the company in generating net cash provided by operating activities?
- What are the trends in net cash flow provided by operating activities over time?
- What are the major reasons for the positive or negative net cash provided by operating activities?
You should recognize that companies can fail even though they report net income. The difference between net income and net cash provided by operating activities can be substantial. Companies such as W. T. Grant Company and Prime Motor Inn, for example, reported high net income numbers but negative net cash provided by operating activities. Eventually, both companies filed for bankruptcy.
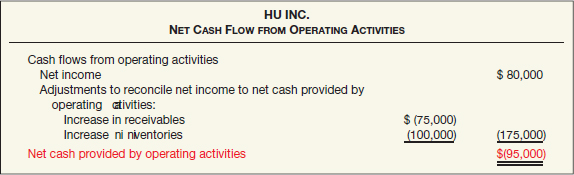
In addition, substantial increases in receivables and/or inventory can explain the difference between positive net income and negative net cash provided by operating activities. For example, in its first year of operations, Hu Inc. reported a net income of $80,000. Its net cash provided by operating activities, however, was a negative $95,000, as shown in Illustration 5-24 (page 234).
Hu could easily experience a “cash crunch” because it has its cash tied up in receivables and inventory. If Hu encounters problems in collecting receivables, or if inventory moves slowly or becomes obsolete, its creditors may have difficulty collecting on their loans.
Financial Liquidity
Readers of financial statements often assess liquidity by using the current cash debt coverage. It indicates whether the company can pay off its current liabilities from its operations in a given year. Illustration 5-25 shows the formula for this ratio.
The higher the current cash debt coverage, the less likely a company will have liquidity problems. For example, a ratio near 1:1 is good. It indicates that the company can meet all of its current obligations from internally generated cash flow.
Financial Flexibility
The cash debt coverage provides information on financial flexibility. It indicates a company's ability to repay its liabilities from net cash provided by operating activities, without having to liquidate the assets employed in its operations. Illustration 5-26 shows the formula for this ratio. Notice its similarity to the current cash debt coverage. However, because it uses average total liabilities in place of average current liabilities, it takes a somewhat longer-range view.
The higher this ratio, the less likely the company will experience difficulty in meeting its obligations as they come due. It signals whether the company can pay its debts and survive if external sources of funds become limited or too expensive.
Free Cash Flow
A more sophisticated way to examine a company's financial flexibility is to develop a free cash flow analysis. Free cash flow is the amount of discretionary cash flow a company has. It can use this cash flow to purchase additional investments, retire its debt, purchase treasury stock, or simply add to its liquidity. Financial statement users calculate free cash flow as shown in Illustration 5-27.

In a free cash flow analysis, we first deduct capital spending, to indicate it is the least discretionary expenditure a company generally makes. (Without continued efforts to maintain and expand facilities, it is unlikely that a company can continue to maintain its competitive position.) We then deduct dividends. Although a company can cut its dividend, it usually will do so only in a financial emergency. The amount resulting after these deductions is the company's free cash flow. Obviously, the greater the amount of free cash flow, the greater the company's financial flexibility.
Questions that a free cash flow analysis answers are:
- Is the company able to pay its dividends without resorting to external financing?
- If business operations decline, will the company be able to maintain its needed capital investment?
- What is the amount of discretionary cash flow that can be used for additional investment, retirement of debt, purchase of treasury stock, or addition to liquidity?
Illustration 5-28 is a free cash flow analysis using the cash flow statement for Nestor Company (shown in Illustration 5-23 on page 233).

This computation shows that Nestor has a positive, and substantial, net cash provided by operating activities of $411,750. Nestor's statement of cash flows reports that the company purchased equipment of $182,500 and land of $70,000 for total capital spending of $252,500. Nestor has more than sufficient cash flow to meet its dividend payment and therefore has satisfactory financial flexibility.
As you can see from looking back at Illustration 5-23 (page 233), Nestor used its free cash flow to redeem bonds and add to its liquidity. If it finds additional investments that are profitable, it can increase its spending without putting its dividend or basic capital spending in jeopardy. Companies that have strong financial flexibility can take advantage of profitable investments even in tough times. In addition, strong financial flexibility frees companies from worry about survival in poor economic times. In fact, those with strong financial flexibility often fare better in a poor economy because they can take advantage of opportunities that other companies cannot.
What do the numbers mean? “THERE OUGHT TO BE A LAW”
As one manager noted, “There ought to be a law that before you can buy a stock, you must be able to read a balance sheet.” We agree, and the same can be said for a statement of cash flows.
Krispy Kreme Doughnuts provides an example of how stunning earnings growth can hide real problems. Not long ago, the doughnut maker was a glamour stock with a 60 percent earnings per share growth rate and a price-earnings ratio around 70. Seven months later, its stock price had dropped 72 percent. What happened? Stockholders alleged that Krispy Kreme may have been inflating its revenues and not taking enough bad debt expense (which inflated both assets and income). In addition, Krispy Kreme's operating cash flow was negative. Most financially sound companies generate positive cash flow.
On the next page are additional examples of how one rating agency rated the earnings quality of some companies, using some key balance sheet and statement of cash flow measurements.
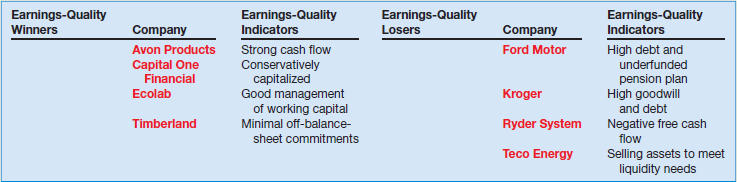
Another rating organization uses a metric to adjust for shortcomings in amounts reported in the balance sheet. Just as improving balance sheet and cash flow information is a leading indicator of improved earnings, a deteriorating balance sheet and statement of cash flows warn of earnings declines (and falling stock prices). This was the case at Avon; its strong cash flow rating subsequently declined, such that its free cash flow was just 76 percent of net income. This raised red flags about the results on foreign investments by Avon.
Sources: Adapted from Gretchen Morgenson, “How Did They Value Stocks? Count the Absurd Ways,” New York Times on the Web (March 18, 2001); K. Badanhausen, J. Gage, C. Hall, and M. Ozanian, “Beyond Balance Sheet: Earnings Quality,” Forbes.com (January 28, 2005); and H. Karp, “Avon's Investments Fall Short,” Wall Street Journal (December 8, 2011).
ADDITIONAL INFORMATION
LEARNING OBJECTIVE ![]()
Determine which balance sheet information requires supplemental disclosure.
In both Chapter 4 and this chapter, we have discussed the primary financial statements that all companies prepare in accordance with GAAP. However, the primary financial statements cannot provide the complete picture related to the financial position and financial performance of the company. Additional descriptive information in supplemental disclosures and certain techniques of disclosure expand on and amplify the items presented in the main body of the statements.
Supplemental Disclosures
The balance sheet is not complete if a company simply lists the assets, liabilities, and owners' equity accounts. It still needs to provide important supplemental information. This may be information not presented elsewhere in the statement, or it may elaborate on items in the balance sheet. The four types of information that are usually supplemental to account titles and amounts presented in the balance sheet are as follows.
SUPPLEMENTAL BALANCE SHEET INFORMATION
- CONTINGENCIES. Material events that have an uncertain outcome.
- ACCOUNTING POLICIES. Explanations of the valuation methods used or the basic assumptions made concerning inventory valuations, depreciation methods, investments in subsidiaries, etc.
- CONTRACTUAL SITUATIONS. Explanations of certain restrictions or covenants attached to specific assets or, more likely, to liabilities.
- FAIR VALUES. Disclosures of fair values, particularly for financial instruments.
Contingencies
The basis for including additional information should meet the full disclosure principle. That is, the information should be of sufficient importance to influence the judgment of an informed user.
A contingency is an existing situation involving uncertainty as to possible gain (gain contingency) or loss (loss contingency) that will ultimately be resolved when one or more future events occur or fail to occur. In short, contingencies are material events with an uncertain future. Examples of gain contingencies are tax operating-loss carryforwards or company litigation against another party. Typical loss contingencies relate to litigation, environmental issues, possible tax assessments, or government investigations. We examine the accounting and reporting requirements involving contingencies more fully in Chapter 13.
Accounting Policies
GAAP recommends disclosure for all significant accounting principles and methods that involve selection from among alternatives or those that are peculiar to a given industry. [6] For instance, companies can compute inventories under several cost flow assumptions (e.g., LIFO and FIFO), depreciate plant and equipment under several accepted methods (e.g., double-declining-balance and straight-line), and carry investments at different valuations (e.g., cost, equity, and fair value). Sophisticated users of financial statements know of these possibilities and examine the statements closely to determine the methods used.
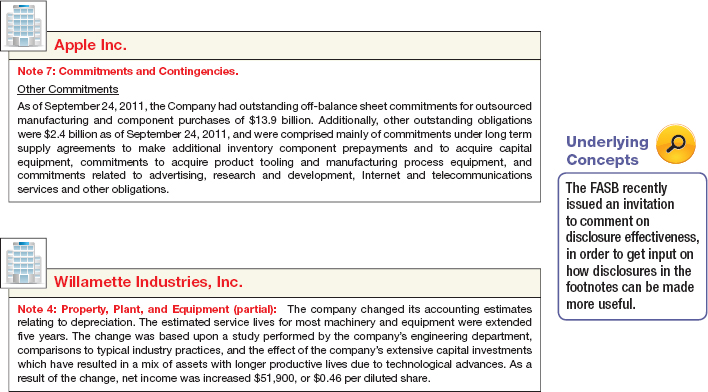
Companies must also disclose information about the nature of their operations, the use of estimates in preparing financial statements, certain significant estimates, and vulnerabilities due to certain concentrations. [7] Illustration 5-29 shows an example of such a disclosure.
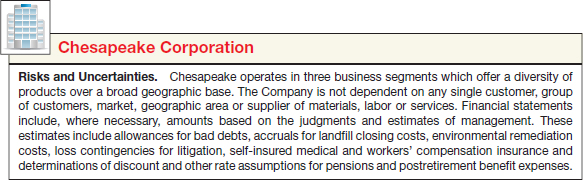
Disclosure of significant accounting principles and methods and of risks and uncertainties is particularly useful if given in a separate Summary of Significant Accounting Policies preceding the notes to the financial statements or as the initial note.
Contractual Situations
Companies should disclose contractual situations, if significant, in the notes to the financial statements. For example, they must clearly state the essential provisions of lease contracts, pension obligations, and stock option plans in the notes. Analysts want to know not only the amount of the liabilities but also how the different contractual provisions affect the company at present and in the future.
Companies must disclose the following commitments if the amounts are material: commitments related to obligations to maintain working capital, to limit the payment of dividends, to restrict the use of assets, and to require the maintenance of certain financial ratios. Management must exercise considerable judgment to determine whether omission of such information is misleading. The rule in this situation is, “When in doubt, disclose.” It is better to disclose a little too much information than not enough.
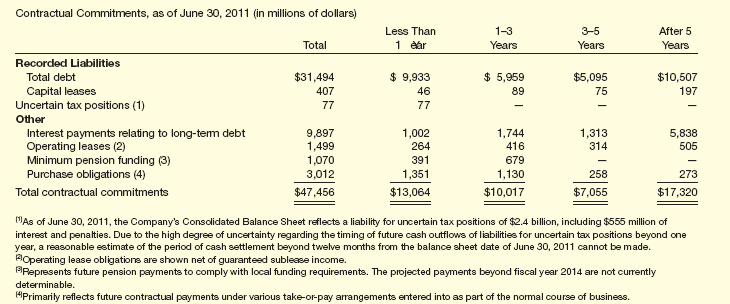
What do the numbers mean? WHAT ABOUT YOUR COMMITMENTS?
Many of the recent accounting scandals related to the nondisclosure of significant contractual obligations. In response, the SEC has mandated that companies disclose contractual obligations in a tabular summary in the management discussion and analysis section of the company's annual report.
Presented below, as an example, is a disclosure from The Procter & Gamble Company.
Fair Values
As we have discussed, fair value information may be more useful than historical cost for certain types of assets and liabilities. This is particularly so in the case of financial instruments. Financial instruments are defined as cash, an ownership interest, or a contractual right to receive or obligation to deliver cash or another financial instrument. Such contractual rights to receive cash or other financial instruments are assets. Contractual obligations to pay are liabilities. Cash, investments, accounts receivable, and payables are examples of financial instruments.
Given the expanded use of fair value measurements, as discussed in Chapter 2, GAAP also has expanded disclosures about fair value measurements. [8] To increase consistency and comparability in the use of fair value measures, companies follow a fair value hierarchy that provides insight into how to determine fair value. The hierarchy has three levels. Level 1 measures (the least subjective) are based on observable inputs, such as market prices for identical assets or liabilities. Level 2 measures (more subjective) are based on market-based inputs other than those included in Level 1, such as those based on market prices for similar assets or liabilities. Level 3 measures (most subjective) are based on unobservable inputs, such as a company's own data or assumptions.11
For major groups of assets and liabilities, companies must make the following fair value disclosures: (1) the fair value measurement and (2) the fair value hierarchy level of the measurements as a whole, classified by Level 1, 2, or 3. Illustration 5-30 provides a disclosure for Devon Energy for its assets and liabilities measured at fair value.
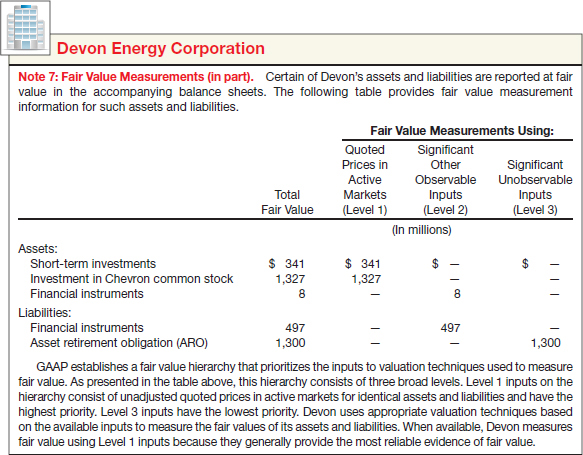
In addition, companies must provide significant additional disclosure related to Level 3 measurements. The disclosures related to Level 3 are substantial and must identify what assumptions the company used to generate the fair value numbers and any related income effects. Companies will want to use Level 1 and 2 measurements as much as possible. In most cases, these valuations should be very reliable, as the fair value measurements are based on market information. In contrast, a company that uses Level 3 measurements extensively must be carefully evaluated to understand the impact these valuations have on the financial statements.
Techniques of Disclosure
LEARNING OBJECTIVE ![]()
Describe the major disclosure techniques for the balance sheet.
Companies should disclose as completely as possible the effect of various contingencies on financial condition, the methods of valuing assets and liabilities, and the company's contracts and agreements. To disclose this pertinent information, companies may use parenthetical explanations, notes, cross-reference and contra items, and supporting schedules.
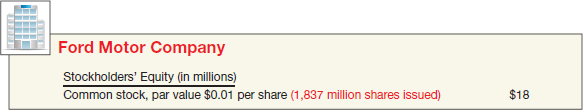
Parenthetical Explanations
Companies often provide additional information by parenthetical explanations following the item. For example, Illustration 5-31 shows a parenthetical explanation of the number of shares issued by Ford Motor Company on the balance sheet under “Stockholders' equity.”
![]() Underlying Concepts
Underlying Concepts
The user-specific quality of understandability requires accountants to be careful in describing transactions and events.
This additional pertinent balance sheet information adds clarity and completeness. It has an advantage over a note because it brings the additional information into the body of the statement where readers will less likely overlook it. Companies, however, should avoid lengthy parenthetical explanations, which might be distracting.
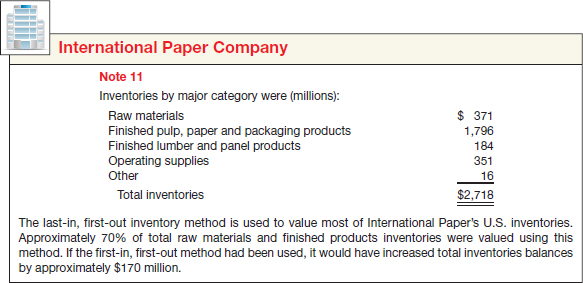
Notes
Companies use notes if they cannot conveniently show additional explanations as parenthetical explanations. Illustration 5-32 shows how International Paper Company reported its inventory costing methods in its accompanying notes.
Companies commonly use notes to disclose the following: the existence and amount of any preferred stock dividends in arrears, the terms of or obligations imposed by purchase commitments, special financial arrangements and instruments, depreciation policies, any changes in the application of accounting principles, and the existence of contingencies.
Notes therefore must present all essential facts as completely and succinctly as possible. Careless wording may mislead rather than aid readers. Notes should add to the total information made available in the financial statements, not raise unanswered questions or contradict other portions of the statements. The note disclosures in Illustration 5-33 show the presentation of such information.
Cross-Reference and Contra Items
Companies “cross-reference” a direct relationship between an asset and a liability on the balance sheet. For example, as shown in Illustration 5-34, on December 31, 2014, a company might show the following entries—one listed among the current assets, and the other listed among the current liabilities.
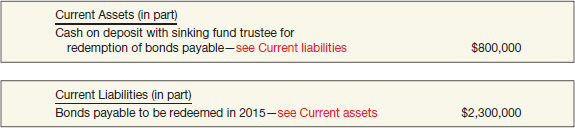
This cross-reference points out that the company will redeem $2,300,000 of bonds payable currently, for which it has only set aside $800,000. Therefore, it needs additional cash from unrestricted cash, from sales of investments, from profits, or from some other source. Alternatively, the company can show the same information parenthetically.
Another common procedure is to establish contra or adjunct accounts. A contra account on a balance sheet reduces either an asset, liability, or owners' equity account. Examples include Accumulated Depreciation and Discount on Bonds Payable. Contra accounts provide some flexibility in presenting the financial information. With the use of the Accumulated Depreciation account, for example, a reader of the statement can see the original cost of the asset as well as the depreciation to date.
An adjunct account, on the other hand, increases either an asset, liability, or owners' equity account. An example is Premium on Bonds Payable, which, when added to the Bonds Payable account, describes the total bond liability of the company.
Supporting Schedules
Often a company needs a separate schedule to present more detailed information about certain assets or liabilities, as shown in Illustration 5-35.

![]() International Perspective
International Perspective
Internationally, accounting terminology is a problem. Confusion arises even between nations that share a language. For example, U.S. investors normally think of “stock” as “equity” or “ownership.” To the British, “stocks” means inventory. In the United States, “fixed assets” generally refers to “property, plant, and equipment.” In Britain, the category includes more items.
Terminology
The account titles in the general ledger do not necessarily represent the best terminology for balance sheet purposes. Companies often use brief account titles and include technical terms that only accountants understand. But many persons unacquainted with accounting terminology examine balance sheets. Thus, balance sheets should contain descriptions that readers will generally understand and clearly interpret.
For example, companies have used the term “reserve” in differing ways: to describe amounts deducted from assets (contra accounts such as accumulated depreciation and allowance for doubtful accounts), as a part of the title of contingent or estimated liabilities, and to describe an appropriation of retained earnings. Because of the different meanings attached to this term, misinterpretation often resulted from its use. Therefore, the profession has recommended that companies use the word reserve only to describe an appropriation of retained earnings. The use of the term in this narrower sense—to describe appropriated retained earnings—has resulted in a better understanding of its significance when it appears in a balance sheet. However, the term “appropriated” appears more logical, and we encourage its use.
![]() You will want to read the IFRS INSIGHTS on pages 277–284 for discussion of IFRS related to the balance sheet and statement of cash flows.
You will want to read the IFRS INSIGHTS on pages 277–284 for discussion of IFRS related to the balance sheet and statement of cash flows.
For years, the profession has recommended that the use of the word surplus be discontinued in balance sheet presentations of stockholders' equity. The use of the terms capital surplus, paid-in surplus, and earned surplus is confusing. Although condemned by the profession, these terms appear all too frequently in current financial statements.
 Evolving Issue BALANCE SHEET REPORTING: GROSS OR NET?
In addition to the issue of financial statement presentation discussed in the opening story, a second area of controversy for balance sheet reporting is the issue of offsetting (or netting) of assets and liabilities. It is generally accepted that offsetting of recognized assets and recognized liabilities detracts from the ability of users both to understand the transactions and conditions that have occurred and to assess the company's future cash flows. In other words, providing information on assets, liabilities, and stockholders' equity helps users to compute rates of return and evaluate capital structure. However, netting assets and liabilities limits a user's ability to assess the future economic benefits and obligations. That is, offsetting hides the existence of assets and liabilities, making it difficult to evaluate liquidity, solvency, and financial flexibility. As a result, GAAP does not permit the reporting of summary accounts alone (e.g., total assets, net assets, and total liabilities).
Recently, the IASB and FASB have worked to develop common criteria for offsetting on the balance sheet. Current offsetting rules under IFRS are more restrictive than GAAP. The rules proposed would allow offsetting only in rare circumstances (e.g., when right of offset is legally enforceable). Implementation of these new rules in the United States would result in a dramatic “grossing up” of balance sheets (particularly for financial institutions). For example, one study estimated that the new rules would gross up U.S. banks' balance sheets by $900 billion (or an average of 68%, ranging from a 31.4% increase for Citigroup to 104.7% for Morgan Stanley).* Not surprisingly, the FASB received significant push-back from some of its constituents (particularly financial institutions) to the proposed rules.
As a result, to date the Boards have not been able to agree on a converged standard, thereby stalling this project. However, the Boards have issued converged disclosure requirements. The disclosure rules require companies to disclose both gross information and net information about instruments and transactions that are eligible for offset in the balance sheet. While the Boards have not been able to develop a converged set of criteria for offsetting, the information provided under the new converged disclosure rules should enable users of a company's financial statements to evaluate the effects of netting arrangements on its financial position. In doing so, the new rules support the full disclosure principle.
*See Y. N'Diaye, “S&P: Accounting Rule Could Boost Bank Balance Sheets by Average 68%,” https://mninews.deutsche-boerse.com (September 22, 2011).
KEY TERMS
account form, 226
adjunct account, 242
available-for-sale investments, 218
balance sheet, 214
cash debt coverage, 234
contingency, 237
contra account, 241
current assets, 217
current cash debt coverage, 234
current liabilities, 222
financial flexibility, 214
financial instruments, 238
financing activities, 229
free cash flow, 234
held-to-maturity investments, 218
intangible assets, 222
investing activities, 229
liquidity, 214
long-term investments, 221
long-term liabilities, 224
operating activities, 229
owners' (stockholders') equity, 225
property, plant, and equipment, 221
report form, 226
reserve, 242
solvency, 214
statement of cash flows, 228
trading investments, 218
working capital, 223
SUMMARY OF LEARNING OBJECTIVES
![]() Explain the uses and limitations of a balance sheet. The balance sheet provides information about the nature and amounts of investments in a company's resources, obligations to creditors, and owners' equity. The balance sheet contributes to financial reporting by providing a basis for (1) computing rates of return, (2) evaluating the capital structure of the enterprise, and (3) assessing the liquidity, solvency, and financial flexibility of the enterprise.
Explain the uses and limitations of a balance sheet. The balance sheet provides information about the nature and amounts of investments in a company's resources, obligations to creditors, and owners' equity. The balance sheet contributes to financial reporting by providing a basis for (1) computing rates of return, (2) evaluating the capital structure of the enterprise, and (3) assessing the liquidity, solvency, and financial flexibility of the enterprise.
Three limitations of a balance sheet are as follows. (1) The balance sheet does not reflect fair value because accountants use a historical cost basis in valuing and reporting most assets and liabilities. (2) Companies must use judgments and estimates to determine certain amounts, such as the collectibility of receivables and the useful life of long-term tangible and intangible assets. (3) The balance sheet omits many items that are of financial value to the business but cannot be recorded objectively, such as human resources, customer base, and reputation.
![]() Identify the major classifications of the balance sheet. The general elements of the balance sheet are assets, liabilities, and equity. The major classifications of assets are current assets; long-term investments; property, plant, and equipment; intangible assets; and other assets. The major classifications of liabilities are current and long-term liabilities. The balance sheet of a corporation generally classifies owners' equity as capital stock, additional paid-in capital, and retained earnings.
Identify the major classifications of the balance sheet. The general elements of the balance sheet are assets, liabilities, and equity. The major classifications of assets are current assets; long-term investments; property, plant, and equipment; intangible assets; and other assets. The major classifications of liabilities are current and long-term liabilities. The balance sheet of a corporation generally classifies owners' equity as capital stock, additional paid-in capital, and retained earnings.
![]() Prepare a classified balance sheet using the report and account formats. The report form lists liabilities and stockholders' equity directly below assets on the same page. The account form lists assets, by sections, on the left side, and liabilities and stockholders' equity, by sections, on the right side.
Prepare a classified balance sheet using the report and account formats. The report form lists liabilities and stockholders' equity directly below assets on the same page. The account form lists assets, by sections, on the left side, and liabilities and stockholders' equity, by sections, on the right side.
![]() Indicate the purpose of the statement of cash flows. The primary purpose of a statement of cash flows is to provide relevant information about a company's cash receipts and cash payments during a period. Reporting the sources, uses, and net change in cash enables financial statement readers to know what is happening to a company's most liquid resource.
Indicate the purpose of the statement of cash flows. The primary purpose of a statement of cash flows is to provide relevant information about a company's cash receipts and cash payments during a period. Reporting the sources, uses, and net change in cash enables financial statement readers to know what is happening to a company's most liquid resource.
![]() Identify the content of the statement of cash flows. In the statement of cash flows, companies classify the period's cash receipts and cash payments into three different activities. (1) Operating activities: Involve the cash effects of transactions that enter into the determination of net income. (2) Investing activities: Include making and collecting loans, and acquiring and disposing of investments (both debt and equity) and of property, plant, and equipment. (3) Financing activities: Involve liability and owners' equity items. Financing activities include (a) obtaining capital from owners and providing them with a return on their investment, and (b) borrowing money from creditors and repaying the amounts borrowed.
Identify the content of the statement of cash flows. In the statement of cash flows, companies classify the period's cash receipts and cash payments into three different activities. (1) Operating activities: Involve the cash effects of transactions that enter into the determination of net income. (2) Investing activities: Include making and collecting loans, and acquiring and disposing of investments (both debt and equity) and of property, plant, and equipment. (3) Financing activities: Involve liability and owners' equity items. Financing activities include (a) obtaining capital from owners and providing them with a return on their investment, and (b) borrowing money from creditors and repaying the amounts borrowed.
![]() Prepare a basic statement of cash flows. The information to prepare the statement of cash flows usually comes from comparative balance sheets, the current income statement, and selected transaction data. Companies follow four steps to prepare the statement of cash flows from these sources. (1) Determine the net cash provided by (or used in) operating activities. (2) Determine the net cash provided by (or used in) investing and financing activities. (3) Determine the change (increase or decrease) in cash during the period. (4) Reconcile the change in cash with the beginning and ending cash balances.
Prepare a basic statement of cash flows. The information to prepare the statement of cash flows usually comes from comparative balance sheets, the current income statement, and selected transaction data. Companies follow four steps to prepare the statement of cash flows from these sources. (1) Determine the net cash provided by (or used in) operating activities. (2) Determine the net cash provided by (or used in) investing and financing activities. (3) Determine the change (increase or decrease) in cash during the period. (4) Reconcile the change in cash with the beginning and ending cash balances.
![]() Understand the usefulness of the statement of cash flows. Creditors examine the statement of cash flows carefully because they are concerned about being paid. The net cash flow provided by operating activities in relation to the company's liabilities is helpful in making this assessment. Two ratios used in this regard are the current cash debt ratio and the cash debt ratio. In addition, the amount of free cash flow provides creditors and stockholders with a picture of the company's financial flexibility.
Understand the usefulness of the statement of cash flows. Creditors examine the statement of cash flows carefully because they are concerned about being paid. The net cash flow provided by operating activities in relation to the company's liabilities is helpful in making this assessment. Two ratios used in this regard are the current cash debt ratio and the cash debt ratio. In addition, the amount of free cash flow provides creditors and stockholders with a picture of the company's financial flexibility.
![]() Determine which balance sheet information requires supplemental disclosure. Four types of information normally are supplemental to account titles and amounts presented in the balance sheet. (1) Contingencies: Material events that have an uncertain outcome. (2) Accounting policies: Explanations of the valuation methods used or the basic assumptions made concerning inventory valuation, depreciation methods, investments in subsidiaries, etc. (3) Contractual situations: Explanations of certain restrictions or covenants attached to specific assets or, more likely, to liabilities. (4) Fair values: Disclosures related to fair values, particularly related to financial instruments.
Determine which balance sheet information requires supplemental disclosure. Four types of information normally are supplemental to account titles and amounts presented in the balance sheet. (1) Contingencies: Material events that have an uncertain outcome. (2) Accounting policies: Explanations of the valuation methods used or the basic assumptions made concerning inventory valuation, depreciation methods, investments in subsidiaries, etc. (3) Contractual situations: Explanations of certain restrictions or covenants attached to specific assets or, more likely, to liabilities. (4) Fair values: Disclosures related to fair values, particularly related to financial instruments.
![]() Describe the major disclosure techniques for the balance sheet. Companies use four methods to disclose pertinent information in the balance sheet. (1) Parenthetical explanations: Parenthetical information provides additional information or description following the item. (2) Notes: A company uses notes if it cannot conveniently show additional explanations or descriptions as parenthetical explanations. (3) Cross-reference and contra items: Companies “cross-reference” a direct relationship between an asset and a liability on the balance sheet. (4) Supporting schedules: Often a company uses a separate schedule to present more detailed information than just the single summary item shown in the balance sheet.
Describe the major disclosure techniques for the balance sheet. Companies use four methods to disclose pertinent information in the balance sheet. (1) Parenthetical explanations: Parenthetical information provides additional information or description following the item. (2) Notes: A company uses notes if it cannot conveniently show additional explanations or descriptions as parenthetical explanations. (3) Cross-reference and contra items: Companies “cross-reference” a direct relationship between an asset and a liability on the balance sheet. (4) Supporting schedules: Often a company uses a separate schedule to present more detailed information than just the single summary item shown in the balance sheet.
APPENDIX 5A RATIO ANALYSIS—A REFERENCE
USING RATIOS TO ANALYZE PERFORMANCE
LEARNING OBJECTIVE ![]()
Identify the major types of financial ratios and what they measure.
Analysts and other interested parties can gather qualitative information from financial statements by examining relationships between items on the statements and identifying trends in these relationships. A useful starting point in developing this information is ratio analysis.
A ratio expresses the mathematical relationship between one quantity and another. Ratio analysis expresses the relationship among pieces of selected financial statement data, in a percentage, a rate, or a simple proportion.
To illustrate, IBM Corporation recently had current assets of $46,970 million and current liabilities of $39,798 million. We find the ratio between these two amounts by dividing current assets by current liabilities. The alternative means of expression are:
| Percentage: | Current assets are 118% of current liabilities. |
| Rate: | Current assets are 1.18 times as great as current liabilities. |
| Proportion: | The relationship of current assets to current liabilities is 1.18:1. |
To analyze financial statements, we classify ratios into four types, as follows.
MAJOR TYPES OF RATIOS
LIQUIDITY RATIOS. Measures of the company's short-term ability to pay its maturing obligations.
ACTIVITY RATIOS. Measures of how effectively the company uses its assets.
PROFITABILITY RATIOS. Measures of the degree of success or failure of a given company or division for a given period of time.
COVERAGE RATIOS. Measures of the degree of protection for long-term creditors and investors.
In Chapter 5, we discussed three measures related to the statement of cash flows (current cash debt coverage, cash debt coverage, and free cash flow). Throughout the remainder of the textbook, we provide ratios to help you understand and interpret the information presented in financial statements. Illustration 5A-1 presents the ratios that we will use throughout the textbook. You should find this chart helpful as you examine these ratios in more detail in the following chapters. An appendix to Chapter 24 further discusses financial statement analysis.
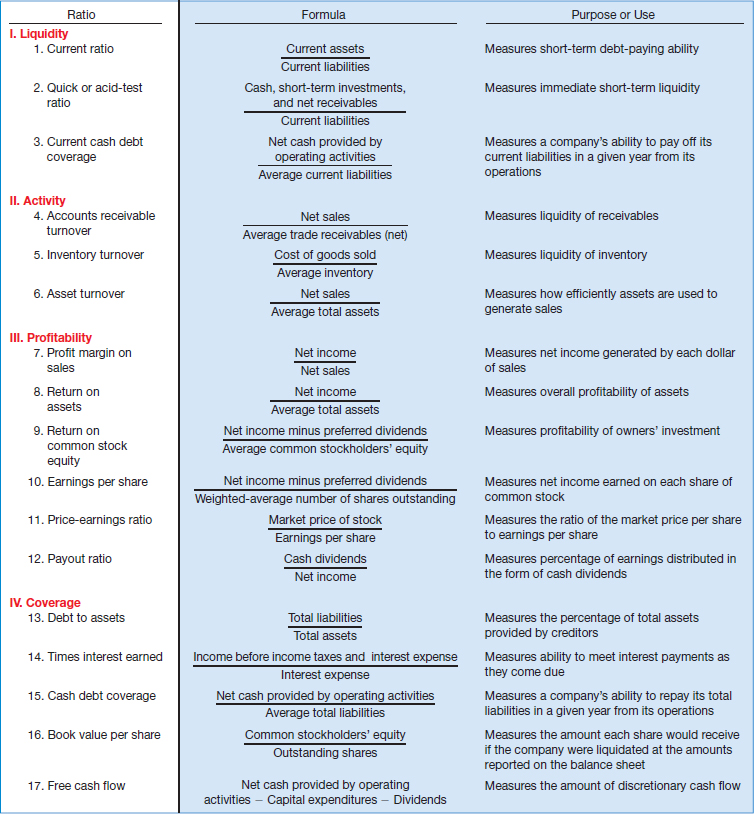
KEY TERMS
coverage ratios, 245
liquidity ratios, 245
profitability ratios, 245
ratio analysis, 245
SUMMARY OF LEARNING OBJECTIVE FOR APPENDIX 5A
![]() Identify the major types of financial ratios and what they measure. Ratios express the mathematical relationship between one quantity and another, expressed as a percentage, a rate, or a proportion. Liquidity ratios measure the short-term ability to pay maturing obligations. Activity ratios measure the effectiveness of asset usage. Profitability ratios measure the success or failure of an enterprise. Coverage ratios measure the degree of protection for long-term creditors and investors.
Identify the major types of financial ratios and what they measure. Ratios express the mathematical relationship between one quantity and another, expressed as a percentage, a rate, or a proportion. Liquidity ratios measure the short-term ability to pay maturing obligations. Activity ratios measure the effectiveness of asset usage. Profitability ratios measure the success or failure of an enterprise. Coverage ratios measure the degree of protection for long-term creditors and investors.
APPENDIX 5B SPECIMEN FINANCIAL STATEMENTS: THE PROCTER & GAMBLE COMPANY
![]()
The Procter & Gamble Company (P&G) manufactures and markets a range of consumer products in various countries throughout the world. The company markets over 300 branded products in more than 160 countries. It manages its business in six product segments: Fabric and Home Care, Baby and Family Care, Beauty Care, Health Care, Snacks, and Pet Care and Grooming.
The content and organization of corporate annual reports have become fairly standardized. Excluding the public relations part of the report (pictures, products, etc.), the following are the traditional financial portions of the annual report:
- Letter to the Stockholders
- Financial Highlights
- Management's Discussion and Analysis
- Management Certification of Financial Statements
- Management's Report on Internal Control
- Auditor's Reports
- Financial Statements
- Notes to the Financial Statements
- Supplementary Financial Information (e.g., 10-year financial summary)
The following pages contain excerpts from the president's letter and the financial statements from P&G's 2011 annual report. The complete P&G annual report can be accessed at the book's companion website, www.wiley.com/college/kieso. You will see examples of the standard annual report elements by examining the P&G annual report.
We do not expect that you will comprehend P&G's financial statements and the accompanying notes in their entirety at your first reading. But we expect that by the time you complete the material in this textbook, your level of understanding and interpretive ability will have grown enormously.
At this point, we recommend that you go online and take 20 to 30 minutes to scan the annual report, especially the financial statements and notes. Your goal should be to familiarize yourself with the contents and accounting elements. Throughout the following 19 chapters, when you are asked to refer to specific parts of P&G's financial statements, do so! Then, when you have completed reading this textbook, we challenge you to reread P&G's financials to see how much greater and more sophisticated your understanding of them has become.
Letter to Shareholders
Last year, I described P&G's Purpose-inspired Growth Strategy, which is to touch and improve more consumers' lives in more parts of the world more completely. I told you that we intend to deliver total shareholder return that consistently ranks P&G among the top third of our peers—the best performing consumer products companies in the world. To do this, we must deliver the Company's long-term annual growth goals, which are to:
- Grow organic sales 1% to 2% faster than market growth in the categories and countries where we compete.
- Deliver core earnings per share (core EPS) growth of high single to low double digits.
- Generate free cash flow productivity of 90% or greater.
We made meaningful progress toward these long-term goals for fiscal 2011, despite significant external challenges.
- Organic sales grew 4%. Organic volume grew 5%.
- Core earnings per share grew 8%.
- Free cash flow productivity was 84% of net earnings.
We increased our quarterly dividend by 9%, making this the 121st consecutive year that P&G has paid a dividend and the 55th consecutive year that the dividend has increased.
Over the past 55 years, P&G's dividend has increased at an annual compound average rate of approximately 9.5%. In total, we paid approximately $5.8 billion in dividends in fiscal 2011. We also returned $7.0 billion to shareholders through the repurchase of P&G stock. Based on our current market capitalization, dividends and share repurchase, we provided shareholders with an effective cash yield of nearly 7%, with additional potential for capital appreciation.
This is good performance in a very demanding business and economic environment. It is not yet great performance. I am confident, however, that we will continue to grow our business on the strength of our Purpose-inspired Growth Strategy:
- We are executing the strategy as planned, with unrelenting focus on innovation.
- We are increasing productivity, which frees up resources to invest in innovation.
- We continue to strengthen our portfolio of businesses.
- We are tackling growth challenges head on.
- We have solid, executable plans in place to capture the enormous growth potential that our strategy creates.
Further, P&G people are inspired and are performing heroically to improve lives, to grow our business, and to create value for our shareholders.
Robert A. McDonald
Chairman of the Board, President and
Chief Executive Officer
Financials
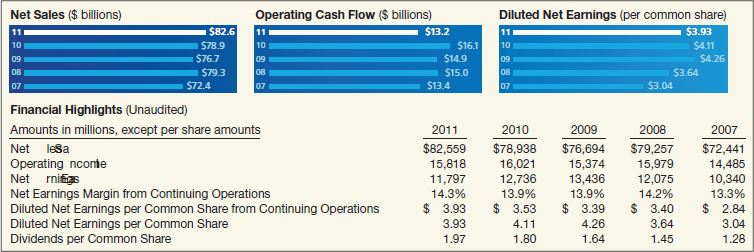
Consolidated Statements of Earnings
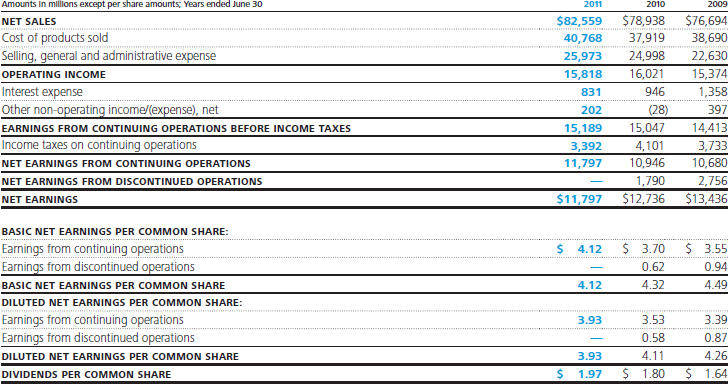
Consolidated Balance Sheets
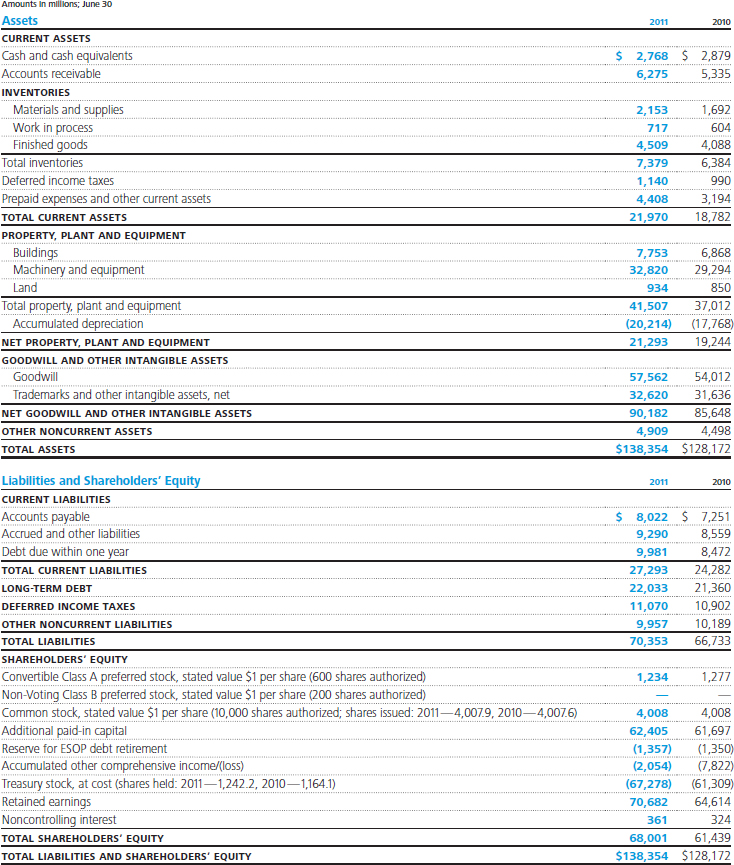
Consolidated Statements of Shareholders' Equity

Consolidated Statements of Cash Flows

DEMONSTRATION PROBLEMS
Demonstration Problem 1: Assume that Sanchez Company has the following accounts at the end of the current year.
- Common Stock.
- Discount on Bonds Payable.
- Treasury Stock (at cost).
- Notes Payable (short-term).
- Raw Materials.
- Preferred Stock Investments (long-term).
- Unearned Rent Revenue.
- Work in Process.
- Copyrights.
- Buildings.
- Notes Receivable (short-term).
- Cash.
- Salaries and Wages Payable.
- Accumulated Depreciation—Buildings.
- Accumulated Other Comprehensive Income.
- Cash Restricted for Plant Expansion.
- Land Held for Future Plant Site.
- Noncontrolling Interest.
- Allowance for Doubtful Accounts—Accounts Receivable.
- Retained Earnings.
- Paid-in Capital in Excess of Par—Common Stock.
- Unearned Subscriptions Revenue.
- Receivables—Officers (due in one year).
- Finished Goods.
- Accounts Receivable.
- Bonds Payable (due in 4 years).
Instructions
Prepare a classified balance sheet in good form. (No monetary amounts are necessary.)
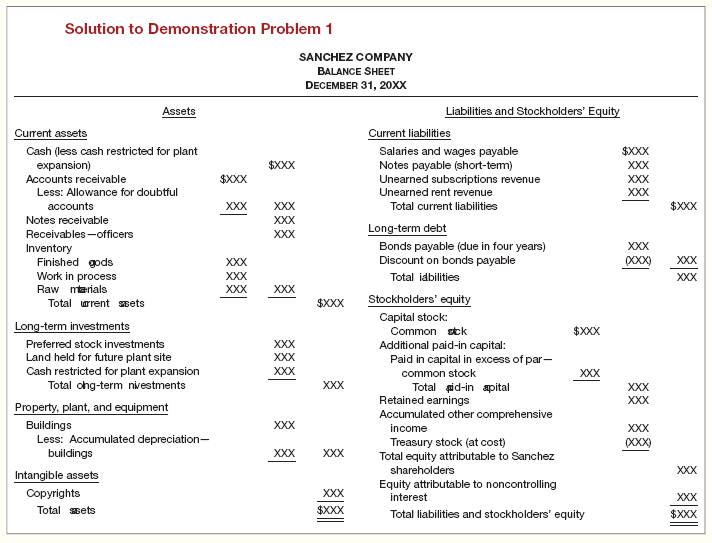
Demonstration Problem 2: Cassy Corporation's balance sheet at the end of 2013 included the following items.
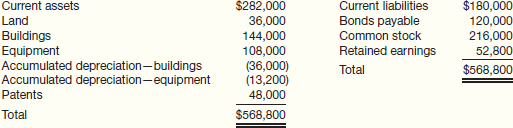
The following information is available for 2014.
- Treasury stock was purchased at a cost of $13,200.
- Cash dividends of $36,000 were declared and paid.
- A long-term investment in stock was purchased for $19,200.
- Current assets other than cash increased by $34,800. Current liabilities increased by $15,600.
- Depreciation expense was $4,800 on the building and $10,800 on equipment.
- Net income was $66,000.
- Bonds payable of $60,000 were issued.
- An addition to the building was completed at a cost of $32,400.
- Patent amortization was $3,000.
- Equipment (cost $24,000 and accumulated depreciation $9,600) was sold for $12,000.
Instructions
(a) Prepare a balance sheet at December 31, 2014.
(b) Prepare a statement of cash flows for 2014.
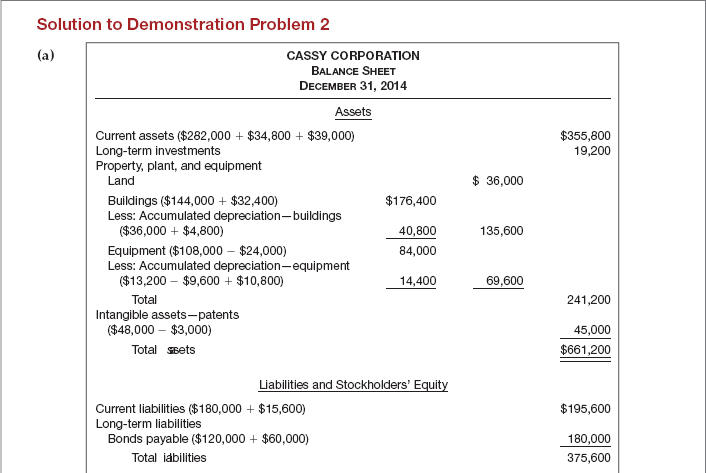
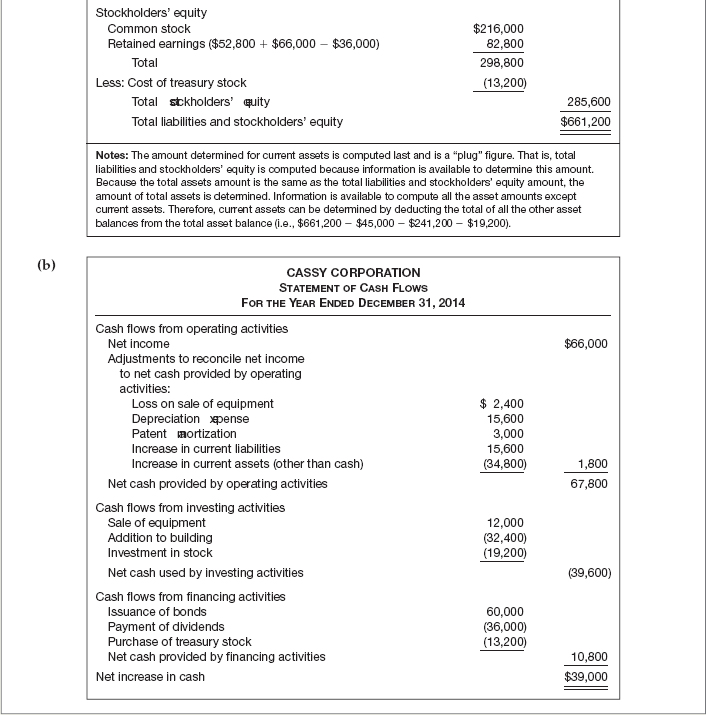
 FASB CODIFICATION
FASB Codification References
[1] FASB ASC 320-10-35-1. [Predecessor literature: “Accounting for Certain Investments in Debt and Equity Securities,” Statement of Financial Accounting Standards No. 115 (Norwalk, Conn.: FASB, 1993).]
[2] FASB ASC 825-10-25-1. [Predecessor literature: “The Fair Value Option for Financial Assets and Liabilities, Including an Amendment of FASB Statement No. 115,” Statement of Financial Accounting Standards No. 159 (Norwalk, Conn.: FASB, February 2007).]
[3] FASB ASC 470-10-05-6. [Predecessor literature: “Classification of Short-term Obligations Expected to Be Refinanced,” Statement of Financial Accounting Standards No. 6 (Stamford, Conn.: FASB, 1975).]
[4] FASB ASC 505-10-50. [Predecessor literature: “Disclosure of Information about Capital Structure,” Statement of Financial Accounting Standards No. 129 (Norwalk: FASB, 1997), par. 4).]
[5] FASB ASC 230-10-05. [Predecessor literature: “Statement of Cash Flows,” Statement of Financial Accounting Standards No. 95 (Stamford, Conn.: FASB, 1987).]
[6] FASB ASC 235-10-05. [Predecessor literature: “Disclosure of Accounting Policies,” Opinions of the Accounting Principles Board No. 22 (New York: AICPA, 1972).]
[7] FASB ASC 275-10-05. [Predecessor literature: “Disclosure of Certain Significant Risks and Uncertainties,” Statement of Position 94-6 (New York: AICPA, 1994).]
[8] FASB ASC 820-10-15. [Predecessor literature: “Fair Value Measurement,” Statement of Financial Accounting Standards No. 157 (Norwalk, Conn.: FASB, September 2006).]
Exercises
If your school has a subscription to the FASB Codification, go to http://aaahq.org/asclogin.cfm to log in and prepare responses to the following. Provide Codification references for your responses.
| CE5-1 | Access the Codification glossary (“Master Glossary”) to answer the following.
(a) What is the definition provided for current assets? (b) What is the definition of an intangible asset? In what section of the Codification are intangible assets addressed? (c) What are cash equivalents? (d) What are financing activities? |
| CE5-2 | What guidance does the Codification provide on the classification of current liabilities? |
| CE5-3 | What guidance does the Codification provide concerning the format of accounting disclosures? |
| CE5-4 | What are the objectives related to the statement of cash flows? |
An additional Codification case can be found in the Using Your Judgment section, on page 277.
Be sure to check the book's companion website for a Review and Analysis Exercise, with solution.
![]() Brief Exercises, Exercises, Problems, and many more learning and assessment tools and resources are available for practice in WileyPLUS.
Brief Exercises, Exercises, Problems, and many more learning and assessment tools and resources are available for practice in WileyPLUS.
QUESTIONS
- How does information from the balance sheet help users of the financial statements?
- What is meant by solvency? What information in the balance sheet can be used to assess a company's solvency?
- A recent financial magazine indicated that the airline industry has poor financial flexibility. What is meant by financial flexibility, and why is it important?
- Discuss at least two situations in which estimates could affect the usefulness of information in the balance sheet.
- Perez Company reported an increase in inventories in the past year. Discuss the effect of this change on the current ratio (current assets ÷ current liabilities). What does this tell a statement user about Perez Company's liquidity?
- What is meant by liquidity? Rank the following assets from one to five in order of liquidity.
(a) Goodwill.
(b) Inventory.
(c) Buildings.
(d) Short-term investments.
(e) Accounts receivable.
- What are the major limitations of the balance sheet as a source of information?
- Discuss at least two items that are important to the value of companies like Intel or IBM but that are not recorded in their balance sheets. What are some reasons why these items are not recorded in the balance sheet?
- How does separating current assets from property, plant, and equipment in the balance sheet help analysts?
- In its December 31, 2014, balance sheet Oakley Corporation reported as an asset, “Net notes and accounts receivable, $7,100,000.” What other disclosures are necessary?
- Should available-for-sale securities always be reported as a current asset? Explain.
- What is the relationship between current assets and current liabilities?
- The New York Knicks, Inc. sold 10,000 season tickets at $2,000 each. By December 31, 2014, 16 of the 40 home games had been played. What amount should be reported as a current liability at December 31, 2014?
- What is working capital? How does working capital relate to the operating cycle?
- In what section of the balance sheet should the following items appear, and what balance sheet terminology would you use?
(a) Treasury stock (recorded at cost).
(b) Checking account at bank.
(c) Land (held as an investment).
(d) Sinking fund.
(e) Unamortized premium on bonds payable.
(f) Copyrights.
(g) Pension fund assets.
(h) Premium on capital stock.
(i) Long-term investments (pledged against bank loans payable).
- Where should the following items be shown on the balance sheet, if shown at all?
(a) Allowance for doubtful accounts.
(b) Merchandise held on consignment.
(c) Advances received on sales contract.
(d) Cash surrender value of life insurance.
(e) Land.
(f) Merchandise out on consignment.
(g) Franchises.
(h) Accumulated depreciation of equipment.
(i) Materials in transit—purchased f.o.b. destination.
- State the generally accepted accounting principle applicable to balance sheet valuation of each of the following assets.
(a) Trade accounts receivable.
(b) Land.
(c) Inventories.
(d) Trading securities (common stock of other companies).
(e) Prepaid expenses.
- Refer to the definition of assets on page 216. Discuss how a leased building might qualify as an asset of the lessee (tenant) under this definition.
- Kathleen Battle says, “Retained earnings should be reported as an asset, since it is earnings which are reinvested in the business.” How would you respond to Battle?
- The creditors of Chester Company agree to accept promissory notes for the amount of its indebtedness with a proviso that two-thirds of the annual profits must be applied to their liquidation. How should these notes be reported on the balance sheet of the issuing company? Give a reason for your answer.
- What is the purpose of a statement of cash flows? How does it differ from a balance sheet and an income statement?
- The net income for the year for Genesis, Inc. is $750,000, but the statement of cash flows reports that the net cash provided by operating activities is $640,000. What might account for the difference?
- Net income for the year for Carrie, Inc. was $750,000, but the statement of cash flows reports that net cash provided by operating activities was $860,000. What might account for the difference?
- Differentiate between operating activities, investing activities, and financing activities.
- Each of the following items must be considered in preparing a statement of cash flows. Indicate where each item is to be reported in the statement, if at all. Assume that net income is reported as $90,000.
(a) Accounts receivable increased from $34,000 to $39,000 from the beginning to the end of the year.
(b) During the year, 10,000 shares of preferred stock with a par value of $100 per share were issued at $115 per share.
(c) Depreciation expense amounted to $14,000, and bond premium amortization amounted to $5,000.
(d) Land increased from $10,000 to $30,000.
- Sergey Co. has net cash provided by operating activities of $1,200,000. Its average current liabilities for the period are $1,000,000, and its average total liabilities are $1,500,000. Comment on the company's liquidity and financial flexibility, given this information.
- Net income for the year for Tanizaki, Inc. was $750,000, but the statement of cash flows reports that net cash provided by operating activities was $860,000. Tanizaki also reported capital expenditures of $75,000 and paid dividends in the amount of $30,000. Compute Tanizaki's free cash flow.
- What is the purpose of a free cash flow analysis?
- What are some of the techniques of disclosure for the balance sheet?
- What is a “Summary of Significant Accounting Policies”?
- What types of contractual obligations must be disclosed in great detail in the notes to the balance sheet? Why do you think these detailed provisions should be disclosed?
- What is the profession's recommendation in regard to the use of the term “surplus”? Explain.
BRIEF EXERCISES
BE5-1 Harding Corporation has the following accounts included in its December 31, 2014, trial balance: Accounts Receivable $110,000; Inventory $290,000; Allowance for Doubtful Accounts $8,000; Patents $72,000; Prepaid Insurance $9,500; Accounts Payable $77,000; Cash $30,000. Prepare the current assets section of the balance sheet, listing the accounts in proper sequence.
![]()
BE5-2 Koch Corporation's adjusted trial balance contained the following asset accounts at December 31, 2014: Cash $7,000; Land $40,000; Patents $12,500; Accounts Receivable $90,000; Prepaid Insurance $5,200; Inventory $30,000; Allowance for Doubtful Accounts $4,000; Equity Investments (trading) $11,000. Prepare the current assets section of the balance sheet, listing the accounts in proper sequence.
![]()
BE5-3 Included in Outkast Company's December 31, 2014, trial balance are the following accounts: Prepaid Rent $5,200; Debt Investments (trading) $56,000; Unearned Fees $17,000; Land (held for investment) $39,000; Notes Receivable (long-term) $42,000. Prepare the long-term investments section of the balance sheet.
![]()
BE5-4 Lowell Company's December 31, 2014, trial balance includes the following accounts: Inventory $120,000; Buildings $207,000; Accumulated Depreciation—Equipment $19,000; Equipment $190,000; Land (held for investment) $46,000; Accumulated Depreciation—Buildings $45,000; Land $71,000; Timberland $70,000. Prepare the property, plant, and equipment section of the balance sheet.
![]()
BE5-5 Crane Corporation has the following accounts included in its December 31, 2014, trial balance: Equity Investments (trading) $21,000; Goodwill $150,000; Prepaid Insurance $12,000; Patents $220,000; Franchises $130,000. Prepare the intangible assets section of the balance sheet.
![]()
BE5-6 Patrick Corporation's adjusted trial balance contained the following asset accounts at December 31, 2014: Prepaid Rent $12,000; Goodwill $50,000; Franchise Fees Receivable $2,000; Franchises $47,000; Patents $33,000; Trademarks $10,000. Prepare the intangible assets section of the balance sheet.
![]()
BE5-7 Thomas Corporation's adjusted trial balance contained the following liability accounts at December 31, 2014: Bonds Payable (due in 3 years) $100,000; Accounts Payable $72,000; Notes Payable (due in 90 days) $22,500; Salaries and Wages Payable $4,000; Income Taxes Payable $7,000. Prepare the current liabilities section of the balance sheet.
![]()
BE5-8 Included in Adams Company's December 31, 2014, trial balance are the following accounts: Accounts Payable $220,000; Pension Liability $375,000; Discount on Bonds Payable $29,000; Unearned Rent Revenue $41,000; Bonds Payable $400,000; Salaries and Wages Payable $27,000; Interest Payable $12,000; Income Taxes Payable $29,000. Prepare the current liabilities section of the balance sheet.
![]()
BE5-9 Use the information presented in BE5-8 for Adams Company to prepare the long-term liabilities section of the balance sheet.
![]()
BE5-10 Hawthorn Corporation's adjusted trial balance contained the following accounts at December 31, 2014: Retained Earnings $120,000; Common Stock $750,000; Bonds Payable $100,000; Paid-in Capital in Excess of Par—Common Stock $200,000; Goodwill $55,000; Accumulated Other Comprehensive Loss $150,000; Noncontrolling Interest $35,000. Prepare the stockholders' equity section of the balance sheet.
![]()
BE5-11 Stowe Company's December 31, 2014, trial balance includes the following accounts: Investment in Common Stock $70,000; Retained Earnings $114,000; Trademarks $31,000; Preferred Stock $152,000; Common Stock $55,000; Deferred Income Taxes $88,000; Paid-in Capital in Excess of Par—Common Stock $174,000; Noncontrolling Interest $63,000. Prepare the stockholders' equity section of the balance sheet.
![]()
BE5-12 Keyser Beverage Company reported the following items in the most recent year.
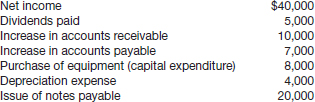
Compute net cash provided by operating activities, the net change in cash during the year, and free cash flow.
![]()
BE5-13 Ames Company reported 2014 net income of $151,000. During 2014, accounts receivable increased by $13,000 and accounts payable increased by $9,500. Depreciation expense was $44,000. Prepare the cash flows from operating activities section of the statement of cash flows.
![]()
BE5-14 Martinez Corporation engaged in the following cash transactions during 2014.
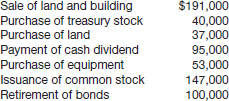
Compute the net cash provided (used) by investing activities.
![]()
BE5-15 Use the information presented in BE5-14 for Martinez Corporation to compute the net cash used (provided) by financing activities.
![]()
BE5-16 Using the information in BE5-14, determine Martinez's free cash flow, assuming that it reported net cash provided by operating activities of $400,000.
EXERCISES
![]()
![]()
E5-1 (Balance Sheet Classifications) Presented below are a number of balance sheet accounts of Deep Blue Something, Inc.
(a) Investment in Preferred Stock.
(b) Treasury Stock.
(c) Common Stock.
(d) Dividends Payable.
(e) Accumulated Depreciation—Equipment.
(f) Construction in Process.
(g) Petty Cash.
(h) Interest Payable.
(i) Deficit.
(j) Equity Investments (trading).
(k) Income Taxes Payable.
(l) Unearned Subscriptions Revenue.
(m) Work in Process.
(n) Salaries and Wages Payable.
Instructions
For each of the accounts above, indicate the proper balance sheet classification. In the case of borderline items, indicate the additional information that would be required to determine the proper classification.
![]()
![]()
E5-2 (Classification of Balance Sheet Accounts) Presented below are the captions of Faulk Company's balance sheet.
(a) Current assets.
(b) Investments.
(c) Property, plant, and equipment.
(d) Intangible assets.
(e) Other assets.
(f) Current liabilities.
(g) Noncurrent liabilities.
(h) Capital stock.
(i) Additional paid-in capital.
(j) Retained earnings.
Instructions
Indicate by letter where each of the following items would be classified.
- Preferred stock.
- Goodwill.
- Salaries and wages payable.
- Accounts payable.
- Buildings.
- Equity investments (trading).
- Current maturity of long-term debt.
- Premium on bonds payable.
- Allowance for doubtful accounts.
- Accounts receivable.
- Cash surrender value of life insurance.
- Notes payable (due next year).
- Supplies.
- Common stock.
- Land.
- Bond sinking fund.
- Inventory.
- Prepaid insurance.
- Bonds payable.
- Income taxes payable.
E5-3 (Classification of Balance Sheet Accounts) Assume that Fielder Enterprises uses the following headings on its balance sheet.
(a) Current assets.
(b) Investments.
(c) Property, plant, and equipment.
(d) Intangible assets.
(e) Other assets.
(f) Current liabilities.
(g) Long-term liabilities.
(h) Capital stock.
(i) Paid-in capital in excess of par.
(j) Retained earnings.
Instructions
Indicate by letter how each of the following usually should be classified. If an item should appear in a note to the financial statements, use the letter “N” to indicate this fact. If an item need not be reported at all on the balance sheet, use the letter “X.”
- Prepaid insurance.
- Stock owned in affiliated companies.
- Unearned service revenue.
- Advances to suppliers.
- Unearned rent revenue.
- Preferred stock.
- Additional paid-in capital on preferred stock.
- Copyrights.
- Petty cash fund.
- Sales taxes payable.
- Accrued interest on notes receivable.
- Twenty-year issue of bonds payable that will mature within the next year. (No sinking fund exists, and refunding is not planned.)
- Machinery retired from use and held for sale.
- Fully depreciated machine still in use.
- Accrued interest on bonds payable.
- Salaries that company budget shows will be paid to employees within the next year.
- Discount on bonds payable. (Assume related to bonds payable in item 12.)
- Accumulated depreciation—buildings.
- Noncontrolling interest.
![]()
![]()
E5-4 (Preparation of a Classified Balance Sheet) Assume that Denis Savard Inc. has the following accounts at the end of the current year.
- Common Stock.
- Discount on Bonds Payable.
- Treasury Stock (at cost).
- Notes Payable (short-term).
- Raw Materials.
- Preferred Stock Investments (long-term).
- Unearned Rent Revenue.
- Work in Process.
- Copyrights.
- Buildings.
- Notes Receivable (short-term).
- Cash.
- Salaries and Wages Payable.
- Accumulated Depreciation—Buildings.
- Restricted Cash for Plant Expansion.
- Land Held for Future Plant Site.
- Allowance for Doubtful Accounts.
- Retained Earnings.
- Paid-in Capital in Excess of Par—Common Stock.
- Unearned Subscriptions Revenue.
- Receivables—Officers (due in one year).
- Inventory (finished goods).
- Accounts Receivable.
- Bonds Payable (due in 4 years).
- Noncontrolling Interest.
Instructions
Prepare a classified balance sheet in good form. (No monetary amounts are necessary.)
![]()
E5-5 (Preparation of a Corrected Balance Sheet) Uhura Company has decided to expand its operations. The bookkeeper recently completed the balance sheet presented below in order to obtain additional funds for expansion.
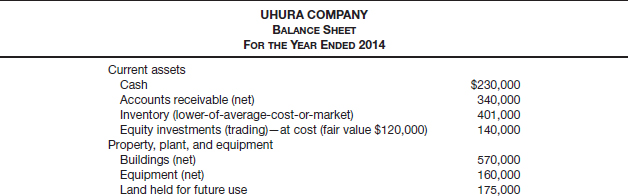
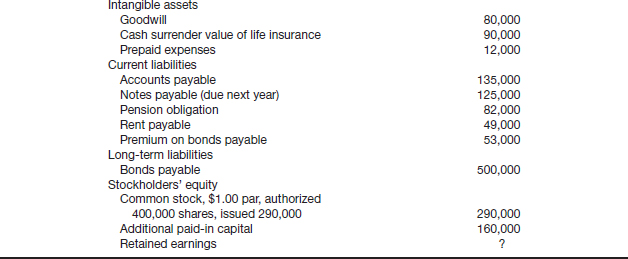
Instructions
Prepare a revised balance sheet given the available information. Assume that the accumulated depreciation balance for the buildings is $160,000 and for the equipment, $105,000. The allowance for doubtful accounts has a balance of $17,000. The pension obligation is considered a long-term liability.
![]()
![]()
E5-6 (Corrections of a Balance Sheet) The bookkeeper for Geronimo Company has prepared the following balance sheet as of July 31, 2014.
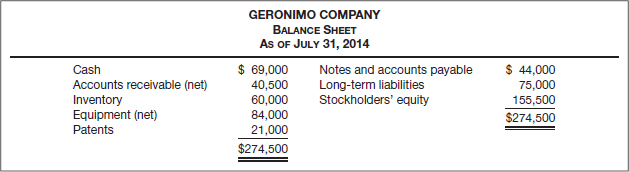
The following additional information is provided.
- Cash includes $1,200 in a petty cash fund and $15,000 in a bond sinking fund.
- The net accounts receivable balance is comprised of the following two items: (a) accounts receivable $44,000 and (b) allowance for doubtful accounts $3,500.
- Inventory costing $5,300 was shipped out on consignment on July 31, 2014. The ending inventory balance does not include the consigned goods. Receivables in the amount of $5,300 were recognized on these consigned goods.
- Equipment had a cost of $112,000 and an accumulated depreciation balance of $28,000.
- Income taxes payable of $6,000 were accrued on July 31. Geronimo Company, however, had set up a cash fund to meet this obligation. This cash fund was not included in the cash balance but was offset against the income taxes payable amount.
Instructions
Prepare a corrected classified balance sheet as of July 31, 2014, from the available information, adjusting the account balances using the additional information.
![]()

E5-7 (Current Assets Section of the Balance Sheet) Presented below are selected accounts of Yasunari Kawabata Company at December 31, 2014.
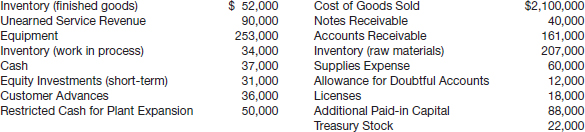
The following additional information is available.
- Inventories are valued at lower-of-cost-or-market using LIFO.
- Equipment is recorded at cost. Accumulated depreciation, computed on a straight-line basis, is $50,600.
- The short-term investments have a fair value of $29,000. (Assume they are trading securities.)
- The notes receivable are due April 30, 2016, with interest receivable every April 30. The notes bear interest at 6%. (Hint: Accrued interest due on December 31, 2014.)
- The allowance for doubtful accounts applies to the accounts receivable. Accounts receivable of $50,000 are pledged as collateral on a bank loan.
- Licenses are recorded net of accumulated amortization of $14,000.
- Treasury stock is recorded at cost.
Instructions
Prepare the current assets section of Yasunari Kawabata Company's December 31, 2014, balance sheet, with appropriate disclosures.
![]()
E5-8 (Current vs. Long-term Liabilities) Frederic Chopin Corporation is preparing its December 31, 2014, balance sheet. The following items may be reported as either a current or long-term liability.
- On December 15, 2014, Chopin declared a cash dividend of $2.50 per share to stockholders of record on December 31. The dividend is payable on January 15, 2015. Chopin has issued 1,000,000 shares of common stock, of which 50,000 shares are held in treasury.
- At December 31, bonds payable of $100,000,000 are outstanding. The bonds pay 12% interest every September 30 and mature in installments of $25,000,000 every September 30, beginning September 30, 2015.
- At December 31, 2013, customer advances were $12,000,000. During 2014, Chopin collected $30,000,000 of customer advances; advances of $25,000,000 should be recognized in income.
Instructions
For each item above, indicate the dollar amounts to be reported as a current liability and as a long-term liability, if any.
![]()
![]()
E5-9 (Current Assets and Current Liabilities) The current assets and current liabilities sections of the balance sheet of Allessandro Scarlatti Company appear as follows.
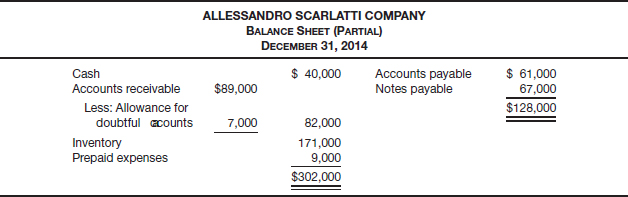
The following errors in the corporation's accounting have been discovered:
- January 2015 cash disbursements entered as of December 2014 included payments of accounts payable in the amount of $39,000, on which a cash discount of 2% was taken.
- The inventory included $27,000 of merchandise that had been received at December 31 but for which no purchase invoices had been received or entered. Of this amount, $12,000 had been received on consignment; the remainder was purchased f.o.b. destination, terms 2/10, n/30.
- Sales for the first four days in January 2015 in the amount of $30,000 were entered in the sales journal as of December 31, 2014. Of these, $21,500 were sales on account and the remainder were cash sales.
- Cash, not including cash sales, collected in January 2015 and entered as of December 31, 2014, totaled $35,324. Of this amount, $23,324 was received on account after cash discounts of 2% had been deducted; the remainder represented the proceeds of a bank loan.
Instructions
(a) Restate the current assets and current liabilities sections of the balance sheet in accordance with good accounting practice. (Assume that both accounts receivable and accounts payable are recorded gross.)
(b) State the net effect of your adjustments on Allessandro Scarlatti Company's retained earnings balance.
![]()
![]()
E5-10 (Current Liabilities) Norma Smith is the controller of Baylor Corporation and is responsible for the preparation of the year-end financial statements. The following transactions occurred during the year.
(a) On December 20, 2014, a former employee filed a legal action against Baylor for $100,000 for wrongful dismissal. Management believes the action to be frivolous and without merit. The likelihood of payment to the employee is remote.
(b) Bonuses to key employees based on net income for 2014 are estimated to be $150,000.
(c) On December 1, 2014, the company borrowed $600,000 at 8% per year. Interest is paid quarterly.
(d) Credit sales for the year amounted to $10,000,000. Baylor's expense provision for doubtful accounts is estimated to be 3% of credit sales.
(e) On December 15, 2014, the company declared a $2.00 per share dividend on the 40,000 shares of common stock outstanding, to be paid on January 5, 2015.
(f) During the year, customer advances of $160,000 were received; $50,000 of this amount was earned by December 31, 2014.
Instructions
For each item above, indicate the dollar amount to be reported as a current liability. If a liability is not reported, explain why.
![]()
E5-11 (Balance Sheet Preparation) Presented below is the adjusted trial balance of Kelly Corporation at December 31, 2014.
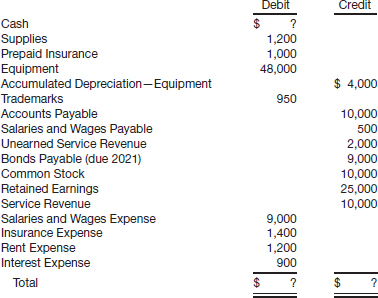
Additional information:
- Net loss for the year was $2,500.
- No dividends were declared during 2014.
Instructions
Prepare a classified balance sheet as of December 31, 2014.
E5-12 (Preparation of a Balance Sheet) Presented below is the trial balance of Scott Butler Corporation at December 31, 2014.
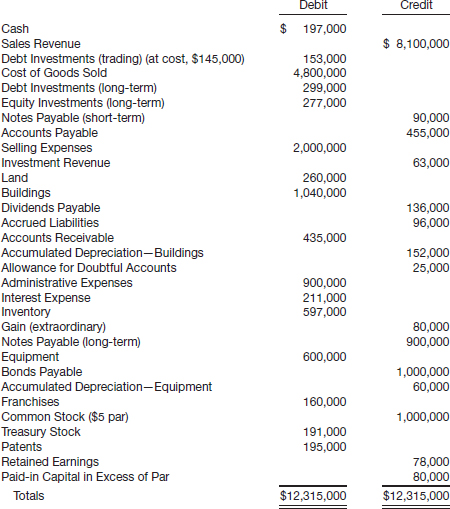
Instructions
Prepare a balance sheet at December 31, 2014, for Scott Butler Corporation. (Ignore income taxes.)
![]()
E5-13 (Statement of Cash Flows—Classifications) The major classifications of activities reported in the statement of cash flows are operating, investing, and financing. Classify each of the transactions listed below as:
- Operating activity—add to net income.
- Operating activity—deduct from net income.
- Investing activity.
- Financing activity.
- Reported as significant noncash activity.
The transactions are as follows.
(a) Issuance of common stock.
(b) Purchase of land and building.
(c) Redemption of bonds.
(d) Sale of equipment.
(e) Depreciation of machinery.
(f) Amortization of patent.
(g) Issuance of bonds for plant assets.
(h) Payment of cash dividends.
(i) Exchange of furniture for office equipment.
(j) Purchase of treasury stock.
(k) Loss on sale of equipment.
(l) Increase in accounts receivable during the year.
(m) Decrease in accounts payable during the year.
![]()
E5-14 (Preparation of a Statement of Cash Flows) The comparative balance sheets of Constantine Cavamanlis Inc. at the beginning and the end of the year 2014 are as follows.
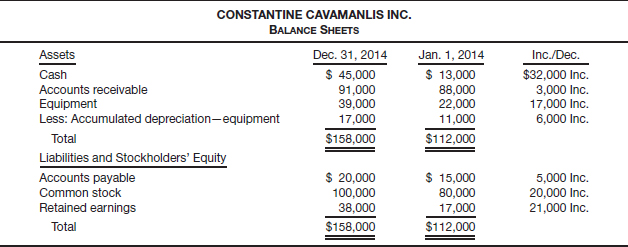
Net income of $44,000 was reported, and dividends of $23,000 were paid in 2014. New equipment was purchased and none was sold.
Instructions
Prepare a statement of cash flows for the year 2014.
![]()
![]()
E5-15 (Preparation of a Statement of Cash Flows) Presented below is a condensed version of the comparative balance sheets for Zubin Mehta Corporation for the last two years at December 31.
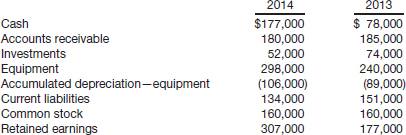
Additional information:
Investments were sold at a loss (not extraordinary) of $10,000; no equipment was sold; cash dividends paid were $30,000; and net income was $160,000.
Instructions
(a) Prepare a statement of cash flows for 2014 for Zubin Mehta Corporation.
(b) Determine Zubin Mehta Corporation's free cash flow.
![]()
![]()
E5-16 (Preparation of a Statement of Cash Flows) A comparative balance sheet for Shabbona Corporation is presented below.
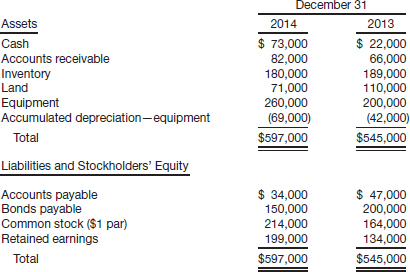
- Net income for 2014 was $125,000. No gains or losses were recorded in 2014.
- Cash dividends of $60,000 were declared and paid.
- Bonds payable amounting to $50,000 were retired through issuance of common stock.
Instructions
(a) Prepare a statement of cash flows for 2014 for Shabbona Corporation.
(b) Determine Shabbona Corporation's current cash debt coverage, cash debt coverage, and free cash flow. Comment on its liquidity and financial flexibility.
![]()
![]()
E5-17 (Preparation of a Statement of Cash Flows and a Balance Sheet) Grant Wood Corporation's balance sheet at the end of 2013 included the following items.
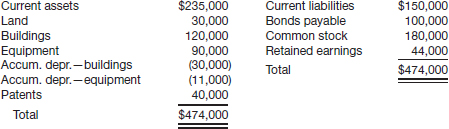
The following information is available for 2014.
- Net income was $55,000.
- Equipment (cost $20,000 and accumulated depreciation $8,000) was sold for $10,000.
- Depreciation expense was $4,000 on the building and $9,000 on equipment.
- Patent amortization was $2,500.
- Current assets other than cash increased by $29,000. Current liabilities increased by $13,000.
- An addition to the building was completed at a cost of $27,000.
- A long-term investment in stock was purchased for $16,000.
- Bonds payable of $50,000 were issued.
- Cash dividends of $30,000 were declared and paid.
- Treasury stock was purchased at a cost of $11,000.
Instructions
(Show only totals for current assets and current liabilities.)
(a) Prepare a statement of cash flows for 2014.
(b) Prepare a balance sheet at December 31, 2014.
![]()
![]()
E5-18 (Preparation of a Statement of Cash Flows, Analysis) The comparative balance sheets of Madrasah Corporation at the beginning and end of the year 2014 appear below.
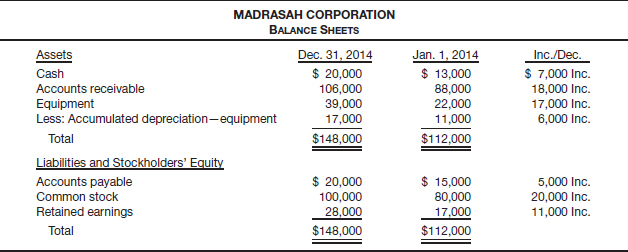
Net income of $44,000 was reported, and dividends of $33,000 were paid in 2014. New equipment was purchased and none was sold.
Instructions
(a) Prepare a statement of cash flows for the year 2014.
(b) Compute the current ratio (current assets ÷ current liabilities) as of January 1, 2014, and December 31, 2014, and compute free cash flow for the year 2014.
(c) In light of the analysis in (b), comment on Madrasah's liquidity and financial flexibility.
EXERCISES SET B
See the book's companion website, at www.wiley.com/college/kieso, for an additional set of exercises.
PROBLEMS
![]()
P5-1 (Preparation of a Classified Balance Sheet, Periodic Inventory) Presented below is a list of accounts in alphabetical order.
- Accounts Receivable
- Accumulated Depreciation—Buildings
- Accumulated Depreciation—Equipment
- Accumulated Other Comprehensive Income
- Advances to Employees
- Advertising Expense
- Allowance for Doubtful Accounts
- Bond Sinking Fund
- Bonds Payable
- Buildings
- Cash (in bank)
- Cash (on hand)
- Cash Surrender Value of Life Insurance
- Commission Expense
- Common Stock
- Copyrights
- Debt Investments (trading)
- Dividends Payable
- Equipment
- Freight-In
- Gain on Disposal of Equipment
- Interest Receivable
- Inventory—Beginning
- Inventory—Ending
- Land
- Land for Future Plant Site
- Loss from Flood
- Noncontrolling Interest
- Notes Payable (due next year)
- Paid-in Capital in Excess of Par—Preferred Stock
- Patents
- Payroll Taxes Payable
- Pension Liability
- Petty Cash
- Preferred Stock
- Premium on Bonds Payable
- Prepaid Rent
- Purchase Returns and Allowances
- Purchases
- Retained Earnings
- Salaries and Wages Expense (sales)
- Salaries and Wages Payable
- Sales Discounts
- Sales Revenue
- Treasury Stock (at cost)
- Unearned Subscriptions Revenue
Instructions
Prepare a classified balance sheet in good form. (No monetary amounts are to be shown.)
![]()
P5-2 (Balance Sheet Preparation) Presented below are a number of balance sheet items for Montoya, Inc., for the current year, 2014.
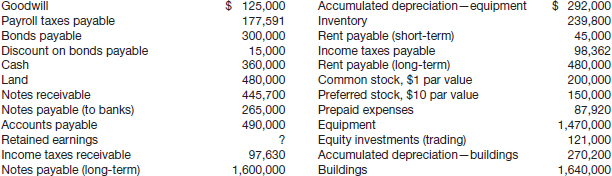
Instructions
Prepare a classified balance sheet in good form. Common stock authorized was 400,000 shares, and preferred stock authorized was 20,000 shares. Assume that notes receivable and notes payable are short-term, unless stated otherwise. Cost and fair value of equity investments (trading) are the same.
![]()
P5-3 (Balance Sheet Adjustment and Preparation) The adjusted trial balance of Eastwood Company and other related information for the year 2014 are presented as follows.
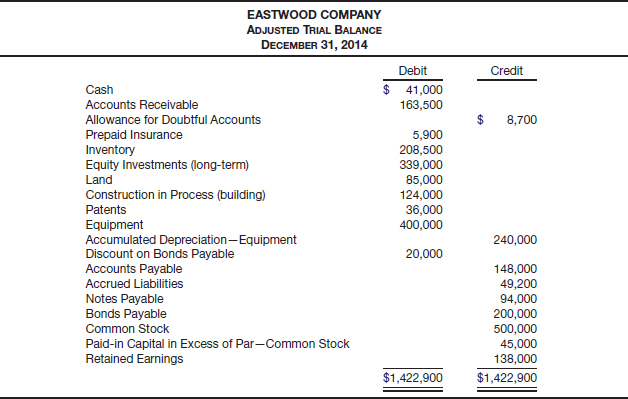
Additional information:
- The LIFO method of inventory value is used.
- The cost and fair value of the long-term investments that consist of stocks and bonds is the same.
- The amount of the Construction in Progress account represents the costs expended to date on a building in the process of construction. (The company rents factory space at the present time.) The land on which the building is being constructed cost $85,000, as shown in the trial balance.
- The patents were purchased by the company at a cost of $40,000 and are being amortized on a straight-line basis.
- Of the discount on bonds payable, $2,000 will be amortized in 2015.
- The notes payable represent bank loans that are secured by long-term investments carried at $120,000. These bank loans are due in 2015.
- The bonds payable bear interest at 8% payable every December 31, and are due January 1, 2025.
- 600,000 shares of common stock of a par value of $1 were authorized, of which 500,000 shares were issued and outstanding.
Instructions
Prepare a balance sheet as of December 31, 2014, so that all important information is fully disclosed.
![]()
![]()
P5-4 (Preparation of a Corrected Balance Sheet) The balance sheet of Kishwaukee Corporation as of December 31, 2014, is as follows.
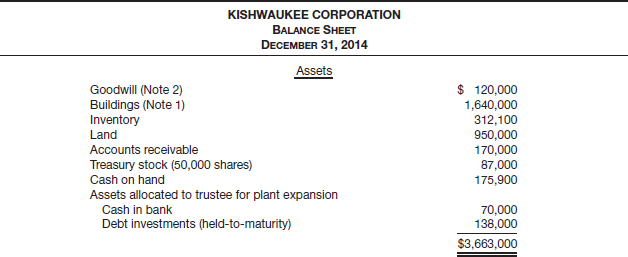
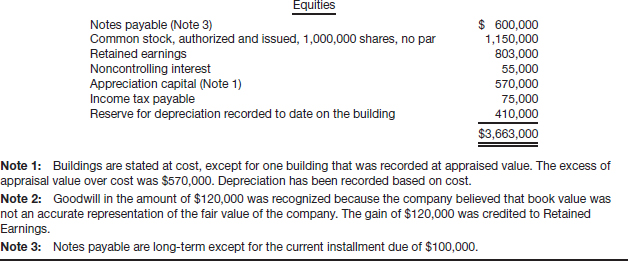
Instructions
Prepare a corrected classified balance sheet in good form. The notes above are for information only.
![]()
![]()
P5-5 (Balance Sheet Adjustment and Preparation) Presented below is the balance sheet of Sargent Corporation for the current year, 2014.
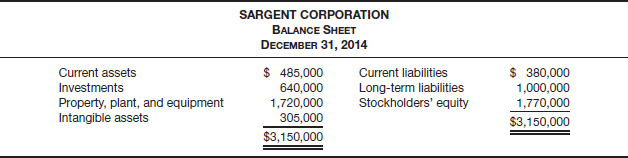
The following information is presented.
- The current assets section includes cash $150,000, accounts receivable $170,000 less $10,000 for allowance for doubtful accounts, inventories $180,000, and unearned rent revenue $5,000. Inventoy is stated on the lower-of-FIFO-cost-or-market.
- The investments section includes the cash surrender value of a life insurance contract $40,000; investments in common stock, short-term (trading) $80,000 and long-term (available-for-sale) $270,000; and bond sinking fund $250,000. The cost and fair value of investments in common stock are the same.
- Property, plant, and equipment includes buildings $1,040,000 less accumulated depreciation $360,000; equipment $450,000 less accumulated depreciation $180,000; land $500,000; and land held for future use $270,000.
- Intangible assets include a franchise $165,000; goodwill $100,000; and discount on bonds payable $40,000.
- Current liabilities include accounts payable $140,000; notes payable—short-term $80,000 and long-term $120,000; and income taxes payable $40,000.
- Long-term liabilities are composed solely of 7% bonds payable due 2022.
- Stockholders' equity has preferred stock, no par value, authorized 200,000 shares, issued 70,000 shares for $450,000; and common stock, $1.00 par value, authorized 400,000 shares, issued 100,000 shares at an average price of $10. In addition, the corporation has retained earnings of $320,000.
Instructions
Prepare a balance sheet in good form, adjusting the amounts in each balance sheet classification as affected by the information given above.
P5-6 (Preparation of a Statement of Cash Flows and a Balance Sheet) Lansbury Inc. had the following balance sheet at December 31, 2013.

During 2014, the following occurred.
- Lansbury Inc. sold part of its investment portfolio for $15,000. This transaction resulted in a gain of $3,400 for the firm. The company classifies its investments as available-for-sale.
- A tract of land was purchased for $18,000 cash.
- Long-term notes payable in the amount of $16,000 were retired before maturity by paying $16,000 cash.
- An additional $20,000 in common stock was issued at par.
- Dividends of $8,200 were declared and paid to stockholders.
- Net income for 2014 was $32,000 after allowing for depreciation of $11,000.
- Land was purchased through the issuance of $30,000 in bonds.
- At December 31, 2014, Cash was $32,000, Accounts Receivable was $41,600, and Accounts Payable remained at $30,000.
Instructions
(a) Prepare a statement of cash flows for 2014.
(b) Prepare an unclassified balance sheet as it would appear at December 31, 2014.
(c) How might the statement of cash flows help the user of the financial statements? Compute two cash flow ratios.
![]()
![]()
![]()
![]()
P5-7 (Preparation of a Statement of Cash Flows and Balance Sheet) Aero Inc. had the following balance sheet at December 31, 2013.
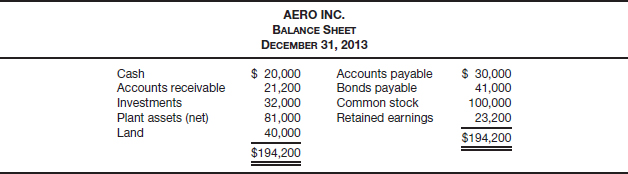
During 2014, the following occurred.
- Aero liquidated its available-for-sale investment portfolio at a loss of $5,000.
- A tract of land was purchased for $38,000.
- An additional $30,000 in common stock was issued at par.
- Dividends totaling $10,000 were declared and paid to stockholders.
- Net income for 2014 was $35,000, including $12,000 in depreciation expense.
- Land was purchased through the issuance of $30,000 in additional bonds.
- At December 31, 2014, Cash was $70,200, Accounts Receivable was $42,000, and Accounts Payable was $40,000.
Instructions
(a) Prepare a statement of cash flows for the year 2014 for Aero.
(b) Prepare the unclassified balance sheet as it would appear at December 31, 2014.
(c) Compute Aero's free cash flow and current cash debt coverage for 2014.
(d) Use the analysis of Aero to illustrate how information in the balance sheet and statement of cash flows helps the user of the financial statements.
PROBLEMS SET B
See the book's companion website, at www.wiley.com/college/kieso, for an additional set of problems.
CONCEPTS FOR ANALYSIS
CA5-1 (Reporting the Financial Effects of Varied Transactions) In an examination of Arenes Corporation as of December 31, 2014, you have learned that the following situations exist. No entries have been made in the accounting records for these items.
- The corporation erected its present factory building in 1999. Depreciation was calculated by the straight-line method, using an estimated life of 35 years. Early in 2014, the board of directors conducted a careful survey and estimated that the factory building had a remaining useful life of 25 years as of January 1, 2014.
- An additional assessment of 2013 income taxes was levied and paid in 2014.
- When calculating the accrual for officers' salaries at December 31, 2014, it was discovered that the accrual for officers' salaries for December 31, 2013, had been overstated.
- On December 15, 2014, Arenes Corporation declared a cash dividend on its common stock outstanding, payable February 1, 2015, to the common stockholders of record December 31, 2014.
Instructions
Describe fully how each of the items above should be reported in the financial statements of Arenes Corporation for the year 2014.
CA5-2 (Identifying Balance Sheet Deficiencies) The assets of Fonzarelli Corporation are presented below (000s omitted).
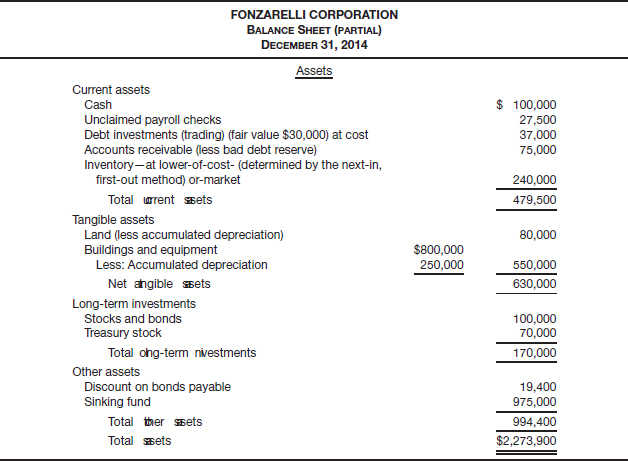
Indicate the deficiencies, if any, in the foregoing presentation of Fonzarelli Corporation's assets.
![]()
CA5-3 (Critique of Balance Sheet Format and Content) Presented below is the balance sheet of Sameed Brothers Corporation (000s omitted).
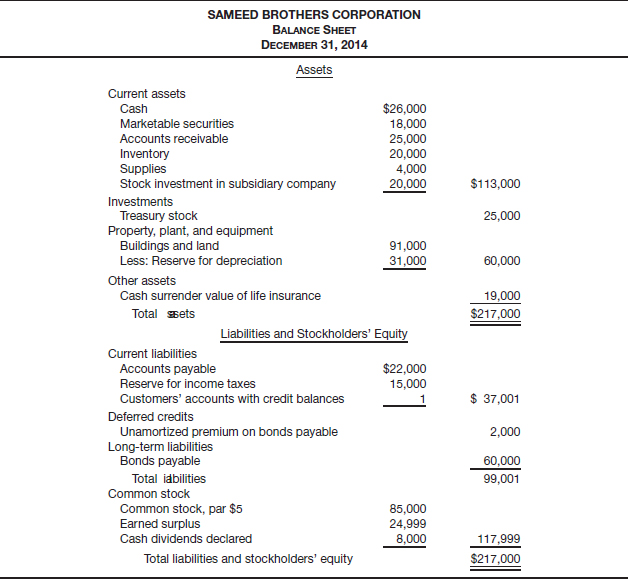
Instructions
Evaluate the balance sheet presented. State briefly the proper treatment of any item criticized.
![]()
CA5-4 (Presentation of Property, Plant, and Equipment) Carol Keene, corporate comptroller for Dumaine Industries, is trying to decide how to present “Property, plant, and equipment” in the balance sheet. She realizes that the statement of cash flows will show that the company made a significant investment in purchasing new equipment this year, but overall she knows the company's plant assets are rather old. She feels that she can disclose one figure titled “Property, plant, and equipment, net of depreciation,” and the result will be a low figure. However, it will not disclose the age of the assets. If she chooses to show the cost less accumulated depreciation, the age of the assets will be apparent. She proposes the following.
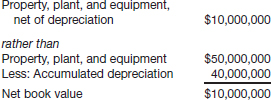
Answer the following questions.
(a) What are the ethical issues involved?
(b) What should Keene do?
![]()
CA5-5 (Cash Flow Analysis) The partner in charge of the Kappeler Corporation audit comes by your desk and leaves a letter he has started to the CEO and a copy of the cash flow statement for the year ended December 31, 2014. Because he must leave on an emergency, he asks you to finish the letter by explaining: (1) the disparity between net income and cash flow, (2) the importance of operating cash flow, (3) the renewable source(s) of cash flow, and (4) possible suggestions to improve the cash position.
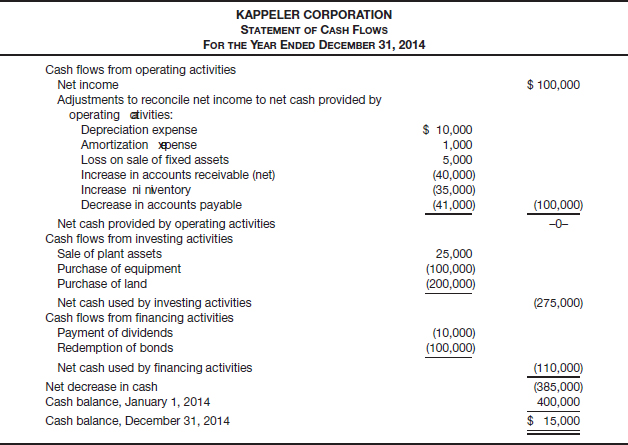
Date
President Kappeler, CEO
Kappeler Corporation
125 Wall Street
Middleton, Kansas 67458
Dear Mr. Kappeler:
I have good news and bad news about the financial statements for the year ended December 31, 2014. The good news is that net income of $100,000 is close to what we predicted in the strategic plan last year, indicating strong performance this year. The bad news is that the cash balance is seriously low. Enclosed is the Statement of Cash Flows, which best illustrates how both of these situations occurred simultaneously …
Instructions
Complete the letter to the CEO, including the four components requested by your boss.
USING YOUR JUDGMENT
Financial Reporting Problem
The Procter & Gamble Company (P&G)
![]()
The financial statements of P&G are presented in Appendix 5B. The company's complete annual report, including the notes to the financial statments, can be accessed at the book's companion website, www.wiley.com/college/kieso.
Instructions
Refer to P&G's financial statements and the related information in the annual report to answer the following questions.
(a) What alternative formats could P&G have adopted for its balance sheet? Which format did it adopt?
(b) Identify the various techniques of disclosure P&G might have used to disclose additional pertinent financial information. Which technique does it use in its financials?
(c) In what classifications are P&G's investments reported? What valuation basis does P&G use to report its investments? How much working capital did P&G have on June 30, 2011? On June 30, 2010?
(d) What were P&G's cash flows from its operating, investing, and financing activities for 2011? What were its trends in net cash provided by operating activities over the period 2009 to 2011? Explain why the change in accounts payable and in accrued and other liabilities is added to net income to arrive at net cash provided by operating activities.
(e) Compute P&G's (1) current cash debt coverage, (2) cash debt coverage, and (3) free cash flow for 2011. What do these ratios indicate about P&G's financial condition?
Comparative Analysis Case
The Coca-Cola Company and PepsiCo, Inc.
Instructions
Go to the book's companion website and use information found there to answer the following questions related to The Coca-Cola Company and PepsiCo, Inc.
(a) What format(s) did these companies use to present their balance sheets?
(b) How much working capital did each of these companies have at the end of 2011? Speculate as to their rationale for the amount of working capital they maintain.
(c) What is the most significant difference in the asset structure of the two companies? What causes this difference?
(d) What are the companies' annual and 5-year (2007–2011) growth rates in total assets and long-term debt?
(e) What were these two companies' trends in net cash provided by operating activities over the period 2007–2011?
(f) Compute both companies' (1) current cash debt coverage, (2) cash debt coverage, and (3) free cash flow. What do these ratios indicate about the financial condition of the two companies?
Financial Statement Analysis Cases
Case 1: Uniroyal Technology Corporation
Uniroyal Technology Corporation (UTC), with corporate offices in Sarasota, Florida, is organized into three operating segments. The high-performance plastics segment is responsible for research, development, and manufacture of a wide variety of products, including orthopedic braces, graffiti-resistant seats for buses and airplanes, and a static-resistant plastic used in the central processing units of microcomputers. The coated fabrics segment manufactures products such as automobile seating, door and instrument panels, and specialty items such as waterproof seats for personal watercraft and stain-resistant, easy-cleaning upholstery fabrics. The foams and adhesives segment develops and manufactures products used in commercial roofing applications.
The following items relate to operations in a recent year.
- Serious pressure was placed on profitability by sharply increasing raw material prices. Some raw materials increased in price 50% during the past year. Cost containment programs were instituted and product prices were increased whenever possible, which resulted in profit margins actually improving over the course of the year.
- The company entered into a revolving credit agreement, under which UTC may borrow the lesser of $15,000,000 or 80% of eligible accounts receivable. At the end of the year, approximately $4,000,000 was outstanding under this agreement. The company plans to use this line of credit in the upcoming year to finance operations and expansion.
Instructions
(a) Should investors be informed of raw materials price increases, such as described in item 1? Does the fact that the company successfully met the challenge of higher prices affect the answer? Explain.
(b) How should the information in item 2 be presented in the financial statements of UTC?
Case 2: Sherwin-Williams Company
Sherwin-Williams, based in Cleveland, Ohio, manufactures a wide variety of paint and other coatings, which are marketed through its specialty stores and in other retail outlets. The company also manufactures paint for automobiles. The Automotive Division has had financial difficulty. During a recent year, five branch locations of the Automotive Division were closed, and new management was put in place for the branches remaining.
The following titles were shown on Sherwin-Williams's balance sheet for that year.
- Accounts payable
- Accounts receivable, less allowance
- Accrued taxes
- Buildings
- Cash and cash equivalents
- Common stock
- Employee compensation payable
- Finished goods inventories
- Intangibles and other assets
- Land
- Long-term debt
- Machinery and equipment
- Other accruals
- Other capital
- Other current assets
- Other long-term liabilities
- Postretirement obligations other than pensions
- Retained earnings
- Short-term investments
- Taxes payable
- Work in process and raw materials inventories
Instructions
(a) Organize the accounts in the general order in which they would have been presented in a classified balance sheet.
(b) When several of the branch locations of the Automotive Division were closed, what balance sheet accounts were most likely affected? Did the balance in those accounts decrease or increase?
Case 3: Deere & Company
Presented below is the SEC-mandated disclosure of contractual obligations provided by Deere & Company in a recent annual report. Deere & Company reported current assets of $27,208 and total current liabilities of $15,922 at year-end. All dollars are in millions.
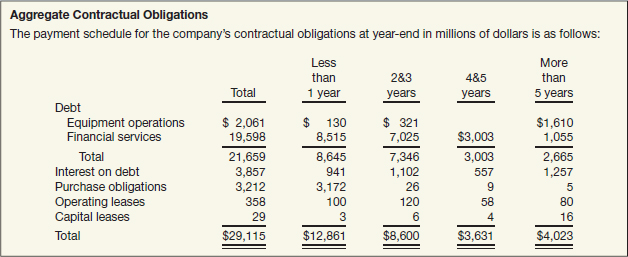
(a) Compute Deere & Company's working capital and current ratio (current assets ÷ current liabilities) with and without the contractual obligations reported in the schedule.
(b) Briefly discuss how the information provided in the contractual obligation disclosure would be useful in evaluating Deere & Company for loans (1) due in one year and (2) due in five years.
Case 4: Amazon.com
The incredible growth of Amazon.com has put fear into the hearts of traditional retailers. Amazon's stock price has soared to amazing levels. However, it is often pointed out in the financial press that it took the company several years to report its first profit. The following financial information is taken from a recent annual report.
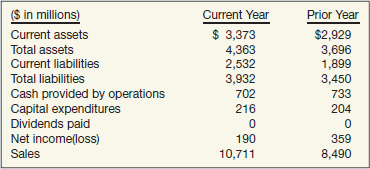
Instructions
(a) Calculate free cash flow for Amazon for the current and prior years, and discuss its ability to finance expansion from internally generated cash. Thus far Amazon has avoided purchasing large warehouses. Instead, it has used those of others. It is possible, however, that in order to increase customer satisfaction the company may have to build its own warehouses. If this happens, how might your impression of its ability to finance expansion change?
(b) Discuss any potential implications of the change in Amazon's cash provided by operations from the prior year to the current year.
Accounting, Analysis, and Principles
Early in January 2015, Hopkins Company is preparing for a meeting with its bankers to discuss a loan request. Its bookkeeper provided the following accounts and balances at December 31, 2014.
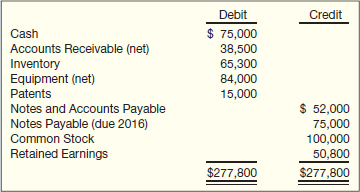
Except for the following items, Hopkins has recorded all adjustments in its accounts.
- Cash includes $500 petty cash and $15,000 in a bond sinking fund.
- Net accounts receivable is comprised of $52,000 in accounts receivable and $13,500 in allowance for doubtful accounts.
- Equipment had a cost of $112,000 and accumulated depreciation of $28,000.
- On January 8, 2015, one of Hopkins' customers declared bankruptcy. At December 31, 2014, this customer owed Hopkins $9,000.
Prepare a corrected December 31, 2014, balance sheet for Hopkins Company.
Analysis
Hopkins' bank is considering granting an additional loan in the amount of $45,000, which will be due December 31, 2015. How can the information in the balance sheet provide useful information to the bank about Hopkins' ability to repay the loan?
Principles
In the upcoming meeting with the bank, Hopkins plans to provide additional information about the fair value of its equipment and some internally generated intangible assets related to its customer lists. This information indicates that Hopkins has significant unrealized gains on these assets, which are not reflected on the balance sheet. What objections is the bank likely to raise about the usefulness of this information in evaluating Hopkins for the loan renewal?
BRIDGE TO THE PROFESSION
![]()
Professional Research: FASB Codification
In light of the full disclosure principle, investors and creditors need to know the balances for assets, liabilities, and equity as well as the accounting policies adopted by management to measure the items reported in the balance sheet.
Instructions
If your school has a subscription to the FASB Codification, go to http://aaahq.org/asclogin.cfm to log in and prepare responses to the following. Provide Codification references for your responses.
(a) Identify the literature that addresses the disclosure of accounting policies.
(b) How are accounting policies defined in the literature?
(c) What are the three scenarios that would result in detailed disclosure of the accounting methods used?
(d) What are some examples of common disclosures that are required under this statement?
Additional Professional Resources
See the book's companion website, at www.wiley.com/college/kieso, for professional simulations as well as other study resources.
 INSIGHTS
LEARNING OBJECTIVE ![]()
Compare the accounting procedures related to the balance sheet under GAAP and IFRS.
As in GAAP, the balance sheet and the statement of cash flows are required statements for IFRS. In addition, the content and presentation of an IFRS statement of financial position (balance sheet) and cash flow statement are similar to those used for GAAP. In general, the disclosure requirements related to the balance sheet and the statement of cash flows are much more extensive and detailed in the United States. IAS 1, “Presentation of Financial Statements,” provides the overall IFRS requirements for balance sheet information. IAS 7, “Cash Flow Statements,” provides the overall IFRS requirements for cash flow information. IFRS insights on the statement of cash flows are presented in Chapter 23.
Following are the key similarities and differences between GAAP and IFRS related to the balance sheet.
Similarities
- Both IFRS and GAAP allow the use of title “balance sheet” or “statement of financial position.” IFRS recommends but does not require the use of the title “statement of financial position” rather than balance sheet.
- Both IFRS and GAAP require disclosures about (1) accounting policies followed, (2) judgments that management has made in the process of applying the entity's accounting policies, and (3) the key assumptions and estimation uncertainty that could result in a material adjustment to the carrying amounts of assets and liabilities within the next financial year. Comparative prior period information must be presented and financial statements must be prepared annually.
- IFRS and GAAP require presentation of non-controlling interests in the equity section of the balance sheet.
Differences
- IFRS requires a classified statement of financial position except in very limited situations. IFRS follows the same guidelines as this textbook for distinguishing between current and non-current assets and liabilities. However, under GAAP, public companies must follow SEC regulations, which require specific line items. In addition, specific GAAP mandates certain forms of reporting for this information.
- Under IFRS, current assets are usually listed in the reverse order of liquidity. For example, under GAAP cash is listed first, but under IFRS it is listed last.
- IFRS has many differences in terminology that you will notice in this textbook. For example, in the sample statement of financial position illustrated on page 279, notice in the equity section common stock is called share capital—ordinary.
- Use of the term “reserve” is discouraged in GAAP, but there is no such prohibition in IFRS.
ABOUT THE NUMBERS
Classification in the Statement of Financial Position
Statement of financial position accounts are classified. That is, a statement of financial position groups together similar items to arrive at significant subtotals. Furthermore, the material is arranged so that important relationships are shown. The IASB indicates that the parts and subsections of financial statements are more informative than the whole. Therefore, the IASB discourages the reporting of summary accounts alone (total assets, net assets, total liabilities, etc.).
Instead, companies should report and classify individual items in sufficient detail to permit users to assess the amounts, timing, and uncertainty of future cash flows. Such classification also makes it easier for users to evaluate the company's liquidity and financial flexibility, profitability, and risk. Companies then further divide these items into several subclassifications. A representative statement of financial position presentation is shown on the next page.
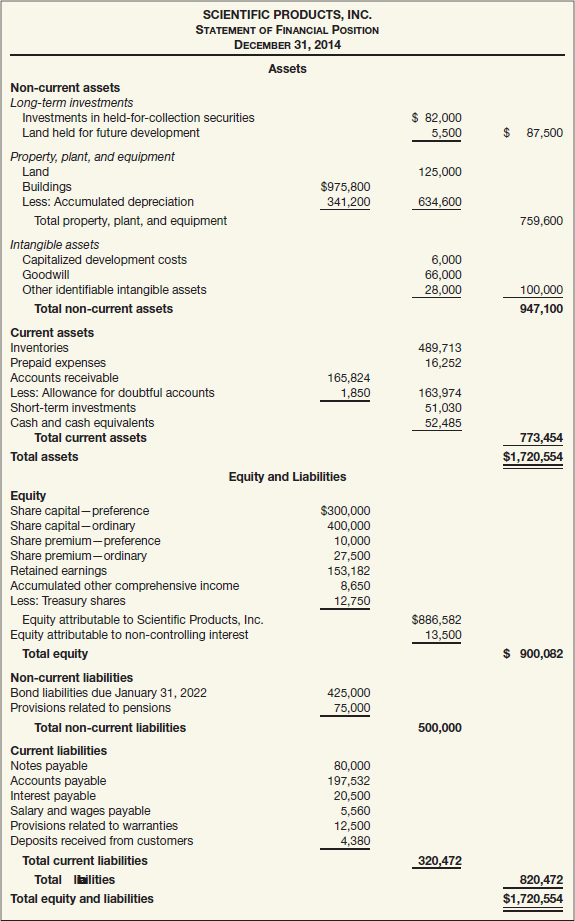
The statement presented is in “report form” format. Some companies use other statement of financial position formats. For example, companies sometimes deduct current liabilities from current assets to arrive at working capital. Or, they deduct all liabilities from all assets. Some companies report the subtotal net assets, which equals total assets minus total liabilities.
Equity
The equity (also referred to as shareholders' equity) section is one of the most difficult sections to prepare and understand. This is due to the complexity of ordinary and preference share agreements and the various restrictions on equity imposed by corporation laws, liability agreements, and boards of directors. Companies usually divide the section into six parts:
EQUITY SECTION
- SHARE CAPITAL. The par or stated value of shares issued. It includes ordinary shares (sometimes referred to as common shares) and preference shares (sometimes referred to as preferred shares).
- SHARE PREMIUM. The excess of amounts paid-in over the par or stated value.
- RETAINED EARNINGS. The corporation's undistributed earnings.
- ACCUMULATED OTHER COMPREHENSIVE INCOME. The aggregate amount of the other comprehensive income items.
- TREASURY SHARES. Generally, the amount of ordinary shares repurchased.
- NON-CONTROLLING INTEREST (MINORITY INTEREST). A portion of the equity of subsidiaries not owned by the reporting company.
For ordinary shares, companies must disclose the par value and the authorized, issued, and outstanding share amounts. The same holds true for preference shares. A company usually presents the share premium (for both ordinary and preference shares) in one amount, although subtotals are informative if the sources of additional capital are varied and material. The retained earnings amount may be divided between the unappropriated (the amount that is usually available for dividend distribution) and restricted (e.g., by bond indentures or other loan agreements) amounts. In addition, companies show any shares reacquired (treasury shares) as a reduction of equity.
Accumulated other comprehensive income (sometimes referred to as reserves or other reserves) includes such items as unrealized gains and losses on non-trading equity investments and unrealized gains and losses on certain derivative transactions. Non-controlling interest, sometimes referred to as minority interest, is also shown as a separate item (where applicable) as a part of equity.
Delhaize Group presented its equity section as follows.
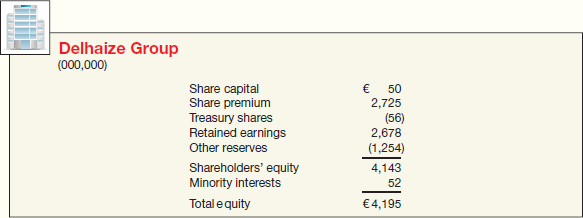
Many companies reporting under IFRS often use the term “reserve” as an all-inclusive catch-all for items such as retained earnings, share premium, and accumulated other comprehensive income.
Revaluation Equity
GAAP and IFRS differ in the IFRS provision for balance sheet revaluations of property, plant, and equipment. Under the revaluation model, revaluations are recorded and reported as part of equity. To illustrate, Richardson Company uses IFRS and has property and equipment on an historical cost basis of $2,000,000. At the end of the year, Richardson appraises its property and equipment and determines it had a revaluation increase of $243,000.
Richardson records this revaluation under IFRS with an increase to property and equipment as well as a valuation reserve in equity. A note to the financial statements explains the change in the revaluation equity account from one period to the next, as shown below for Richardson Company, assuming a beginning balance of $11,345,000.
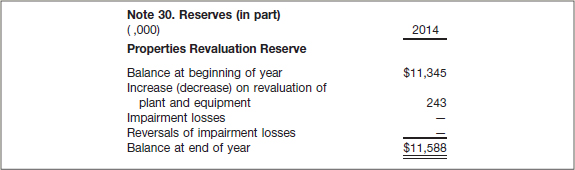
Fair Presentation
Companies must present fairly the financial position, financial performance, and cash flows of the company. Fair presentation means the faithful representation of transactions and events using the definitions and recognition criteria in the IASB conceptual framework. It is presumed that the use of IFRS with appropriate disclosure results in financial statements that are fairly presented. In other words, inappropriate use of accounting policies cannot be overcome by explanatory notes to the financial statements. In some rare cases, as indicated in Chapter 2, companies can use a “true and fair” override. This situation develops, for example, when the IFRS for a given company appears to conflict with the objective of financial reporting. This situation might occur when a regulatory body indicates that a specific IFRS may be misleading. As indicated earlier, a true and fair override is highly unlikely in today's reporting environment.
One recent and highly publicized exception is the case of Société Générale (SocGen), a French bank. The bank used the true and fair rule to justify reporting losses that occurred in 2008 in the prior year. Although allowed under the true and fair rule, such reporting was questioned because it permitted the bank to “take a bath,” that is, record as many losses as possible in 2007, which was already a bad year for the bank. As a result, SocGen's 2008 reports looked better. [See F. Norris, “SocGen Changes Its Numbers,” The New York Times (May 13, 2008).]
ON THE HORIZON
The FASB and the IASB are working on a project to converge their standards related to financial statement presentation. A key feature of the proposed framework is that each of the statements will be organized, in the same format, to separate an entity's financing activities from its operating and investing activities and, further, to separate financing activities into transactions with owners and creditors. Thus, the same classifications used in the statement of financial position would also be used in the statement of comprehensive income and the statement of cash flows. The project has three phases. You can follow the joint financial presentation project at the following link: http://www.fasb.org/project/financial_statement_ presentation.shtml.
IFRS SELF-TEST QUESTIONS
- Which of the following statements about IFRS and GAAP accounting and reporting requirements for the balance sheet is not correct?
(a) Both IFRS and GAAP distinguish between current and non-current assets and liabilities.
(b) The presentation formats required by IFRS and GAAP for the balance sheet are similar.
(c) Both IFRS and GAAP require that comparative information be reported.
(d) One difference between the reporting requirements under IFRS and those of the GAAP balance sheet is that an IFRS balance sheet may list long-term assets first.
- Current assets under IFRS are listed generally:
(a) by importance.
(b) in the reverse order of their expected conversion to cash.
(c) by longevity.
(d) alphabetically.
- Companies that use IFRS:
(a) may report all their assets on the statement of financial position at fair value.
(b) are not allowed to net assets (assets − liabilities) on their statement of financial positions.
(c) may report non-current assets before current assets on the statement of financial position.
(d) do not have any guidelines as to what should be reported on the statement of financial position.
- Franco Company uses IFRS and owns property, plant, and equipment with a historical cost of $5,000,000. At December 31, 2013, the company reported a valuation reserve of $690,000. At December 31, 2014, the property, plant, and equipment was appraised at $5,325,000. The valuation reserve will show what balance at December 31, 2014?
(a) $365,000.
(b) $325,000.
(c) $690,000.
(d) $0.
- A company has purchased a tract of land and expects to build a production plant on the land in approximately 5 years. During the 5 years before construction, the land will be idle. Under IFRS, the land should be reported as:
(a) land expense.
(b) property, plant, and equipment.
(c) an intangible asset.
(d) a long-term investment.
IFRS CONCEPTS AND APPLICATION
IFRS5-1 Where can authoritative IFRS guidance be found related to the statement of financial position (balance sheet) and the statement of cash flows?
IFRS5-2 Briefly describe some of the similarities and differences between GAAP and IFRS with respect to statement of financial position (balance sheet) reporting.
IFRS5-3 Briefly describe the convergence efforts related to financial statement presentation.
IFRS5-4 Rainmaker Company prepares its financial statements in accordance with IFRS. In 2014, Rainmaker recorded the following revaluation adjustments related to its buildings and land: The company's building increased in value by $200,000; its land declined by $35,000. How will these revaluation adjustments affect Rainmaker's balance sheet? Will the reporting differ under GAAP? Explain.
IFRS5-5 Presented below is the balance sheet for Tomkins plc, a British company.
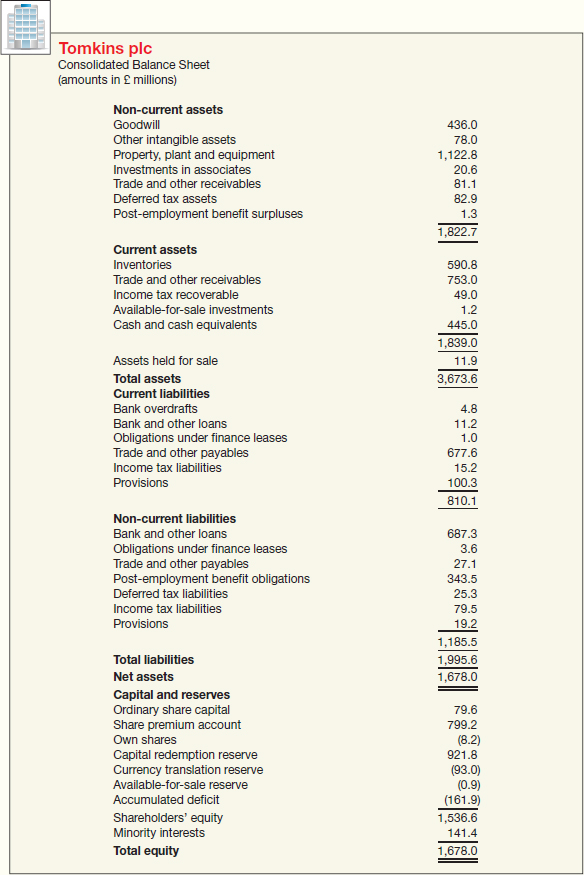
(a) Identify at least three differences in balance sheet reporting between British and U.S. firms, as shown in Tomkins' balance sheet.
(b) Review Tomkins' balance sheet and identify how the format of this financial statement provides useful information, as illustrated in the chapter.
Professional Research
IFRS5-6 In light of the full disclosure principle, investors and creditors need to know the balances for assets, liabilities, and equity, as well as the accounting policies adopted by management to measure the items reported in the statement of financial position.
Instructions
Access the IFRS authoritative literature at the IASB website (http://eifrs.iasb.org/). (If necessary, click on the IFRS tab and then register for eIFRS free access.) When you have accessed the documents, you can use the search tool in your Internet browser to respond to the following questions. (Provide paragraph citations.)
(a) Identify the literature that addresses the disclosure of accounting policies.
(b) How are accounting policies defined in the literature?
(c) What are the guidelines concerning consistency in applying accounting policies?
(d) What are some examples of common disclosures that are required under this statement?
International Financial Reporting Problem
Marks and Spencer plc
IFRS5-7 The financial statements of Marks and Spencer plc (M&S) are available at the book's companion website or can be accessed at http://annualreport.marksandspencer.com/_assets/downloads/Marks-and-Spencer-Annual-report-and-financial-statements-2012.pdf.
Instructions
Refer to M&S's financial statements and the accompanying notes to answer the following questions.
(a) What alternative formats could M&S have adopted for its statement of financial position? Which format did it adopt?
(b) Identify the various techniques of disclosure M&S might have used to disclose additional pertinent financial information. Which technique does it use in its financials?
(c) In what classifications are M&S's investments reported? What valuation basis does M&S use to report its investments? How much working capital did M&S have on 31 March 2012? On 2 April 2011?
(d) What were M&S's cash flows from its operating, investing, and financing activities for 2012? What were its trends in net cash provided by operating activities over the period 2011 to 2012? Explain why the change in accounts payable and in accrued and other liabilities is added to net income to arrive at net cash provided by operating activities.
(e) Compute M&S's (1) current cash debt coverage, (2) cash debt coverage, and (3) free cash flow for 2012. What do these ratios indicate about M&S's financial conditions?
ANSWERS TO IFRS SELF-TEST QUESTIONS
- b
- b
- c
- b
- d
Remember to check the book's companion website to find additional resources for this chapter.
1Risk conveys the unpredictability of future events, transactions, circumstances, and results of the company.
2“Reporting Income, Cash Flows, and Financial Position of Business Enterprises,” Proposed Statement of Financial Accounting Concepts (Stamford, Conn.: FASB, 1981), par. 29.
3“Reporting Income, Cash Flows, and Financial Position of Business Enterprises,” Proposed Statement of Financial Accounting Concepts (Stamford, Conn.: FASB, 1981), par. 25.
4We discuss several of these omitted items (such as leases and other off-balance-sheet arrangements) in later chapters. See Wayne Upton, Jr., Special Report: Business and Financial Reporting, Challenges from the New Economy (Norwalk, Conn.: FASB, 2001); and U.S. Securities and Exchange Commission, “Disclosure in Management's Discussion and Analysis about Off-Balance Sheet Arrangements and Aggregate Contractual Obligations,” http://www.sec.gov/rules/final/33-8182.htm (May 2003).
5“Reporting Income, Cash Flows, and Financial Positions of Business Enterprises,” Proposed Statement of Financial Accounting Concepts (Stamford, Conn.: FASB, 1981), par. 51.
6“Elements of Financial Statements of Business Enterprises,” Statement of Financial Accounting Concepts No. 6 (Stamford, Conn.: FASB, 1985), paras. 25, 35, and 49.
7Under the fair value option, companies may elect to use fair value as the measurement basis for selected financial assets and liabilities. For these companies, some of their financial assets (and liabilities) may be recorded at historical cost, while others are recorded at fair value. [2]
8Companies usually explain the pertinent rights and privileges of the various securities (both debt and equity) outstanding in the notes to the financial statements. Examples of information that companies should disclose are dividend and liquidation preferences, participation rights, call prices and dates, conversion or exercise prices or rates and pertinent dates, sinking fund requirements, unusual voting rights, and significant terms of contracts to issue additional shares. [4]
9Accounting Trends and Techniques (New York: AICPA) recently indicates that all of the 500 companies surveyed use either the “report form” (484) or the “account form” (16), sometimes collectively referred to as the “customary form.”
10The FASB recommends the basis as “cash and cash equivalents.” Cash equivalents are liquid investments that mature within three months or less.
11Level 3 fair value measurements may be developed using expected cash flow and present value techniques, as described in “Using Cash Flow Information and Present Value in Accounting,” Statement of Financial Accounting Concepts No. 7, as discussed in Chapter 6.