Chapter 13: Creating and Deploying Detection Rules
In many security incidents, response times were long because threats were not detected early enough and adequately due to multiple factors. These include the improvement of the threat actor's ability to evade detection or the lack of detection of the monitoring tools because they did not have the configuration or information about that specific threat.
That is why it is so important to have a proactive approach in incident response, where it is assumed that, at some point, there will be security compromises that could not be detected by the Security Operation Center (SOC).
One way to do this is through rules to hunt threats in a more specific way to have a clear idea about what and where you need to look for specific information, rather than very generically, as this would be the equivalent of looking for a needle in a haystack.
In this chapter, you will learn about the following:
- Introduction to detection rules
- Detecting malicious files using YARA rules
- Detecting malicious behavior using Sigma rules
Technical requirements
In case you haven't already, you need to download and install VMware Workstation Player from this link https://www.vmware.com/products/workstation-player/workstation-player-evaluation.html.
You'll also need to download the following from the book's official GitHub repository https://github.com/PacktPublishing/Incident-Response-with-Threat-Intelligence:
- Virtual machines:
- IR-Laptop
- IR-Workstation
- Lab file:
- Chapter13
Configuring the detection lab
Before we start with the practical exercises of this chapter, we will need to prepare the work environment.
To begin, start up the virtual machines that we will use throughout the chapter. To do this, follow these steps:
- Start VMware Workstation Player.
- Start the IR-Laptop virtual machine and log in using the following credentials:
- Username: investigator
- Password: L34rn1ng!
- Start the IR-Workstation virtual machine and log in using the following credentials:
- Username: investigator
- Password: L34rn1ng!
In the next part, we will start the Elasticsearch, Logstash, and Kibana (ELK) stack services on the IR-Workstation virtual machine.
Starting ELK stack services
As in the previous chapter, we will use the ELK stack to hunt for malicious behavior. If you didn't install it, follow the instructions described in Chapter 12, Working with Analytics and Detection Engineering in Incident Response.
If you started your virtual machine and the services are not initialized, run the following commands in a terminal of the IR-Workstation virtual machine:
- Open a new terminal console using Ctrl + Alt + T or click on the Terminal button.
- First, we will check the ELK services' statuses to verify whether they are already running:
sudo systemctl status elasticsearch.service
sudo systemctl status logstash.service
sudo systemctl status kibana.service
- If the services are not running, start them by running the following commands:
sudo systemctl start elasticsearch.service
sudo systemctl start logstash.service
sudo systemctl start kibana.service
This is shown in the following screenshot:

Figure 13.1 – Starting the ELK stack main services
Once we have our virtual machines ready, we will begin working on creating rules for threat hunting in incident response.
Introduction to detection rules
You learned in the previous chapter how to work with detection engineering to identify malicious behavior in incident response.
Sometimes, you can detect this behavior through monitoring, but other times, this will not be the case, and you must act proactively to identify this behavior. This will be a priority to contain threats.
Turning detection engineering into actionable security through detection rules is one of the most important skills to develop as an incident responder.
Detection rules are structured patterns of key information to search for specific indicators in the form of queries that you can run on different platforms such as ELK, Splunk, NetWitness, and CrowdStrike.
There are different kinds of rules; for example, there are rules to identify Indicators of Compromise (IoCs) or specific content as YARA rules, or rules to identify Indicators of Attack (IoAs) as Sigma rules. You will learn how to use both in this chapter.
Detection rules are mainly used for threat hunting, and these can be run centrally or directly on the devices that you want to investigate. You can also automate the process of hunting threats, or you can do it manually.
Detecting malicious files using YARA rules
YARA is a powerful tool developed by Victor Manuel Alvarez (Twitter handle @plusvic) from VirusTotal. With YARA, you can search files with specific content, and this is used by security professionals and malware researchers to identify and classify malicious files, but you can also use it to find any kind of content on a disk.
This tool is particularly helpful in incident response; for example, when you are in the triage process and you identify a file as potentially malicious, it will probably help you find that file on other devices across the network to size the compromise.
The creation of YARA rules is based on the identification of specific patterns of file contents, so you need to first get the suspicious file to analyze it and identify unique patterns that you could use to create the rule.
In the next subsection, you will learn the principal parts of the structure of a YARA rule.
Structure of a YARA rule
The structure of a YARA rule is quite simple, as is shown in the following figure:

Figure 13.2 – Basic structure of a YARA rule
These are the main parts of a YARA rule:
- The name of the rule (A): In the name or identifier of the rule, you can describe the kind of content you are looking for.
- The metadata section (B): This section is designed to provide information about the rule. It is recommended that you include as much information as possible.
- The strings section (C): This is one of the key elements when you create a rule; you can specify multiple pieces of unique information that could be found in a particular file.
According to the official documentation, there are three types of strings in YARA:
- hexadecimal strings
- text strings
- regular expressions
Text strings are case-sensitive by default, but you can use the nocase modifier at the end of the line to ignore the case.
You can use the wide modifier to search 2-byte strings per character.
If you don't define the wide modifier, the string will be ASCII by default.
- The conditions section (D): This is another key element of the rule; here, you can define the conditions that must be met for detection and reduce the possibility of false positives.
Not all the sections are mandatory, but the simplest YARA must include at least the name of the rule and a condition.
Creating YARA rules
There are several tools that you can use to create YARA rules. In fact, you can use any text editor, although it is recommended to use tools that support and recognize the specific syntax and the structure of a rule. In this way, it will be easier to create and debug the rules.
In this case, we are going to use Visual Studio Code (VS Code), since it has support for YARA by means of an extension queue you can download directly from the application. Other tools that can also support YARA are Atom, Sublime and Far Manager.
Installing the YARA extension on VS Code
To install the YARA extension, first, you need to open VS Code:
- On the IR-Laptop virtual machine, click on the VS Code icon:
Figure 13.3 – Opening VS Code
- Once VS Code is open, click on the extension button on the left-hand menu.
- Write the word yara in the search extensions text box.
Once the YARA extension appears, click on the Install button. This will install the YARA extension, as shown in the following screenshot:

Figure 13.4 – Installing the YARA extension on VS Code
Once the installation is finished, you can review the details of how to use the extension and the included features. Now, you are ready to create and use your first YARA rule.
Analyzing and identifying patterns in files
An essential part of creating YARA rules is the identification of patterns in the files we want to search. There are several tools that can help us with this; in this case, we will use a tool known as PeStudio.
Downloading PeStudio
PeStudio is a tool to analyze files with a portable executable (PE) structure, for instance, Windows files with the .exe, .dll, and .bin extensions. You can find more details about the PE structure at https://docs.microsoft.com/en-us/windows/win32/debug/pe-format.
To download and install PeStudio, follow these steps:
- Download the free version directly from https://www.winitor.com/download.
- From the Downloads directory, right-click on the pestudio.zip file and select Extract All….
- Click on the Browse… button and navigate to the C:UsersInvestigatorWorkspaceTools directory.
- Click on the Extract button.
The preceding steps are shown in the following screenshot:

Figure 13.5 – Downloading and extracting PeStudio
This tool does not require installation, so once the folder is unzipped, it will be ready to use.
Using PeStudio
As mentioned previously, PeStudio will allow us to analyze the contents of a file that we could consider suspicious or malicious, and, in this way, we can create our YARA rule to search for that same file on other computers.
In Chapter 11, Integrating SOAR Capabilities into Incident Response, we downloaded the ProcDump tool from the Windows Sysinternals suite, which is used to dump processes from a computer and can be misused by malicious actors to obtain sensitive information such as passwords.
If at the identification stage in incident response, you found this program on one of the compromised computers and it was not an authorized tool for use on that computer, this could be an indicator that the threat actor used it as part of the attack.
We will use PeStudio to analyze this program. To do so, follow these steps:
- Go to the C:UsersInvestigatorWorkspaceToolspestudio directory and double-click on the pestudio.exe file. If a Microsoft Defender SmartScreen dialog box appears, simply click on More info, and then press the Run anyway button as this is a reliable tool, as shown in the following screenshot:

Figure 13.6 – Opening PeStudio
- Once PeStudio is open, navigate to the C:UsersInvestigatorDownloadsProcdump directory and drag the procdump64.exe file to PeStudio, as shown in the following screenshot:

Figure 13.7 – Adding a PE file to PeStudio
PeStudio begins to classify the contents of the file according to its PE structure and content so that it can be easily analyzed.
On the left side of the tool, you can see the different groups of information that are identified in the file, and on the right side, its contents. For this example, we're going to focus on the following:
- The number of suspicious indicators within the file
- The number of detections in VirusTotal (if any antivirus detects it as a malicious tool; in this case, it is not considered malicious by any antivirus)
- The sections of the file in a blacklist
- The strings contained in the file and from which we can choose those that can be used for detection
In this way, if you select the 0 (size) option, you will see the list of string values recognized in the file, as you can see in the following screenshot:

Figure 13.8 – Analyzing the content of a PE file
The challenge here is to identify the specific patterns that make this sample unique so that they can be used in search of this file.
For example, in the preceding screenshot, strings with messages appear that are unlikely to exist in other programs, so, they are good candidates to be used in our YARA rule.
On the other hand, if you move to the sections (blacklist) part, you will find highlighted in red the column that is in position 4 (in this case, the initial position is counted from 0) with a value in the name of _RDATA, as seen in the following screenshot:

Figure 13.9 – Identifying malicious patterns
In this way, you can collect information for the construction of your rule.
Now, look for additional information that you consider unique in this file; it is important to mention that quantity does not necessarily mean quality.
Building a good rule does not always require many elements, but you must identify those that can be important.
Detecting potential threats using YARA rules
To start using YARA, you can download the most recent version from https://github.com/VirusTotal/yara/releases:
- In this case, we will use YARA v4.2.0, which can be downloaded directly from here: https://github.com/VirusTotal/yara/releases/download/v4.2.0/yara-v4.2.0-1885-win64.zip.
- Once you have downloaded the tool, unzip the .zip file into a new directory called yara, as shown in the C:UsersInvestigatorWorkspaceToolsyara path.
Note
You can add this directory to the environment variables of Windows to avoid explicitly specifying the path of YARA every time you execute a search using yara.
Once you have downloaded YARA, you are ready to create your first detection rule.
Open VS Code, click on the File menu, and select New File.
Now, click again on the File menu and select Save As….
- When the dialog box appears, change the save path to the C:UsersInvestigatorWorkspaceLabsChapter_13 directory.
- On the Save as type option, change to yara (*.yara;*.yar).
- Name the file procdump_tool.yara.
- Click on the Save button.
The preceding steps are shown in the following screenshot:

Figure 13.10 – Saving a YARA rule
When saving the file as a YARA type, VS Code will recognize the structure and syntax of the code, so that it can be debugged in a simpler way.
- Type the word rule and press the Tab key. This way, VS Code will create the skeleton of a YARA rule, as shown in the following screenshot:

Figure 13.11 – Creating a skeleton of a YARA rule
Next, we can start creating the YARA rule providing the specific strings and conditions about what we want to detect.
There is no single way to create a YARA rule; the best rule is the one that works and is efficient. The best way to learn how to create rules is by practicing; your skills will be perfected as you gain experience in doing so.
To create the YARA rule, use the following information:
import "pe"
rule procdump_tool {
meta:
description = "Simple YARA rule to detect the presence of Sysinternals Procdump"
version = "1.0"
strings:
$s1 = "D:\a\1\s\x64\Release\ProcDump64.pdb" ascii
$s2 = "Process cloning requires Windows 7 or higher." wide ascii
$s3 = "ProcDump Timed" wide ascii
condition:
(uint16(0)) == 0x5A4D and (filesize < 500000) and (2 of ($s*))
and pe.sections[4].name=="_RDATA"
}
The rule to detect ProcDump in a device must look as in the following screenshot:

Figure 13.12 – Creating a YARA rule
The following are the elements of the rule explained in detail:
- import "pe": As we will use information from one of the sections of the PE structure of the file, it will be necessary to define the import of the PE library in the first line.
- rule procdump_tool: In the name of the rule, we are going to describe the name of the tool and that it belongs to the category of a whitelisted tool, so it could not be considered malicious.
- meta: In the metadata section, we will simply define a description of what is sought to detect with this rule, and a version number that will serve in case the rule is updated to detect new versions of this tool.
- strings: In the strings section, we will simply use some of the strings that we found in this file that we consider to be unique to this program, along with their properties (as described previously).
Note
It is important to mention that we need to add the escape character () when we define a path of a file or folder or when there are special characters, as is the case in the $s1 and $s2 string variables.
- conditions: This part is very important because you can specify the criteria for the files that match this rule. For this case, we will use the following conditions:
- uint16(0) == 0x5A4D – This condition defines that those files with a PE format will be considered for a strings search and refers to the magic number of the first sector of a Windows binary file that must contain the 0x5A4D value (ASCII for '"M" and "Z"; MZ are the initials of Mark Zbikowski, who was a developer/architect of the MS-DOS file system).
- filesize < 500000 – This condition, like the previous one, speeds up the search process since only those files that are less than the specified size are considered for processing and searching.
- 2 of ($s*) – With this condition, we are establishing that at least two of the strings must be identified within the file for it to match the rule.
- pe.sections[4].name=="_RDATA" – This is where we are using import "pe" to define the condition that the name of the _RDATA section exists, which is not common in binary files.
We created a YARA rule that would help us detect the ProcDump tool, and now, we are ready to test it.
Testing the YARA rule
Now, to work more efficiently, we will use the terminal integrated into VS Code. In this way, we can test our rule while we interact with it:
- In VS Code, go to the Terminal menu and select New Terminal, as shown in the following screenshot:

Figure 13.13 – Opening New Terminal in VS Code
This will open a PowerShell terminal at the bottom of VS Code (which is configured by default).
- Let's open a Command Prompt terminal; simply click the Launch Profile... button and select Command Prompt, as shown in the following screenshot:

Figure 13.14 – Opening a Command Prompt console
Now, you have a Windows console window from where you can test your YARA rule and you can modify or debug it.
- In the VS Code Terminal console, change to the directory where YARA is located:
cd C:UsersInvestigatorWorkspaceToolsyara
- Type the following command:
yara64.exe -s "C:UsersInvestigatorWorkspaceLabsChapter-13procdump_tool.yara" -r "C:UsersInvestigatorWorkspaceTools"
In the preceding command, the following happens:
- The -s parameter instructs YARA to print the strings on the screen.
- The -r parameter instructs YARA to perform the search recursively from the indicated directory. Once you run the command, you can see that the rule designed to detect the procdump64.exe file matched the three strings and fits the criteria of the condition, as shown in the following screenshot:

Figure 13.15 – Running a YARA rule
- If you want to see the detection that matched the rule on the $s2 string, you can use a CyberChef recipe; just copy and paste the following text on the web browser:
https://gchq.github.io/CyberChef/#recipe=Unescape_string()&input=UFx4MDByXHgwMG9ceDAwY1x4MDBlXHgwMHNceDAwc1x4MDAgXHgwMGNceDAwbFx4MDBvXHgwMG5ceDAwaVx4MDBuXHgwMGdceDAwIFx4MDByXHgwMGVceDAwcVx4MDB1XHgwMGlceDAwclx4MDBlXHgwMHNceDAwIFx4MDBXXHgwMGlceDAwblx4MDBkXHgwMG9ceDAwd1x4MDBzXHgwMCBceDAwN1x4MDAgXHgwMG9ceDAwclx4MDAgXHgwMGhceDAwaVx4MDBnXHgwMGhceDAwZVx4MDByXHgwMC5ceDAw
- In the Output section of CyberChef, you will see the following string:
P.r.o.c.e.s.s. .c.l.o.n.i.n.g. .r.e.q.u.i.r.e.s. .W.i.n.d.o.w.s. .7. .o.r. .h.i.g.h.e.r...
You will learn more about CyberChef in Chapter 14, Hunting and Investigating Security Incidents.
Modifying a YARA rule to improve detection
One way to test whether this rule does not generate false positives is to run it on different directories or computers, mainly performing searches against files of the operating system itself or known application files.
My colleagues from Kaspersky's Global Research and Analysis Team (GreAT) developed an open source tool that allows you to install and configure your own server to test your rules and improve the quality of detections. This project is called Klara, and you can download it from this repository: https://github.com/KasperskyLab/klara.
In this case, we designed a rule to focus on the detection of the procdump64.exe file specifically, but what happens to the other two files, procdump.exe and procdump4a.exe, which can also be used by a malicious actor? Why were they not detected?
We did not review the other two files to see whether they contained the same strings or conditions present in procdump64.exe.
When this scenario occurs, it is very important that our rule can also detect those variants of the program that could also represent a threat and not only specific versions. To do so, it is recommended to analyze all the files and discard those elements that may not be common to everyone, and perhaps include some other elements that we might have overlooked.
Take your time to analyze what you need to modify in your rule so that the other files can also be detected.
Again, there is no one-stop solution, and you might find different ways to do it. In this case, try different solutions, for instance, comment out the last condition and you will get a different result. In this example, you detected the other ProcDump files but not the first one, as is shown in the following screenshot:

Figure 13.16 – Modifying the rule to detect related files
As you can see, if only the last condition is excluded (where the name of the _RDATA section is described), only the other versions of the program will be detected. This is because the _RDATA section doesn't exist in those files.
Now, it's your turn; try to find what you need to change on this rule to detect the three versions of the ProcDump tool by yourself.
As I mentioned before, YARA is an essential tool for incident response and there are many sources of information, courses, and repositories created by and for the community to make the detection process more efficient.
In the next section, we will learn about Sigma rules and how we can use them to identify malicious behavior.
Detecting malicious behavior using Sigma rules
One of the challenges for organizations is the standardization and integration of different security tools and the normalization of the formats that these tools use to process and store the information.
Sigma was created under the idea of developing generic rules in a structured format that can be transformed into specific query formats for different Security Information and Event Management (SIEM) systems. With Sigma, you can create rules under specific criteria of detection engineering, regardless of the platform you are using to hunt threats, as you can see in the following figure:

Figure 13.17 – The Sigma project
The advantage of this approach is that researchers can create universal rules shared with the community and used by everyone.
The main creators of the Sigma project are Florian Roth (Twitter handle @cyb3rops) and Thomas Patzke (Twitter handle @blubbfiction).
You can use Sigma along with other threat hunting tools such as YARA to detect threats in incident response.
The structure of Sigma rules is based on the YAML format, so it's very important to be familiar with this markup language. You can learn the basics of YAML here: https://www.cloudbees.com/blog/yaml-tutorial-everything-you-need-get-started.
Also, I recommend that you take a look at the Sigma specification wiki to learn about the structure of Sigma rules, at https://github.com/SigmaHQ/sigma/wiki/Specification.
Many targets support queries created by Sigma rules, such as Splunk, ELK, Azure Sentinel, ArcSight, QRadar, RSA NetWitness, and PowerShell.
Also, there are multiple projects and products that use Sigma, such as MISP, SOC Prime – Sigma Rule Editor, Uncoder.IO, THOR, and Joe Sandbox.
You can find more information on the GitHub of the project at https://github.com/SigmaHQ/sigma.
In the next part, you will learn how to get Sigma tools and create your own rules.
Cloning the repository
To have access to the Sigma project and the community Sigma rules, you can clone the repository to your IR-Laptop virtual machine:
- Open a new Windows Terminal/Windows Subsystem for Linux (WSL) instance as administrator, as shown in the following screenshot:

Figure 13.18 – Opening a new WSL instance
- Now, open a web browser and navigate to the Sigma GitHub project at https://github.com/SigmaHQ/sigma.
- Click on the Code button and then on the copy button to send the clone URL to the clipboard, as shown in the following screenshot:

Figure 13.19 – Copying the Sigma GitHub project URL
- To clone the repository, run the following command on the WSL terminal:
git clone https://github.com/SigmaHQ/sigma.git
This will clone the Sigma GitHub repository onto your IR-Laptop virtual machine, as shown in the following screenshot:

Figure 13.20 – Cloning the Sigma project
- Now, change to the Sigma project directory and take a look at the content:
cd sigma
ls -l
You will see the different directories of the project, as shown in the following screenshot:

Figure 13.21 – Reviewing the content of Sigma's GitHub project
In this case, we will use the content of the tools and rules folders to do the exercises.
Creating Sigma rules
You can convert rules into multiple query formats; in this case, we are going to run our queries in the IR-Laptop virtual machine looking for IoAs, so we will convert a Sigma rule into a PowerShell query.
In the previous section, we emulated malicious behavior; we used a living-off-the-land tool (certutil.exe) to download the Procdump64.exe tool (the command-line utility that creates crash dumps and is used sometimes by malicious actors).
After that, we ran ProcDump to dump the lsass.exe process and get the passwords from Windows.
This behavior generated multiple log entries on Windows-Sysmon. (If you didn't do this exercise or install Sysmon, you can follow the steps described in Chapter 11, Integrating SOAR Capabilities into Incident Response.)
In this case, we are going to create a Sigma rule to detect this behavior, but first, we will use the concepts of detection engineering that you learned about in Chapter 12, Working with Analytics and Detection Engineering in Incident Response.
Creating or analyzing detection engineering
Before creating a Sigma rule, we must first familiarize ourselves with the malicious behavior we want to detect and the possible sources of information to look for the IoA. We will start searching for this information in MITRE Cyber Analytics Repository (CAR):
- On your web browser, navigate to the MITRE CAR project in the Analytics section (https://car.mitre.org/analytics/).
- Search for the analytics to detect the use of ProcDump on the system (you can use the Ctrl + F key shortcut and then write procdump in the search box). You will see CAR-2019-07-002, as shown in the following screenshot, which could be useful in this case:

Figure 13.22 – Analytics for the OS Credential Dumping behavior
- Click on the CAR-2019-07-002 link to go to the description and content of these analytics.
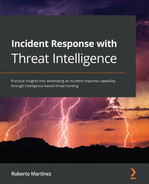
Review the details of these analytics and go to the Implementation section; you will see the information you need to focus on for creating a detection rule. In this case, we are going to focus on a process creation where the name is procdump*.exe and the command line contains the *lsass* string, as shown in the following screenshot:
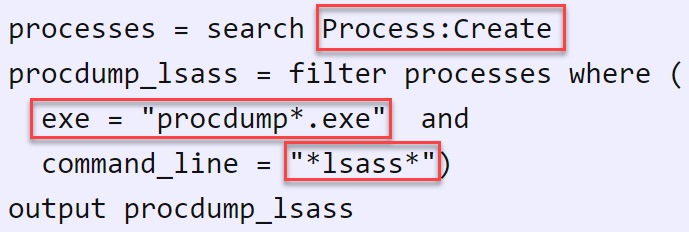
Figure 13.23 – The ProcDump detection pseudocode
Now, using the previous information, we are going to create a very simple Sigma rule using VS Code.
- Open VS Code.
- Create a new file and save it as proc_creation_win_procdump_lsass in the C:UsersInvestigatorWorkspaceLabsChapter-13 path. Be sure that you select YAML in the Save as type field, as shown in the following screenshot:

Figure 13.24 – Saving a new Sigma rule file
- Review the Sigma specification wiki at https://github.com/SigmaHQ/sigma/wiki/Specification and create a Sigma rule based on the pseudocode of the CAR-2019-07-002 analytics, focusing on the following attributes for detection:
- EventID: 1 – This is the number of the Sysmon event ID for process creation.
- 'procdump*.exe' – This looks for executable files for different versions of ProcDump.
- 'lsass' – This looks for a string in a command-line execution called "lsass".
Note
You can also download and use the SigmaRuleTemplate.yml file from the Chapter-13 folder in the book's repository to create the Sigma rule.
Your rule should look like the following screenshot:

Figure 13.25 – Creating a Sigma rule
Something important that you should consider is that threat actors almost all the time will seek to evade detections, therefore, it is important to create rules that detect these evasion techniques. In this case, we are creating a rule that detects the execution of ProcDump in a simple and direct way to obtain the dump of the lsass.exe process.
For instance, an evasion technique could be to call the process ID of lsass.exe instead of the name of the process, and this will work combined with other techniques to avoid detection.
To learn more about creating Sigma rules, you can see the tutorial created by Florian Roth here: https://www.nextron-systems.com/2018/02/10/write-sigma-rules/.
Converting Sigma rules
As I mentioned at the beginning of this section, Sigma rules are designed to define a generic detection format that you can convert through the field mapping to specific searches to be used by multiple platforms, so we are going to need a converter to do this. We will use two Sigma rules converters:
- Sigmac: This is the current Sigma rules converter, but will be replaced by the Sigma CLI.
- Sigma CLI: This converter tool uses the pySigma library to convert generic rules into different search queries.
In the next part, we are going to learn how to install and use both tools.
Converting Sigma rules using Sigmac
Sigmac is the converter tool that uses the Sigma library; this library can be used to integrate with other projects and tools. To start using Sigmac, you will need to first install Python's Preferred Installer Program (pip) and then sigmatools:
- First, update the sources of Ubuntu by running the following command in Windows Terminal/WSL:
sudo apt update
- To install pip3, run the following command:
sudo apt install python3-pip
- Now, install Sigmac by running the following command:
sudo pip3 install sigmatools
- To validate that everything is okay, and to review the help, run the following command:
sigmac -h
You will see examples of how to use this tool with the different parameters, as you can see in the following screenshot:

Figure 13.26 – Viewing the help of the Sigmac converter
Now that you have installed Sigmac, let's see how you can use it to convert rules for different targets.
- Open a new terminal in VS Code.
- On the VS Code menu, select View and then click on Terminal, as shown in the following screenshot:

Figure 13.27 – Opening a VS Code terminal
At the bottom, you'll be able to see the built-in PowerShell console. In this case, we will need a WSL terminal, so we will have to add a new console.
- Click on the Launch Profile... button and then click on Ubuntu-20.04 (WSL), as shown in the following screenshot:

Figure 13.28 – Creating a new WSL terminal
You will see the new WSL console start working with the Sigmac converter.
- Switch to the sigma directory:
cd /home/investigator/sigma
- Run the sigmac command by providing the following parameters:
sigmac -t es-qs -c winlogbeat /mnt/c/Users/Investigator/Workspace/Labs/Chapter-13/proc_creation_win_procdump_lsass.yml
In the preceding command, we performed the following actions:
- -t es-qs is the backend target where you will run the search query; in this case, an Elasticsearch query string.
- -c winlogbeat is the configuration source of the fields; in this case, Elastic's Winlogbeat.
- .../Workspace/Labs/Chapter-13/proc_creation_win_procdump_lsass.yml is the path and the name of the Sigma rule.
You will see the converted Sigma rule as the output shown in the following screenshot:

Figure 13.29 – Converting a Sigma rule into an Elasticsearch query
In the next part, you will run this query on Kibana.
Running the converted query on Kibana
To run the query created from the Sigma rule:
- Open a web browser on the IR-Laptop and navigate to Kibana: http://192.168.8.140:5601.
Note
If you get the message Kibana server is not ready yet when accessing the Kibana website, you will need to review the status of the ELK stack services on the IR-Workstation virtual machine and, if necessary, start them.
- Click on the hamburger menu button, and then select Discover, as shown in the following screenshot:

Figure 13.30 – Opening the Kibana Discover dashboard
- In the Show dates section, be sure to cover the period where you dumped the lsass.exe process using ProcDump, as shown in the following screenshot:
Figure 13.31 – Applying the search period filter
- Copy the following query generated when you converted the Sigma rule:
(winlog.channel:"Microsoft-Windows-Sysmon/Operational" AND winlog.event_id:"1" AND winlog.event_data.Image.keyword:*procdump*.exe* AND winlog.event_data.CommandLine.keyword:*lsass*)
- Paste the query in the search text box and click on the Update button to apply:

Figure 13.32 – Running an Elasticsearch query on Kibana
You will see the list of occurrences about the execution of ProcDump in the period defined.
- Expand the event and scroll down to see more details about the fields that match our rule, as shown in the following screenshot:

Figure 13.33 – Analyzing the detection patterns
Additionally, you can add more detection elements to the rule to make it more accurate; test it for yourself by applying the concepts learned and consulting the reference links.
In the next part, you will learn how to create Sigma rules using the Sigma CLI.
Converting Sigma rules using the Sigma CLI
For this part, we are going to convert Sigma rules into queries using the Sigma CLI.
- First, we need to install the pysigma library by running the following command:
sudo pip install pysigma==0.4.5
- Install the Sigma CLI using pip3 by running the following command on the WSL terminal of VS Code:
sudo pip install sigma-cli==0.3.1
This is shown in the following screenshot:

Figure 13.34 – Installing the Sigma CLI
Note
You can also install the most recent versions of pysigma and sigma-cli by running the following commands:
sudo pip install pysigma
sudo pip install sigma-cli
- To see the help on the use of the tool, just run the following command:
sigma convert --help
Once the Sigma CLI is installed, we are going to convert Splunk queries from Sysmon and CrowdStrike Falcon Data Replicator (FDR) logs.
- In VS Code, run the following command:
sigma convert -s -t splunk -p sysmon rules/windows/process_creation -o splunk_queries.conf
In the preceding command, we performed the following actions:
- -s – This skips unsupported formats or rules that can't be processed by the backend.
- -t splunk – This is the target query format to be converted.
- -p sysmon – These are the pipelines' or rules' YAML files.
- rules/windows/process_creation – This is the path of the rules or the name of the rule file to be converted.
- -o splunk_queries.conf – This is the output file to save the queries.
You will see the conversion process, as shown in the following screenshot:

Figure 13.35 – Converting a Sigma rules collection to Splunk queries
- Open the splunk_queries.conf file using vim by running the following command:
vim splunk_queries.conf
You will see the different Splunk queries converted from the rules files, as shown in the following screenshot:

Figure 13.36 – Viewing the Splunk queries
In the same way that you ran the query on Kibana, you can run any of these queries on Splunk.
As you can see, you can create generic Sigma rules from detection engineering, and then you can convert these rules into queries that can be run in different threat hunting platforms or SIEM solutions.
Using additional tools that use rules to scan for threats
Fortunately, the cybersecurity community is developing more tools that use rules to search for threat indicators. These are some of the most interesting and free tools:
- THOR Lite – This is a free multiplatform scanner (Windows, Linux, and macOS) that uses precompiled and encrypted signatures to detect different IoCs and supports different output formats (https://www.nextron-systems.com/thor-lite/).
- Aurora – This is a Sigma-based endpoint detection and response (EDR) agent; Aurora Lite is an alternative free version (https://www.nextron-systems.com/2021/11/13/aurora-sigma-based-edr-agent-preview/).
- YaraMemoryScanner – This is a script to scan the memory processes using YARA rules. The script is developed in PowerShell (https://github.com/BinaryDefense/YaraMemoryScanner).
- yarGen – This is a YARA rules generator tool developed in Python that creates rules from suspicious strings found in malicious files (https://github.com/Neo23x0/yarGen).
- F-Secure Chainsaw – This uses Sigma rules to search malicious behavior directly on the Windows XML EventLog EVTX log files (Windows and Linux).
- Zircolite – This also uses Sigma rules to search malicious behavior directly on EVTX files, but also audit, Sysmon for Linux, or JSONK/NDJSON logs. It is based on Python (https://github.com/wagga40/Zircolite).
- Uncoder.io – This is a universal web-based Sigma rule converter (https://uncoder.io/).
- SIGMA UI – This is an open source tool based on ELK that uses the Sigma converter tool (sigmac) (https://github.com/socprime/SigmaUI).
There are situations in enterprise environments where scalability is an important factor; for that reason, you should also consider tools that offer support for use cases where it is required to execute the rules on multiple devices on the network.
Summary
In this chapter, you learned about the importance of creating rules from detection engineering to detect IoCs, malicious tools, and malicious behavior.
You also learned the basic concepts about YARA and Sigma to create rules, and the different tools that can be used to improve the detection capabilities in incident response.
In the last chapter, you will have the opportunity to apply the knowledge learned in the different chapters of this book in practical scenarios of a simulated cybersecurity incident.
Further reading
- Detecting the Unknown, A Guide to Threat Hunting: https://hodigital.blog.gov.uk/wp-content/uploads/sites/161/2020/03/Detecting-the-Unknown-A-Guide-to-Threat-Hunting-v2.0.pdf
- Official YARA documentation: https://yara.readthedocs.io/en/stable/
- Upping the APT hunting game: Learn the best YARA practices from Kaspersky: https://www.brighttalk.com/webcast/15591/388802
- SAS2018: Finding aliens, star weapons, and ponies with YARA: https://youtu.be/fbidgtOXvc0
- Using YARA to attribute malware: https://blog.malwarebytes.com/threat-analysis/2013/10/using-yara-to-attribute-malware/
- ReversingLabs YARA Rules: https://github.com/reversinglabs/reversinglabs-yara-rules
- Tool Analysis Result Sheet: https://jpcertcc.github.io/ToolAnalysisResultSheet/
- Detecting Lateral Movement through Tracking Event Logs: https://www.jpcert.or.jp/english/pub/sr/20170612ac-ir_research_en.pdf
- SOC Prime: Sigma rules repository mirror and translations: https://sigma.socprime.com/