
Chapter 10: Implementing an Incident Management System
An incident management system is a core component of the incident response process. Documentation and activity management allow the timely monitoring of each of the phases and facilitate decision making.
Fortunately, there are multiple incident management systems on the market, both open source and commercial, so you can make a diagnosis of the capabilities within the organization to then choose which is the best option.
TheHive is not just an incident ticketing system; this platform includes, among other things, case management capabilities, playbook integration, access to external intelligence sources through the tool known as Cortex, and support for MITRE ATT&CK, among other things.
In this chapter, you will learn how to use TheHive as an incident management system and we will cover the following topics:
- Understanding the TheHive architecture
- Setting up TheHive and creating cases
- Creating and managing cases
- Integrating intelligence with Cortex
Technical requirements
In case you haven't already, you need to download and install VMware Workstation Player from this link https://www.vmware.com/products/workstation-player/workstation-player-evaluation.html.
To access additional resources described in this chapter, you can visit the official GitHub repository of this book: https://github.com/PacktPublishing/Incident-Response-with-Threat-Intelligence.
You will need to download the Demo Virtual Machine with the latest versions of TheHive and Cortex by clicking on https://marketing.strangebee.com/thehive-cortex-demo-virtual-machine and completing the form with your information, as shown in the following screenshot:
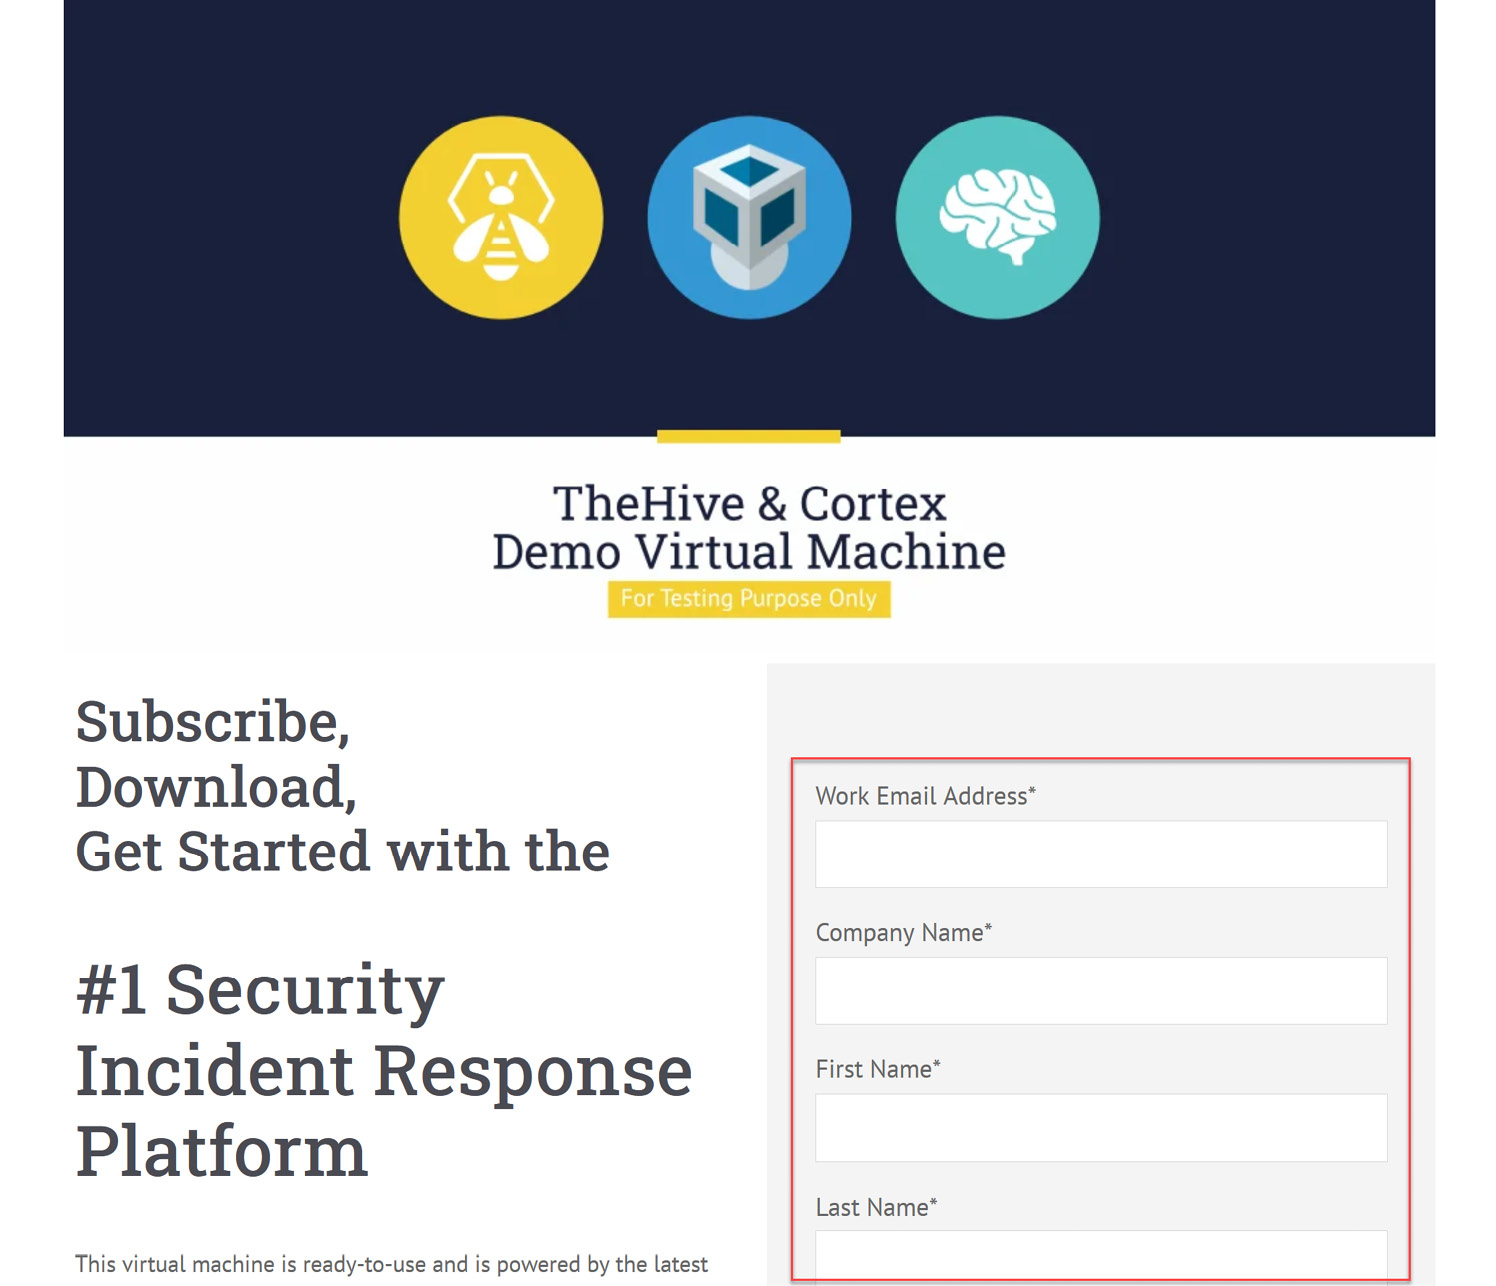
Figure 10.1 – Download of TheHive virtual machine
Once you've finished the registration, you will receive an email with the link to download the virtual machine (VM).
Note
You can also download the VM used in this book from the book's VMs repository: https://github.com/PacktPublishing/Incident-Response-with-Threat-Intelligence.
To start using this virtual pre-installed version of TheHive, you need to import the downloaded .ova file using VMware Workstation Player by following these steps:
- Click on the Open Virtual Machine option.
- Click on the Browse button, name it IR-TheHive, and define the path where you want to import the VM.
- Click the Import button.

Figure 10.2 – Importing the .ova file
You might receive the following warning dialog box. If that's the case, just click the Retry button to continue with the importation process, as you can see in the following figure:
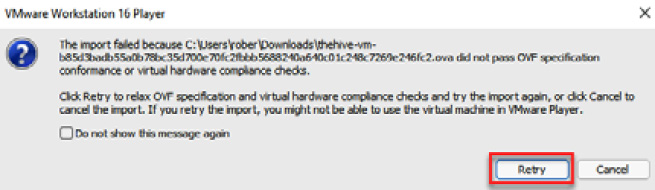
Figure 10.3 – Warning compatibility error message
Note
This warning appeared because the file does not comply with the OVF specification; however, this won't have an impact on the normal operation of the VM.
- Once you finish the import process, start the VM and you will see the following message, which shows the IP address assigned to TheHive (it is configured to use a DHCP address, so you will see a different IP address in every case):
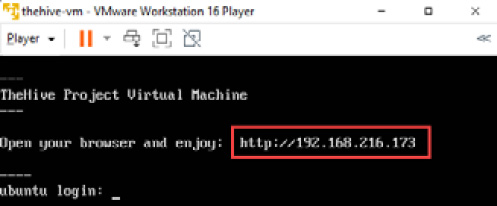
Figure 10.4 – TheHive VM initialized
You can connect to the TheHive dashboard from any browser to the IP address that appears on the virtual machine. You can configure different services and components of TheHive from the command line.
Now, let's review the architecture of TheHive and the functionalities of its components.
Understanding the TheHive architecture
TheHive is a scalable and modular incident management platform that can be installed in a standalone or a cluster distributed environment. Before the installation in a production environment, is very important to define the architecture according to the capacity needs of your organization.
For this module, we will use a preinstalled version of TheHive in a VM to focus specifically on the functionality and capacities of the product. You can consult the project's documentation for installation and configuration at the following link: https://docs.thehive-project.org/thehive/.
The incident management platform is composed of three components:
- TheHive: The incident and case management platform
- Cortex: An engine for observable analysis and response using threat intelligence
- TheHive4: A Python API client to expand the functionality to external sources
The architecture of TheHive and Cortex is developed as follows:
- AngularJS and Bootstrap for the frontend
- Scala, Akka, and Play on the backend
- Elasticsearch for the storage
- Python-based analyzers
- REST APIs for communication
The following figure shows the interaction between the different components of TheHive:
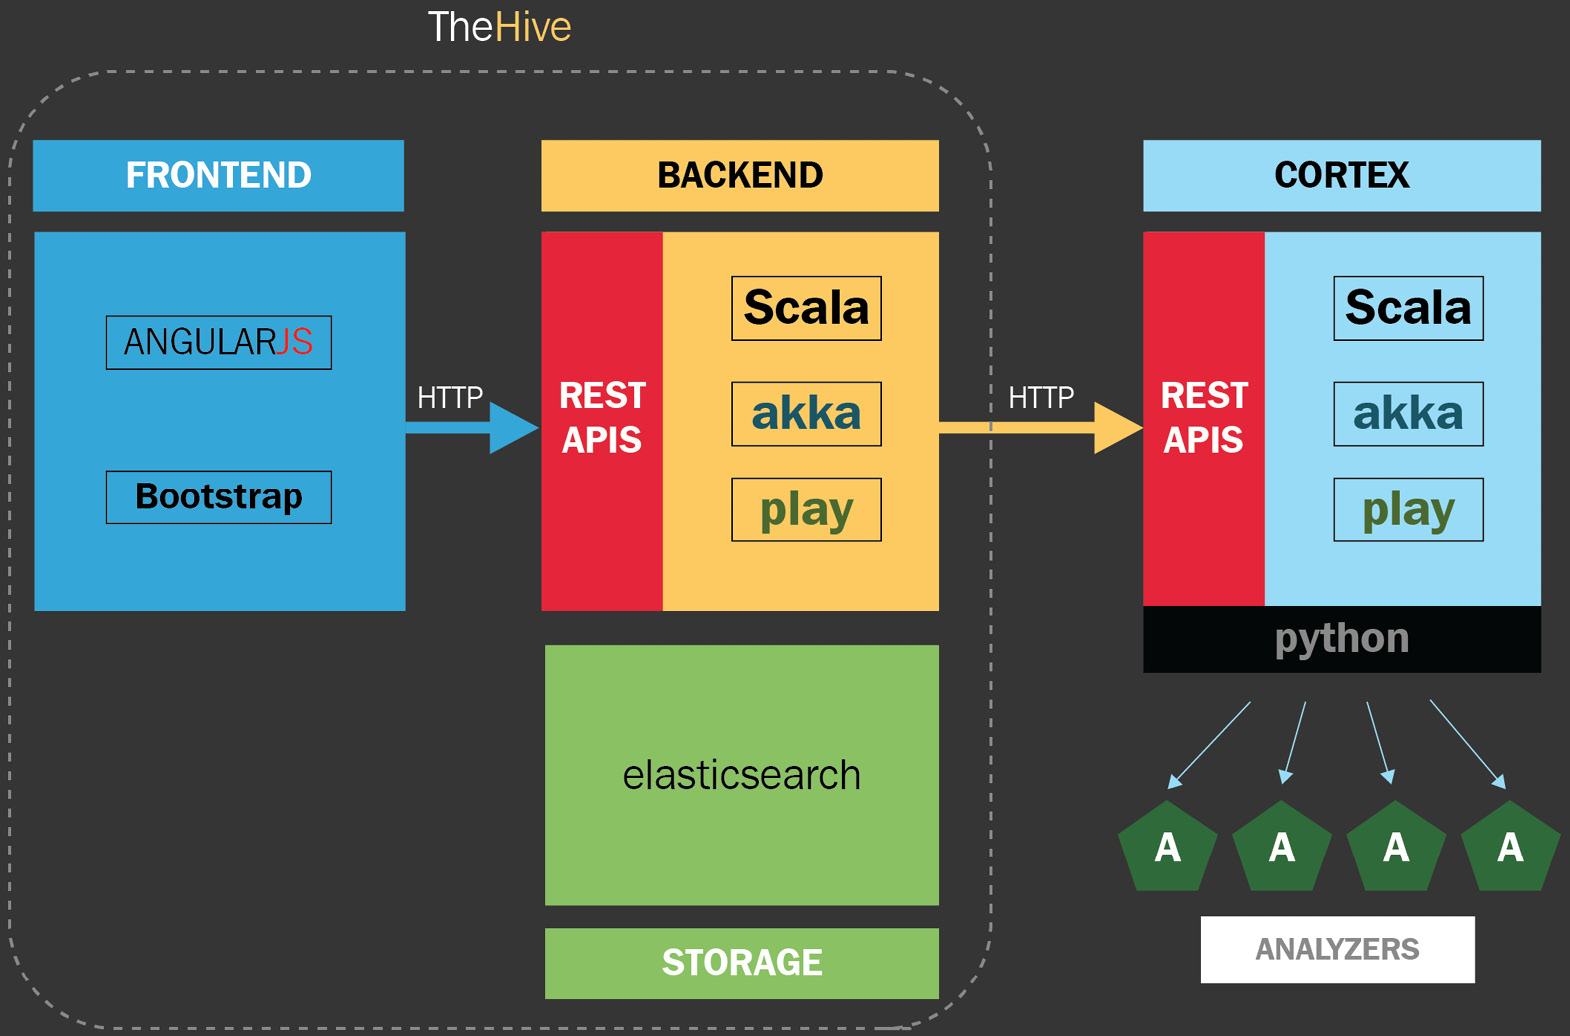
Figure 10.5 – TheHive architecture
The hardware requirements of TheHive and its components will depend, among other things, on the volume of data that is required to be processed. It is recommended to perform a diagnosis to consider the variables of each environment.
Setting up TheHive and creating cases
The first thing you should do before using TheHive is to customize the settings of the VM. To do this, provide the credentials that are configured by default using the following steps:
- To connect to TheHive, you just need to navigate from your computer using a web browser to the same IP address assigned to your VM before. For instance, in this case, the IP assigned for me is http://192.168.216.173/.
You will see the following interface where you can connect to the platform using the predefined user account and passwords and review the documentation about how to use TheHive virtual machine.
Click on the link to open TheHive under the Quick connect section, as shown in the following screenshot:

Figure 10.6 – TheHive Project Virtual Machine main page
- Use the default credentials to log in as administrator – in this case, [email protected]/secret – and click the Sign In button, as shown in the following figure:

Figure 10.7 – TheHive login web page
The virtual machine comes with two organizations configured by default, admin and demo. The admin organization is prepared to configure the platform with special administrative privileges, while, on the other hand, the demo organization is preconfigured as an organization for testing purposes.
- We are going to create a new organization, as shown in the following screenshot:
- On TheHive's main dashboard, click on the New Organisation button.
- On the opened dialog window, write the name and description of your organization. In this case, write the following parameters:
- Name: IR Labs
- Description: Practice Lab Organisation
Click the Save button

Figure 10.8 – Creating a new organization
- Once you create the new organization, it will appear on the bottom-left side of the Organisations panel. To configure the parameters for the new organization, click the Configure button, as shown in the following screenshot:

Figure 10.9 – Organization configuration
You can create the users that will operate the server and assign them a specific profile:
- admin: Can manage all the organization objects and users but can't create cases
- analyst: Can create and manage cases and the related objects as tasks, observables, and TTPs
- read-only: Can't create or modify objects and cases
- To add a new user, click on the Create New User button. Fill in the following parameters:
- Login: [email protected]
- Full Name: Investigator
- Profile: analyst
Now, click the Save user button.
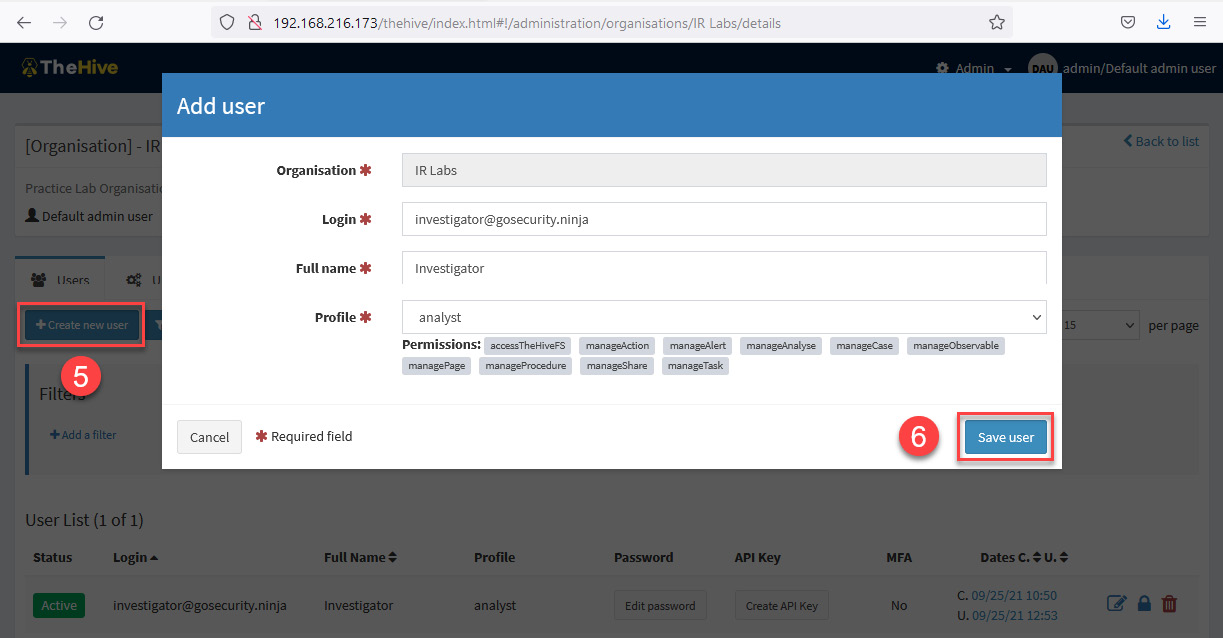
Figure 10.10 – Add user dialog box
Once you've created the new user, it will appear on the Organization details panel.
- Change the password by clicking below the Password field, write the password L34rn1ng!, and click the green checkmark icon to save it (you can also assign an API Key if you want, following the same procedure).
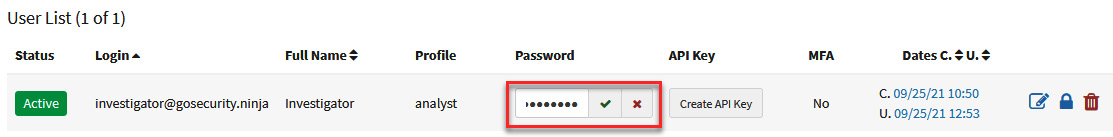
Figure 10.11 – Creating a new password
There are more platform configurations that can be done here, but in this case, we will only make these changes for the time being.
- To log out from the organization configuration panel, just click on the user profile button, at the upper right, and then click the Logout button, as shown in the following screenshot:
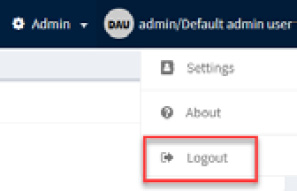
Figure 10.12 – Logging out of the organisation configuration panel
Now that we have created a new organization and added a new user, it's time to work with incident response cases.
Creating and managing cases
Incident response cases are the space where you can manage security incidents. Here, you can create cases in several ways:
- Manually
- Automatized
- Based on playbooks
In this part, we will cover the creation of new cases manually.
Log in to the main page of TheHive using the credentials of the new user created:
- Username: [email protected]
- Password: L34rn1ng!
When starting the session, you will see the main panel with the list of added cases. In this case, none will appear because you have just created the organization, as shown in the following screenshot:
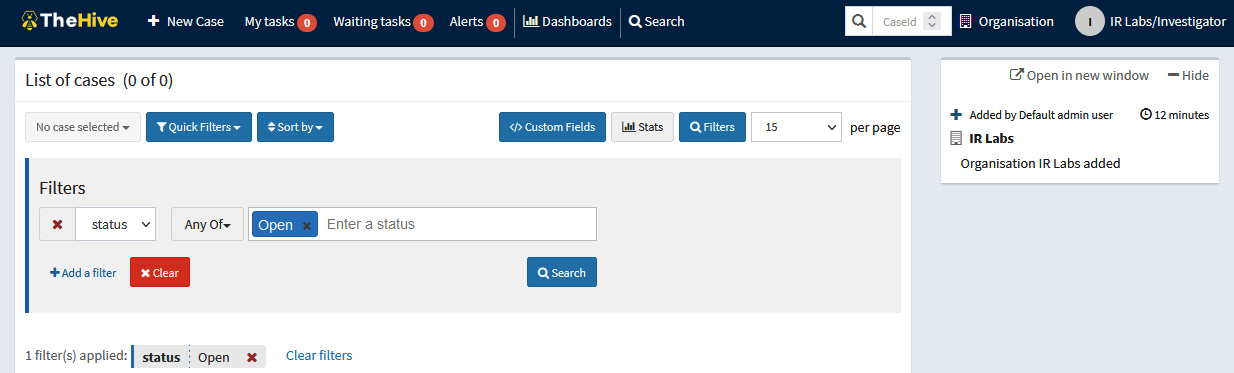
Figure 10.13 – List of cases on the main page
The scenario for our case is that the Security Operation Center SOC detected a new ransomware attack in one of the branches around the world. You will open a new case to start with the procedures related to this security incident.
To create a new case for this incident, follow these steps:
- Click on the + New Case button at the top left of the cases panel.
- In the Create a new case window, fill in the fields using the following parameters under the Case details section:
- Title: Ransomware Incident
- Severity: High (H)
- TLP: High (RED) – This parameter means Traffic Light Protocol, and indicates the restriction level to share information with others.
- PAP: High (RED) – This parameter means Permissible Actions Protocol and indicates to the analyst how to use IoCs in investigating the alert.
- Tags: ransomware, malware, databreach
- Description: Incident Response case related to a Ransomware attack and possible data breach.
- Click the + Create case button.
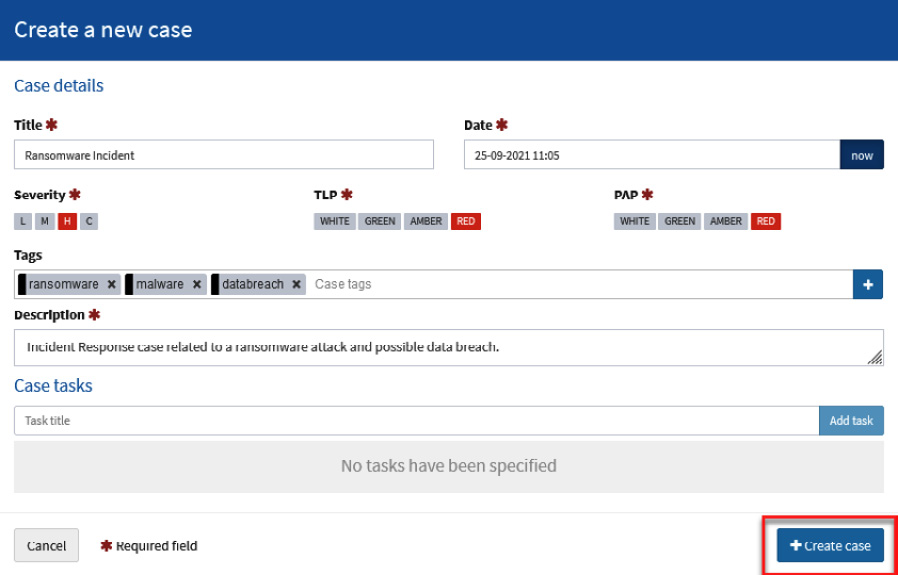
Figure 10.14 – Create a new case dialog box
You will see the details of the new case created, as shown in the following screenshot:

Figure 10.15 – General details of a case
Now that the case is created, the next step is to add the tasks or procedures based on the incident response plan or playbook related to ransomware incidents.
Adding and assigning tasks
In this case, we will add a task related to the process to do the triage and collect artifacts of the compromised systems:
- In the Tasks section, click the +Add Task button, as shown in the following screenshot:
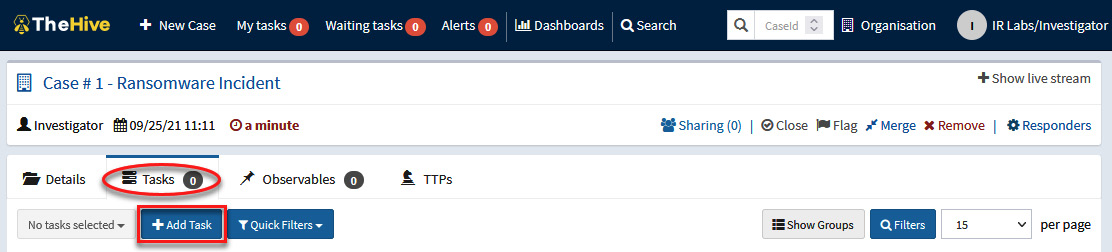
Figure 10.16 – Adding a new task
- Under the List of tasks section, fill in the following parameters:
- Group task: Detection and Analysis
- Task: Triage and artifacts collection
Click the green checkmark button to save the task:
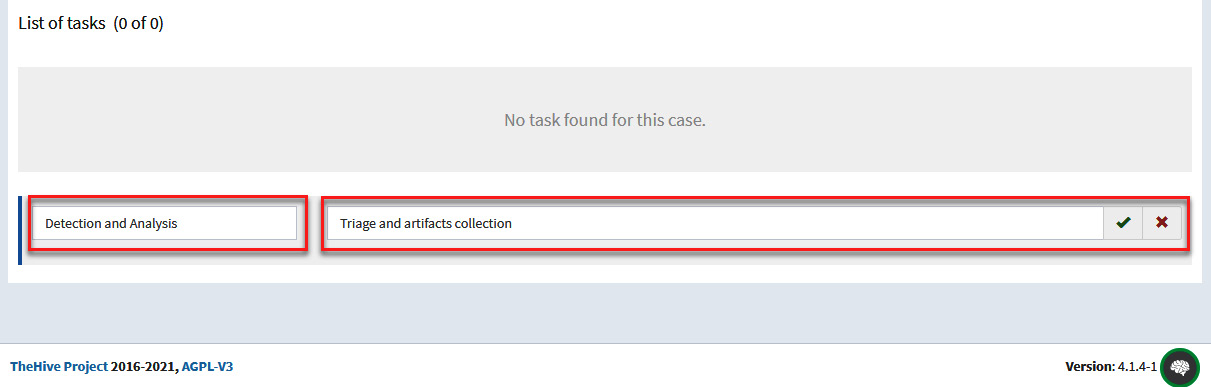
Figure 10.17 – Creating a new task
- At the bottom of the page, you will see the new task created and you can assign it to who will be responsible for completing it. To do this, click on the button under the Assignee parameter and select IR Labs/Investigator, which corresponds to the organization and users you created, as shown in the following screenshot:
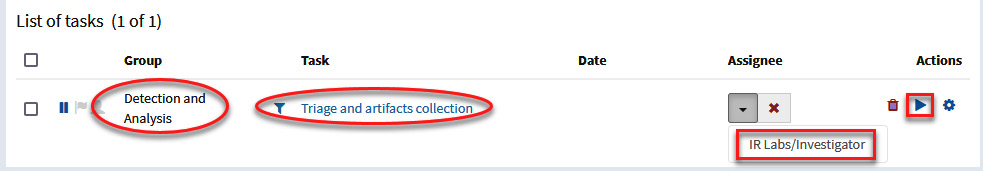
Figure 10.18 – Assigning tasks
You added a new task and assigned it to the user Investigator. This user will now be able to start working and documenting everything related to that activity.
To start working on this task, you need to do the following:
- Navigate to the Tasks panel on the toolbar at the top.
- Select the task to work on.
- Click on the + Add new task log button.

Figure 10.19 – Adding task logs
You will see the Tasks logs panel, where you can register the information related to this task.
- Under the Task logs section, write the following details:
Collecting memory dumps and forensic artifacts from the following computers:
HR-034-SP
AD-010-BA
RD-052-SP
MG-045-NY
- Click the Add log button.
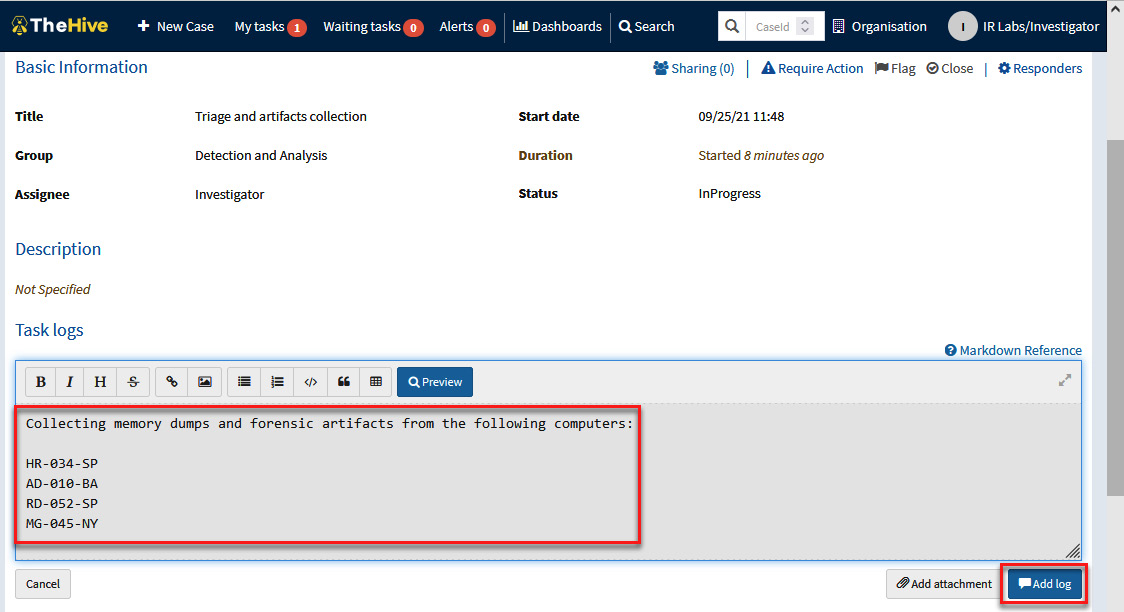
Figure 10.20 – Providing details regarding a task
You can add as many log entries as necessary and can add not just text; you can also add files and images when working on this task.
In the next part, you will learn how to create a case based on an incident response playbook.
Creating playbook case templates
TheHive allows you to create case templates based on incident response playbooks. In Chapter 9, Creating Incident Response Plans and Playbooks, we mentioned Austin Songer's project, https://github.com/austinsonger/Incident-Playbook, about creating incident response playbooks and how they can be mapped with the MITRE ATT&CK framework.
For our practical exercise, we will use the playbook related to ransomware incidents documented at https://github.com/austinsonger/Incident-Playbook/blob/main/Playbooks/MITRE-ATTACK/Impact/T1486-Data-Encrypted-for-Impact-Ransomware.md, assuming that the attack has already materialized, partially or totally.
Note
The best strategy is to identify and respond to attacks at an early stage, but in the same way, we must assume that in some cases, the attacker could evade our detection and protection systems. That's why it's important to create incident response playbooks for the different phases of an attack.
To create case templates based on incident response playbooks on TheHive, you must be signed in with org-admin privileges (you can see more details about roles and permissions here: https://docs.thehive-project.org/thehive/user-guides/organisation-managers/organisations-users-sharing/).
In this case, we will use one of the pre-configured users of TheHive virtual machine:
- Log out of the previous session if necessary.
- On the main page of TheHive, sign in using the following credentials:
- Login: [email protected]
- Password: thehive1234
This is shown in the following figure:
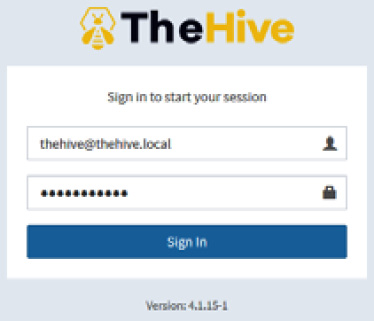
Figure 10.21 – Signing in to TheHive
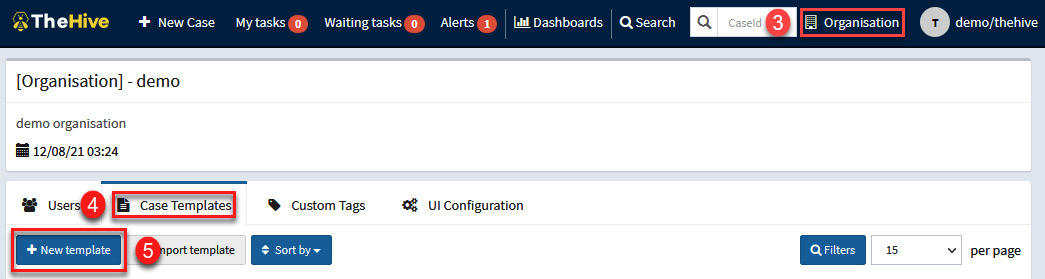
Figure 10.22 – Creating a new case template
- In the Create a new case window, fill in the fields using the following parameters under the Case Details section:
- Template name: Ransomware Playbook
- Display name: Ransomware attack
- Title prefix: 001
- Severity: High (H)
- TLP: High (RED) – This parameter means Traffic Light Protocol, and indicates the restriction level to share information with others
- PAP: High (RED) – This parameter means Permissible Actions Protocol, and indicates to the analyst how to use IoCs in investigating the alert.
- Tags: ransomware, malware
- Title prefix: Playbook for Ransomware Attacks
Click on the Save template button. The complete information is shown in the following screenshot:
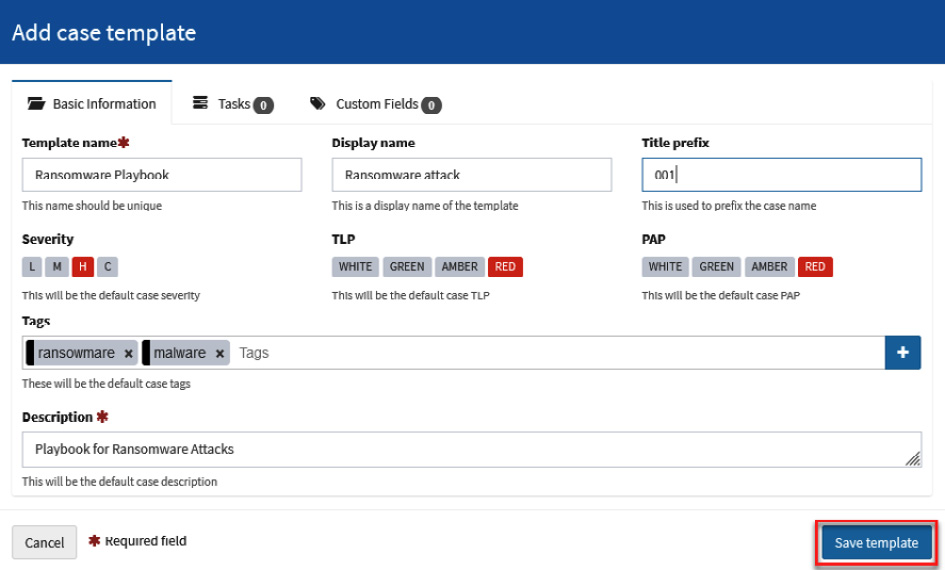
Figure 10.23 – Adding the details to a case template
Once we've created the template, we will add the tasks that we previously created in the ransomware incident response playbook.
- Select the Tasks tab and click on the Add task button, as shown in the following screenshot:
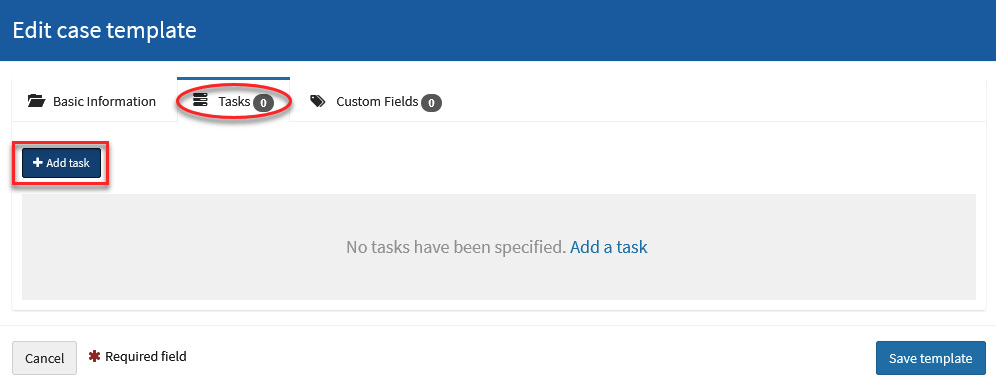
Figure 10.24 – Adding tasks to a case template
- In the new Add task dialog box, fill in the fields using the following parameters:
- Task title: Determine the type of ransomware (i.e., what is the family, variant, or flavor?)
- Task group: Investigate
- Task description:
1.Find any related messages. Check:
- graphical user interfaces (GUIs) for the malware itself
- text or html files, sometimes opened automatically after encryption
- image files, often as wallpaper on infected systems
- contact emails in encrypted file extensions
- pop-ups after trying to open an encrypted file
- voice messages
2. Analyze the messages looking for clues to the ransomware type:
- ransomware name
- language, structure, phrases, artwork
- contact email
- Assignee: Click on the list and select the thehive user.
Click on the Add task button.
The complete information is shown in the following screenshot:
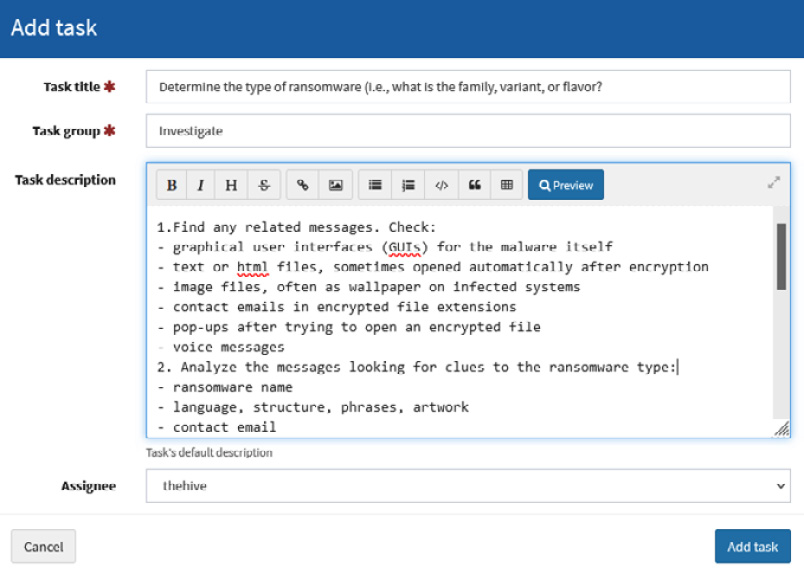
Figure 10.25 – Adding the task details
- Once you've saved the new task, you will be returned to the Edit case template dialog box, and you will be able to observe the task you created, as you can see in the following screenshot:

Figure 10.26 – Reviewing the added task
- Add the rest of the tasks of the Investigation section from the Playbook: Ransomware https://github.com/austinsonger/Incident-Playbook/blob/main/Playbooks/MITRE-ATTACK/Impact/T1486-Data-Encrypted-for-Impact-Ransomware.md
- 2. Determine the scope
- 3. Assess the impact
- 4. Find the infection vector
- Once you have finished adding the tasks that are defined in the playbook, click on the Save template button.
Once we've created the case template based on the incident response playbook, we can use it when creating a new case.
Let's use this template now by creating a new incident response case about a ransomware incident.
- Click on the New Case button in the main menu, as shown in the following screenshot:
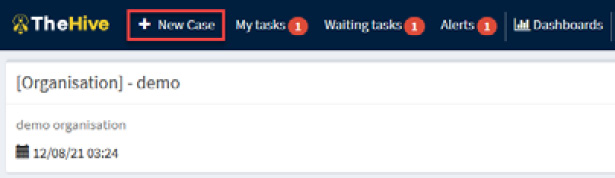
Figure 10.27 – Creating a new case
In the Create new Case dialog box, you will see the template recently created. If you do not see it, you can refresh the web page to clear the cache and load the new information.
- Click on the Ransomware attack template under the Select a template section, as shown in the following figure:
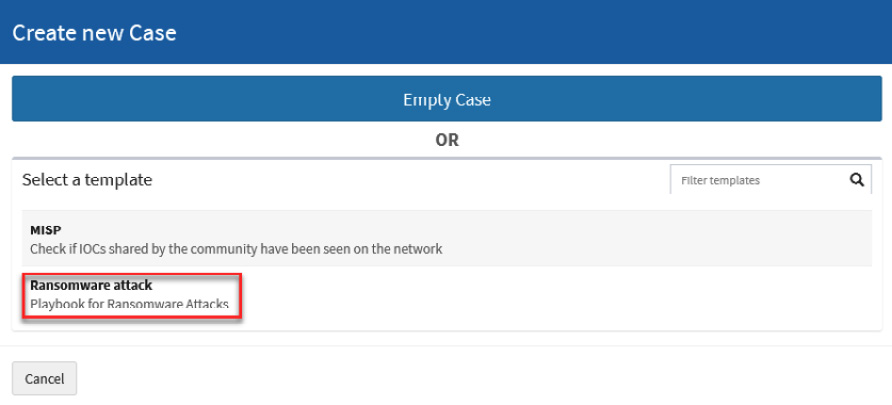
Figure 10.28 – Selecting a template to create the new case
In the Create a new case dialog box, you will see the information previously captured when you created the template, as well as the added tasks of the playbook. You can update or modify that information if necessary.
- Fill in the Title field with the case name Ransomware related security incident, as shown in the following screenshot:

Figure 10.29 – Adding details to the new case template
- Click on the Create case button.
- Click on the TheHive main button and you will see the new case under List of cases, as shown in the following screenshot:
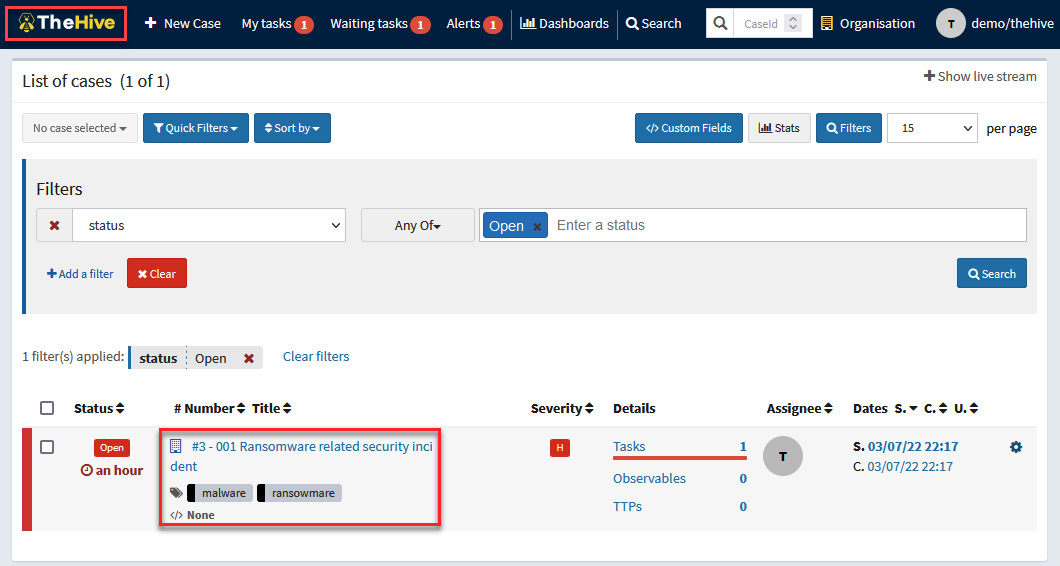
Figure 10.30 – Selecting the created case
You can now manage the case, selecting and assigning tasks to the incident responders and collaborators.
- To start managing the case, click on the 001 Ransomware related security incident case.
- Click on the Tasks tab.
Under this tab, you will see the list of tasks based on the ransomware template created previously. Here, you can edit, add, or delete tasks according to the context of this case or assign the activities as appropriate, as shown in the following screenshot:

Figure 10.31 – Managing the case tasks
The best practice is to create incident response playbooks, as you learned to do in Chapter 9, Creating Incident Response Plans and Playbooks, and then integrate them into incident management platforms to act quickly and efficiently the moment they occur.
In the next part, you will learn how to add indicators of compromise related to a particular incident.
Adding observables
When you are working on an incident, it's very important to include information about Indicators of Compromise (IoCs) or Indicators of Attack (IoAs) as they are found. Take these steps to do this:
- Navigate to the Observables panel.
- Click the + Add observable(s) button.
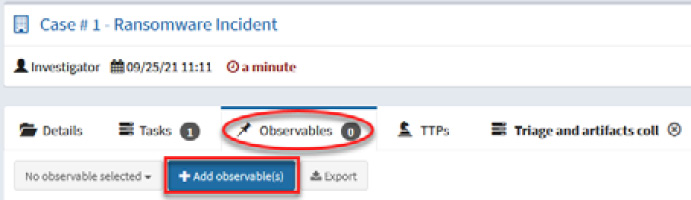
Figure 10.32 – Adding observables
This will open the Create new observable(s) window. Here you can add the details for any IoC found.
Fill in the fields with the following parameters:
- Type: hash
- Value: 561cffbaba71a6e8cc1cdceda990ead4
- TLP: RED
- Is IOC: Checked
- Tags: malware, ransomware, hash
- Description: Suspicious executable
Click the + Create observable(s) button.

Figure 10.33 – Providing observables' details
- The term observable is related to IoC or IoA. The idea here is to have a central repository where analysts can share intelligence and make it actionable.
This is a powerful feature of TheHive because you can use Cortex running different analyzers. We are going to review this in more detail in the following section, where we will cover the functionality of Cortex.
To get intelligence provided from Cortex, you just need to run the preconfigured analyzers. The analyzers are tools that connect to external sources of intelligence through APIs.
Navigate to the Observables section.
- Select the observable that you want to analyze – in this case, the hash that we added previously.
- Click the 1 selected observable button.
- Click on the Run analyzers button, as shown in the following screenshot:
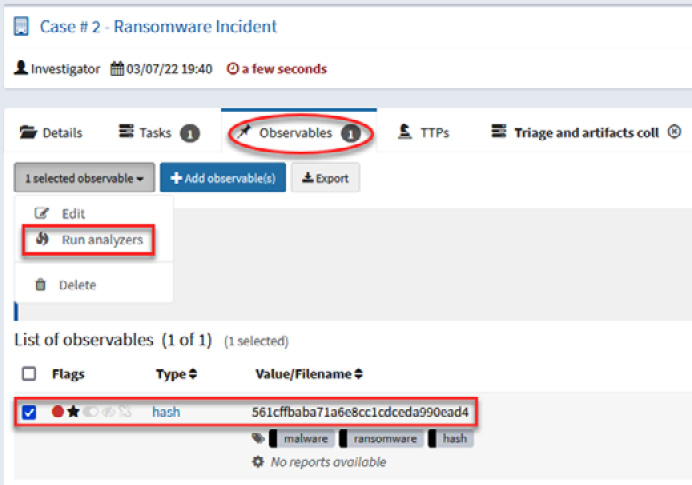
Figure 10.34 – Running analyzers for an observable
- The Analyzer observable(s) window will open, and the external intelligence sources will be displayed. Depending on the observable, different sources of information may appear.
- Select the sources from which you want to get intelligence.
- Click the Run selected analyzers button.
- In this case, you can select the following intelligence sources: Maltiverse_Report_1_0, TeamCymruMHR_1_0, and CIRCLHashlookup_1_0, as shown in the following screenshot:

Figure 10.35 – Selecting specific analyzers
Now, wait a few moments for the analyzers to look for the information. The results will appear at the bottom of the observable in blue labels, as shown in the following screenshot:
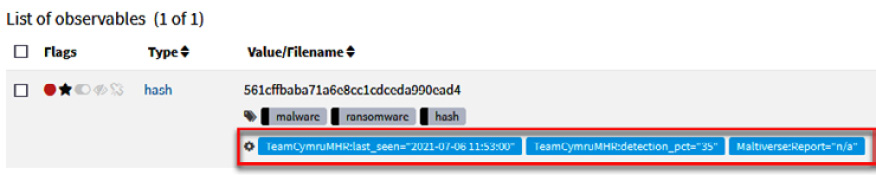
Figure 10.36 – Results of running the analysis process
If no matches are found with those indicators, you can try with other intelligence sources.
If this indicator was seen before, you will view the context details and know if it is related to a campaign or known malicious actors. In this case, this hash is related to a malware sample, so we will get more details about this threat.
- Click on the Maltiverse:Report="n/a" tag and you will see the details of the results of this analysis, as shown in the following screenshot:
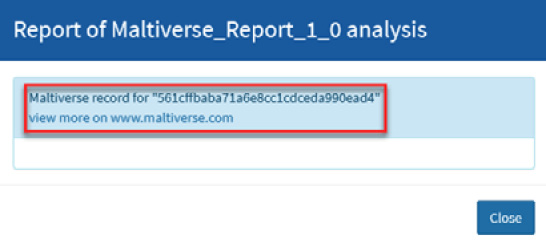
Figure 10.37 – Reviewing the analysis details
- Copy the hash value to the clipboard and open a new tab on your web browser to navigate to the maltiverse web page: https://www.maltiverse.com/.
- Paste the hash value of the malicious file into the Search engine textbox and then click on the Search button, as shown in the following screenshot:

Figure 10.38 – Investigating an Indicator of Compromise (IoC)
On the Search result panel, you will see the name(s) of the file along with additional information, as shown in the following screenshot:
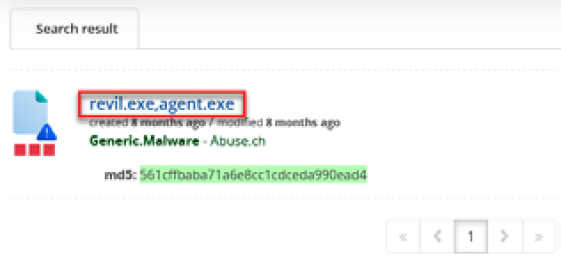
Figure 10.39 – Reviewing the details of the results
- Click on the name of the file(s).
You will see additional information regarding this malware, for instance, the number of antivirus detections, IDS alerts, processes, HTTP events, contacted hosts, and DNS requests. Scroll down the web page to see the antivirus positives, as shown in the following screenshot:
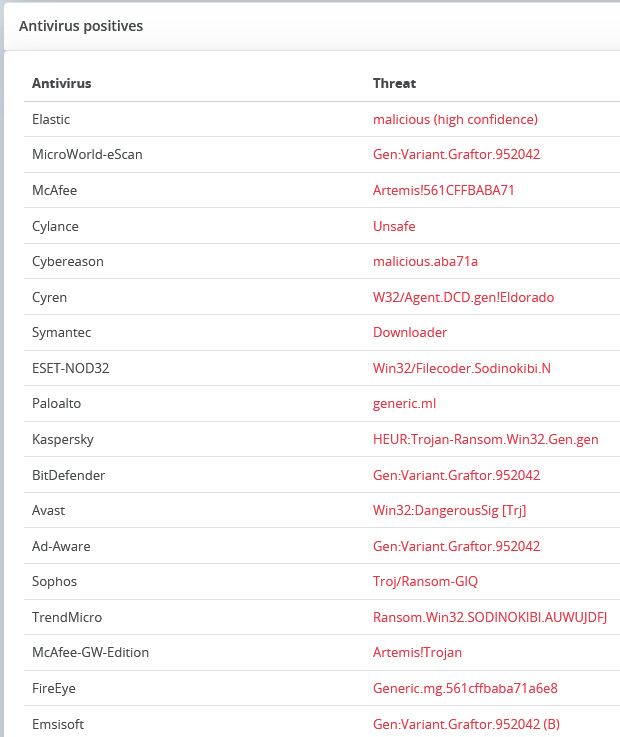
Figure 10.40 – Reviewing the antivirus detections
As you can see, there are detections referencing the threat as belonging to the Sodinokibi Ransomware family. Additionally, you can also search other intelligence sources, such as VirusTotal (https://www.virustotal.com/) and VirusBay (https://www.virusbay.io/).
In a cybersecurity incident, you will find different IoCs, and in the same way as you did with the hash value, you can add observables and analyze them as URLs, IP addresses, filenames, or Windows Registry keys, among other things.
At this point, we have valuable information that will allow us to search for this IoC on other devices.
However, in a cybersecurity incident, the context is also very important. In Chapter 6, Understanding the Cyber Kill Chain and the MITRE ATT&CK Framework, you became familiar with the MITRE ATT&CK framework. In the next part, you will learn how to document potential malicious behaviors (TTPs) in TheHive.
Documenting MITRE ATT&CK TTPs in TheHive
Another useful feature included in this version of TheHive is the integration with MITRE ATT&CK and the capability to add TTPs.
When you identify an IoA, you can directly map it with its corresponding technique/sub technique.
To add a new TTP, follow these steps:
- Navigate to the TTPs panel at the top of the case toolbar.
- Click the + Add TTP button.

Figure 10.41 – Adding MITRE ATT&CK TTPs
- In the Add Tactic, Technique and Procedure window, complete the fields with the following parameters:
- Tactic: Execution
- Sub Technique: T1059.001 – Command and Scripting Interpreter: PowerShell
Click on the Add TTP button.
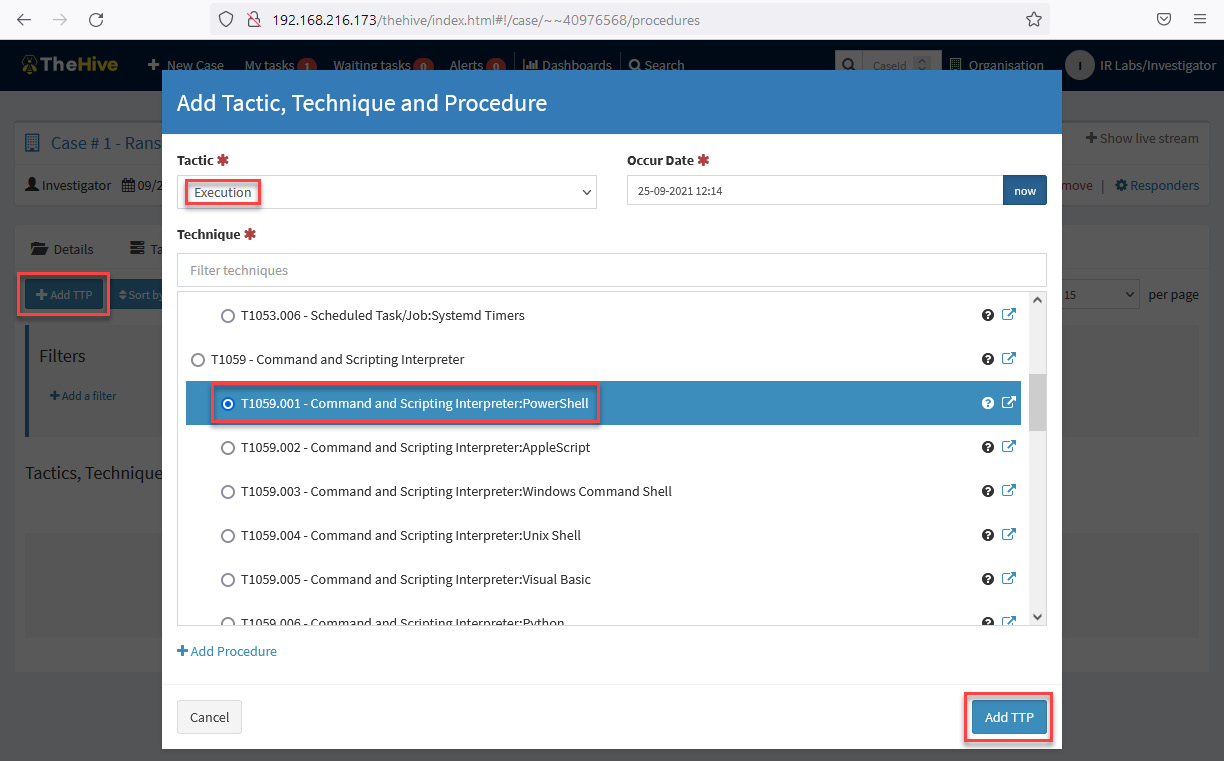
Figure 10.42 – Add Tactic, Technique and Procedure dialog box
At this point, you initiated a new security incident case and performed the following activities:
- You created a new case related to a security incident.
- You created a new task and assigned it to an analyst.
- You created a new entry for an observable and ran an analysis for intelligence information.
- You added a new TTP entry associated with the behavior of the attacker.
To view the dashboard with the key information about your cases, do the following:
- Click on the TheHive logo at the top left of the main panel.
- Click on the Stats button at the top right.

Figure 10.43 – TheHive case main dashboard
You will see information as shown in the preceding screenshot:
- Case by Status
- Case by Resolution
- Categories of cases by tag
- The list of cases with details
You can customize this dashboard according to your preferences and needs if you log in as an organization administrator.
In the following section, you will learn in more detail how to configure the main functions of Cortex, the intelligence component of TheHive.
Integrating intelligence with Cortex
As was mentioned at the beginning of the chapter, Cortex is a powerful engine to analyze observables and get intelligence from external sources.
The integration of TheHive and Cortex allows you to get threat intelligence information from different sources without having to change to different platforms. As you learned in the previous part, you only need to register an observable and select the analyzers where the information will be searched.
Also, you can integrate Cortex with other threat intelligence platforms such as the Malware Information Sharing Project (MISP). The following diagram shows the way this integration can be done:
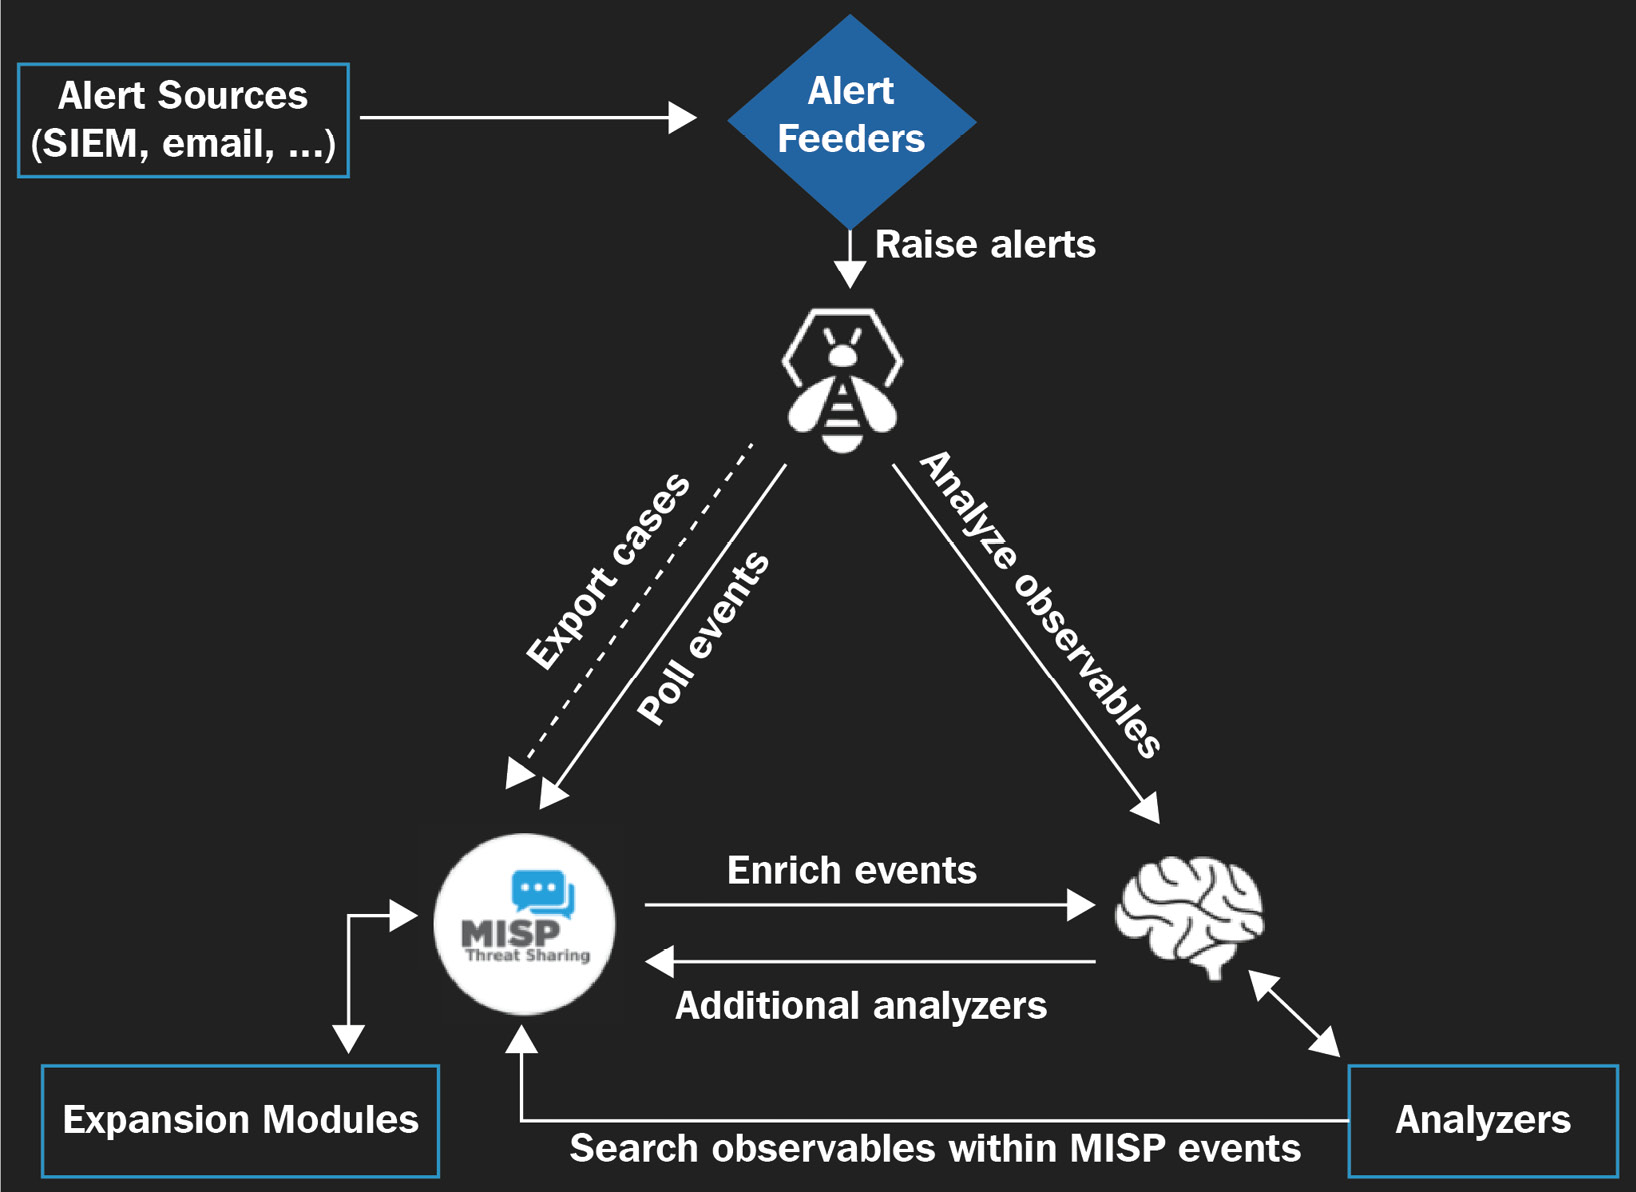
Figure 10.44 – TheHive integration with Cortex and MISP
It is also possible to initiate cases in an automated way by receiving alerts from different sources such as SIEMs and emails. This feature will be seen in the next chapter.
Configuring the analyzers
One of the features that you can configure in Cortex is the analyzers. The steps to configure analyzers are as follows:
- Log in to the Cortex portal using the default orgadmin credentials, thehive/thehive1234, provided with the VM, as shown in the following screenshot:

Figure 10.45 – Cortex login page
- On the main panel, you will see Jobs History, which shows the most recent analysis processed from TheHive or directly here and the results of those processes, as shown in the following screenshot:

Figure 10.46 – Cortex Jobs History main page
Here, you can filter the analysis by Data Types, Job Type, and Analyzers, search by Observable, and delete a specific job.
- Now, we will review the configuration of the analyzers included with Cortex. Click on the Analyzers button on the toolbar at the top of the main panel. You will see the list of analyzers enabled for this organization, as shown in the following screenshot:
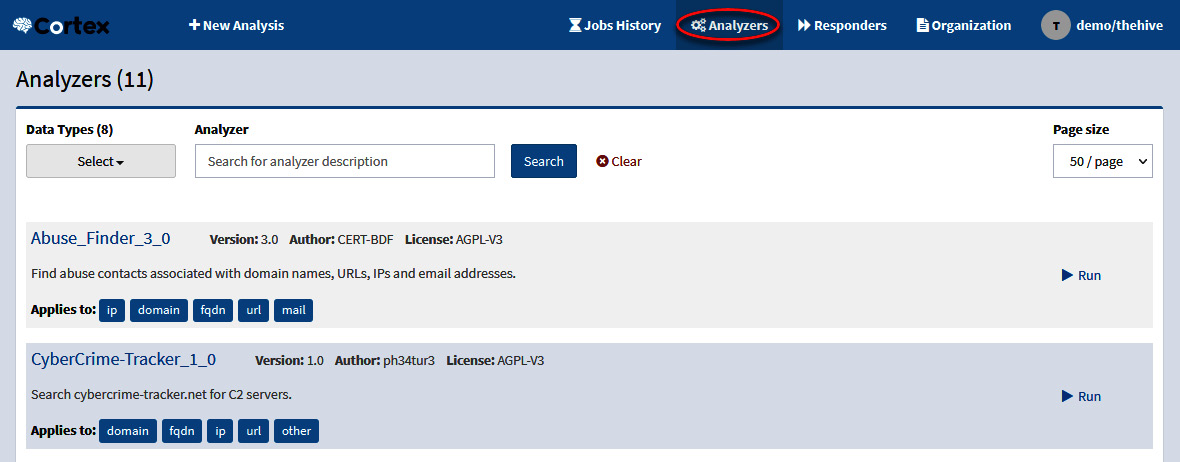
Figure 10.47 – Cortext-enabled Analyzers panel
- If you want to enable or disable analyzers, you need to log off and then log on again by using the following administrator credentials: admin/thehive1234.
- On the toolbar, select the Organization button.
- Select the Analyzers panel.
Under the Analyzer section, you will see the list of analyzers, and on the right, the option to enable or disable them.
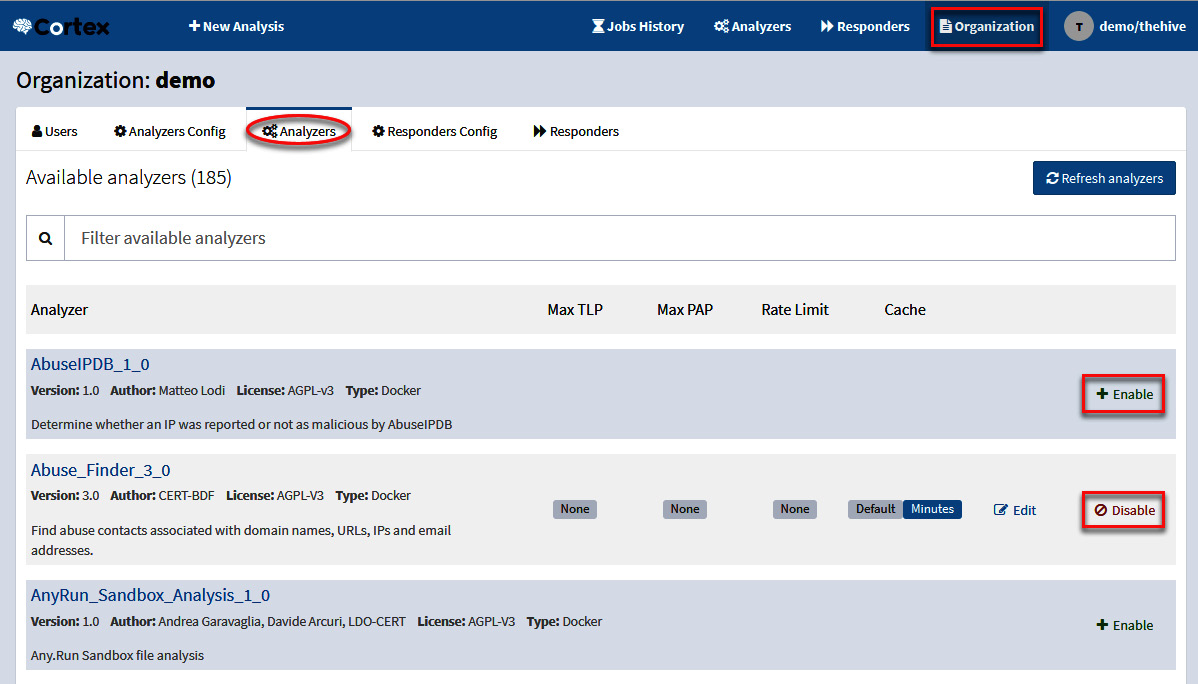
Figure 10.48 – Cortex Analyzers configuration panel
It's important to mention that some analyzers will require an API key, so before you can enable them, you will need to provide the required information.
Note
You can integrate additional analyzers such as VirusTotal, DomainTools, or many others into TheHive. Read the documentation in this Cortex GitHub repository: https://github.com/TheHive-Project/CortexDocs.
Summary
In this chapter, you learned the importance of an incident response platform as a core component of incident response capabilities.
Also, you learned to set up an instance of the TheHive incident management platform and how to generate new cases, create and assign tasks to analysts, collect observables, and obtain external intelligence through Cortex.
At the time of writing this chapter, an important change had been announced for version 5 of TheHive's licensing model. The new version will no longer be under the AGPL v3 license (this does not apply to the Cortex intelligence tool), but there will be a Free Community version that will keep the main incident management capabilities. Version 4.4-1 will be supported until December 31, 2022.
As I mentioned earlier, and as part of my commitment to keeping the content current and up to date with the tools, I will include the changes applicable to the new version of this incident management platform within the additional material of this chapter available on GitHub.
In the next chapter, you will learn how to integrate multiple technologies to automatize incident response procedures.
Further reading
- TheHive project documentation: https://docs.thehive-project.org/thehive/
- TheHive turns 5 and adopts a model shaped for the future: https://medium.com/strangebee-announcements/thehive-turns-5-and-adopts-a-model-shaped-for-the-future-95f908719c31
- TheHive, Cortex, and MISP: How They All Fit Together: https://blog.thehive-project.org/2017/06/19/thehive-cortex-and-misp-how-they-all-fit-together/
- Incident Playbook: https://github.com/austinsonger/Incident-Playbook
- Cortex documentation: https://github.com/TheHive-Project/CortexDocs