5
Equipment Efficiency: Performance and Motion Study
In this chapter we will examine the second equipment efficiency indicator based on two factors: equipment performance losses owing to minor stoppages (usually not registered) and equipment performance reduction caused by equipment component deterioration and/or wear. In Chap. 7 we will study equipment availability (setup reduction) and quality related to startup.
Small breakdowns or device (fixture and tooling) holdups are responsible for these machine stoppages. In other cases, an improper adjustment or interaction between the worker and the machine cycle also can create problems.
Time and motion study allows one to optimize the relationship between the worker and the machine, as well as to investigate whether the worker can tend more than one machine in those cases where the machine cycle is significantly longer than the worker cycle.
The main tools presented in this chapter are worker-machine and machine-machine diagrams. These tools help us to study the relationship between the worker and machine cycles (or between machines), eliminating or reducing idle time and optimizing the working cycle.
MOTION STUDY
Motion study (also known as movements study) is defined as the methodology whose goal is to decrease the amount of work (shorter working cycle) by improving the existing work methods and layout. The result of a well-conducted motion study is that idle times are decreased or eliminated completely, i.e., those nonproductive activity times where non-value-added activities (walking, searching for, etc.) are eliminated from the process.
If this methodology is applied to the machine setup process, it could be considered a single-minute exchange of dies (SMED) tool, as will be shown in Chap. 7. Motion study is included in the 20 keys of lean manufacturing as key number 6 (Fig. 5.1). In addition, this tool improves the overall equipment efficiency ratio (Fig. 5.2).
Time study, as explained in Chap. 3, is one of the first steps in a motion study because in most of the cases it will be necessary to quantify the current standard as well as to document any time savings. In addition, it is necessary to have available some approximate times in order to carry out the analysis.
In a motion study, alternate approaches (methods) to performing a production operation are proposed and then analyzed. The new procedure at first may seem worse than the current method, but this can be due to the lack of familiarity and the change resistance of workers who are accustomed to a personal way of carrying out tasks. Shingo illustrates resistance to change with an explicit example of animal behavior. Shingo shows, as illustrated in Fig. 5.3, that a fish will not change its learned behavior of selecting a path through a previous obstacle to obtain food even if the obstacle is removed. The fish follows the same path instead of reducing the distance to its goal by going straight ahead. Although this is a simple example, change is usually met with resistance in much of our everyday activities.
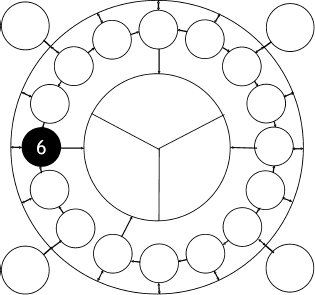
Figure 5.1. Location of motion study in a 20-keys diagram.

Figure 5.2. Motion study improves the performance rate.
Motion study also can be used to design a new work procedure (instead of improving an existing one) or to eliminate variability by changing the way a task is conducted. The importance of eliminating minor stoppages depends on the process, its complexity, its relationship with other upstream or downstream processes, and the takt and cycle times. For this reason, a 3-second cycle reduction can have a major impact on a process and should not be summarily rejected without further investigation. For a takt and equivalent cycle time of 2 minutes, a 3-second reduction in a day of 24 working hours would result in the production of 18 more parts. This, of course, assumes that this station will still have the maximum cycle time and that all saving go directly into the making of new product.
For a more complete treatment of the reduction and complete elimination of minor production stoppages, the reader is referred to the Recommended Readings at the end of this chapter. For example, Kikuo Suehiro discusses methodologies for eliminating minor stoppages. These methodologies will not be presented further in this book.
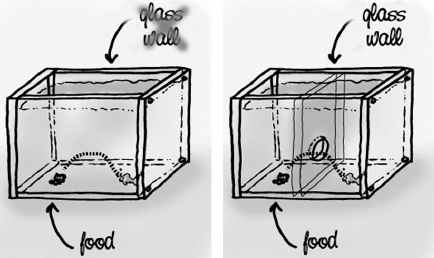
Figure 5.3. Habit change is the biggest obstacle to new method implementation.
THEORETICAL BASIS
Motion Economy Principles
In Chap. 3 we discussed the work of Frank and Gillian Gilbreth and how they defined the operation standard time by listing and measuring working elements. When analyzing a complete operation, they divided it in small tasks called therbligs (their last name in reverse). They regrouped and optimized these small tasks to form the complete operation in various ways.
The principles of motion economy are the result of their diligent work, and these principles are still used. Thanks to their work, Frank was able to outperform younger bricklayers theoretically more qualified than him. Figures 5.4, 5.5, and 5.6 show that these principles of motion economy are simple rules that facilitate the proper design of operations. In each figure, the drawing of the left represents a nonefficient process.
For example, if a boiler is to be controlled manually so that it does not exceed a certain pressure, it is recommended to use analog displays with properly noted performance zones rather than digital ones (Fig. 5.7). Other examples make reference to the efficient use of other displays. It is recommended, for example, lateral movements be used instead of up-down movements.
It is important to distinguish the principles of motion economy (whose main objective is to increase productivity by means of improving the method of carrying out tasks) from other studies that analyze the best working conditions to increase productivity. For example, some studies have demonstrated that productivity increases when work is done under poor lighting conditions. It is not necessary to comment on the negative consequences that this situation would have on the worker motivation. Since Gilberth's studies, the human body has been analyzed in detail, and optimal working distances and work envelopes have been defined. For example, arms-sweeping areas have been fixed when the worker is seated or standing (Fig. 5.8).

Figure 5.4. Better to use symmetrical movements.

Figure 5.5. Better to split the weight.
Proper bookcase heights for storage are also known (Fig. 5.9). In this way, accidents can be avoided or reduced. In some cases, the hands can be let free by using feet to perform certain tasks (e.g., a foot activation pedal to close a vise). Predetermined time, which was studied in Chap. 3, was derived from these type of studies.
MOTION STUDY TOOLS
Value Analysis
This analysis focuses on worker movements and workplace layout. Applying the motion economy principles described earlier, several production tasks normally can be redesigned and improved. Some companies have an ergonomics department, where the operations performed in the plant are analyzed and improved routinely (Fig. 5.10).
As is shown in the following figures, important improvements in workplace layout and methods can be achieved, and unnecessary movements can be eliminated. As shown in Fig. 5.11, the only difference in the two activities is the location of the stop valve. The time required to activate the valve, as well as worker safety associated with closing or opening the valve, can be improved with a minimal change in the stop valve location. By analyzing body movements and improving equipment design, worker efficiency can be improved significantly.

Figure 5.6. Better sitting down.
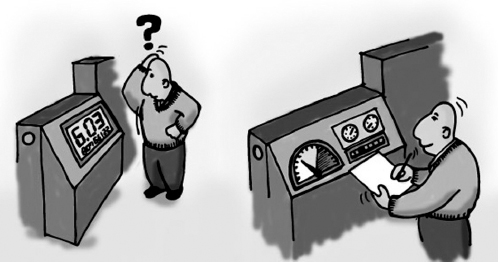
Figure 5.7. Better to use an analog control.
Figure 5.12 shows how to reduce the effort required by a worker if an electric or pneumatic hoist is installed. Even if the weight is not excessive, the number of times that this task is carried out during the day makes this process very harmful for the worker.
5W2H and 5-Why Methods
The 5W2H tool is very simple and consist on asking a group of questions about the task that is being analyzed. The tools and process are illustrated in the following and in Fig. 5.13.
Frequently, the response to change is about the same. Workers seldom see the need to think about another method for carrying out a task. This technique facilitates the analysis of operations that do not add value to the process.

Figure 5.8. Working distances for the arms.

Figure 5.9. Ideal classification for bookcase height.
Although some of the solutions seem trivial, it is routine to find situations such as the following examples that are far from reality. Figure 5.14 shows the old and the new methods to unload a truck.
Is it also useful to employ another method, called the 5-why method. This method consists of asking “Why?” up to 5 times in order to find the root of the problem. Asking yourself “Why?” 5 times helps to differentiate the symptoms that produce the problem from the real causes of the problem (the ones that needs to be eliminated).
Worker-Machine Diagram
In the situations described earlier in the value-analysis section, direct observation or the use of a camcorder is enough to document a problem for analysis. Sometimes, however, it is necessary to analyze a very fast or a very slow operation. In the first case, there are camcorders that are able to carry out up to 960 shots per second. As a result, unnecessary movements can be detected. For the second case, if the operation that needs to be studied takes up too much time, then slow camcorders (one shot per minute) also can be used, e.g., the ripening process of an apple.

Figure 5.10. Value analysis improves factory operations.

Figure 5.11. Reinstalling the stop valve. Which one looks best?
These two particular cases are rarely encountered in the industrial environment. It is more common to use production cycle analysis in which the machine and the worker interact with each other. In order to carry out a proper study, the operation should be divided into short but measurable tasks, separating machine and worker tasks.
The use of the worker-machine diagrams can facilitate this work significantly. These diagrams represent the task sequence that the worker carries out when interacting with the machine. Such diagrams also are used to analyze idle time and are considered an important improvement tool (Figs. 5.15 and 5.16).
In analyzing the worker idle time using the worker-machine diagram after the data are collected, the analyst is able to optimize the working cycle. By rearranging or modifying the worker-machine diagram, cycle time can be improved. As a result, the machine idle time decreases, as is shown in the new worker-machine diagram in Fig. 5.16.
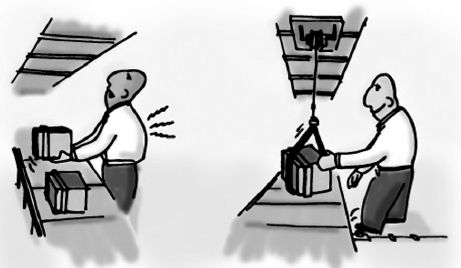
Figure 5.12. Pneumatic elevator reduces the needed effort.

Machine-Worker Ratio
If the task duration of the machine is very long, the worker could operate more than one machine. The right number of machines controlled by each worker is determined through the machine-worker ratio:
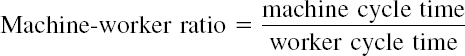
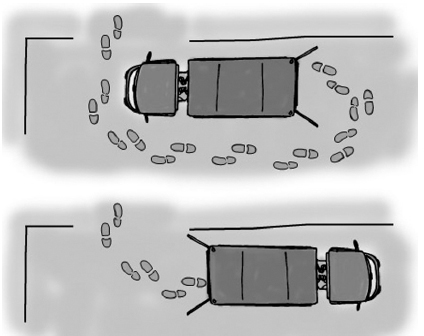
Figure 5.14. The answer to the “Why” question was, “We always do it like this.”

Figure 5.15. Worker-machine diagram of the initial situation.
In the machine cycle time, all those operations where the machine is operating or occupied are considered, even those shared with the worker. The same consideration must be taken into account when analyzing the worker cycle time. This includes the worker tasks and those tasks that affect the worker and the machine simultaneously.
The value of the ratio determines two possible situations for the right number of machines that a worker can handle simultaneously. For example, if the ratio is 7.6, the worker should be able to handle 7 or potentially even 8 machines. Determination of the manufacturing costs in each case will fix the number of machines the worker should handle.

Figure 5.16. Worker-machine diagram of the final situation.
For example, Fig. 5.17 shows a worker-machine diagram when a worker is handling two or three machines. The figure represents the working cycle from the start of the process until it reaches a steady state. The machine-worker ratio must be studied in this steady state.
If one observes transient activities (or temporary evolution until a steady state of operations that the worker and the machine carry out is achieved), the following important conclusions can be made:
- In the case where the worker handles two machines (diagram on the left in the figure), the working state is fixed by the machine, since the time that the worker needs to carry out all the operations on the two parts produced is shorter than the machine cycle. Therefore, the worker will wait 1 minute until the first machine finishes before he or she is able to load the next part.
- When the worker handles three machines (diagram on the right), the necessary time to carry out the operations on the three parts is longer than the machine cycle, and therefore, each machine will finish processing the part before the worker completes his or her activities. As a consequence, each machine will have to wait one minute until the worker finishes the work on the third part.
Machine-Machine Diagram
One-piece flow strategy presented in Chap. 2 pointed out the importance of achieving an ideal flow between working centers. In this case, the relationship between machine operations involved in the manufacturing process should be studied in depth.
The machine-machine diagram, similar to the worker-machine diagram, can be used to analyze product flow and the idle time in one working cycle when two or more machines are related.
In order to draw the diagram (always in a steady state), it is important to start with the machine that fixes the working cycle, because this machine does not have idle time. There is no methodology to complete the rest of the diagram, but the rest of the machines' operations can added in an attempt to minimize product lead time.
SUMMARY
In this chapter, some tools to facilitate motion study in a company have been presented. Worker-machine and machine-machine diagrams facilitate identification of idle time in working cycles. Thanks to the improvement methodologies presented, it is possible to eliminate those idle times. Therefore, the performance rate (included in the overall equipment efficiency ratio) increases.
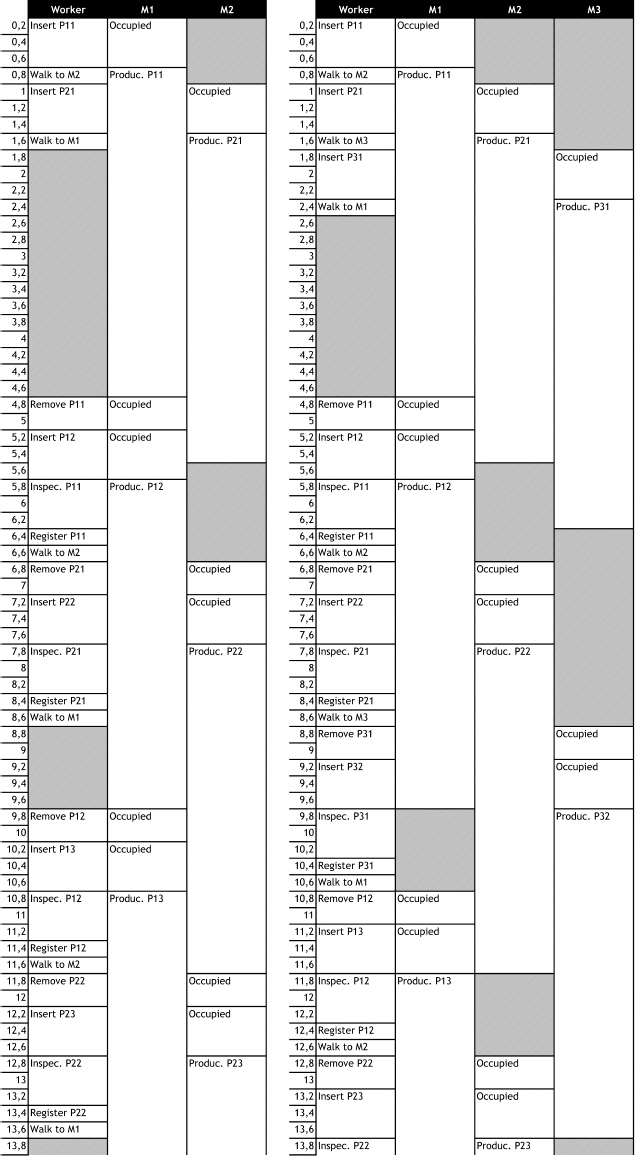
Figure 5.17. Machine-worker diagram from the beginning to the steady state.
RECOMMENDED READINGS
Kikuo Suehiro, Eliminating Minor Stoppages on Automated Lines. Pittsburgh, PA: Productivity Press, 1992.
Tomo Sugiyama, The Improvement Book: Creating the Problem-Free Workplace. Pittsburgh, PA: Productivity Press, 1989.