

Performance considerations
As you prepare to replace your existing coupling links with InfiniBand links, you need to understand the relative performance of the different link types. This is especially important for installations that are currently using ICB4 links, because those link types are not available on the z196 and later families.
The actual service times that will be experienced in a given configuration depend on many things, so it is not possible to provide a specific service time value that will apply in all cases. However, to help you get some indication of the relative performance of different link types, we performed a number of measurements with different types of links, and present the results of those measurements in this chapter.
|
Performance Disclaimer: The measurements presented here were taken using a configuration that was also being used for other projects. Although we strove to have repeatable and comparable results, the measurements were not taken in a controlled environment. Actual results might vary. Performance information is provided “AS IS” and no warranties or guarantees are expressed or implied by IBM. For official IBM performance information, refer to the Large Systems Performance Reference documentation.
|
5.1 Introduction to performance considerations
Although the type of CF link used plays a significant role in the service times that you observe, CF performance is affected by many things. To understand the performance that you are seeing, and to identify the configuration that is required to deliver the performance that your business requires, it is important to understand the configuration choices that contribute to CF service times. The following sections briefly discuss several of these choices.
Dedicated engines
When CF performance is critical, the recommendation is that the CF should be defined with dedicated engines. Sharing engines potentially increases the service times and utilization of the CPCs. This can add significant costs (elapsed time, z/OS CPU consumption, and throughput), to the requesters of the CF services, potentially resulting in software charges increasing to the point that the cost of providing a dedicated engine might be a more cost-effective option.
External or Internal CF LPARs
External CFs for this discussion are considered to be CF LPARs that reside on a CF-only CPC or CF LPARs that do not connect to any z/OS LPARs that might reside in the same CPC. An Internal CF, for the purposes of this discussion, is one that resides in the same CPC as at least one z/OS that is connected to it.
Various structures (DB2 lock structures, for example) require either failure isolation from any connectors or the use of System Managed Duplexing to be able to recover from the loss of a CPC containing a CF and a connected z/OS system. The use of external CFs meets the failure-isolation requirement for those structures, thereby avoiding the cost associated with the use of System Managed Duplexing.
The use of a zBC12 CPC as external CF might be a cost-effective alternative for clients that currently use Internal CFs and System Managed Duplexing. The 2828 Model H13 supports up to eight HCA fanouts, thereby providing significant flexibility. For more information about the cost of System Managed Duplexing, so that you can make an informed decision about the most cost-effective way to achieve your resiliency requirements, see the System Managed Duplexing white paper, available on the web at the following site:
http://public.dhe.ibm.com/common/ssi/ecm/en/zsw01975usen/ZSW01975USEN.PDF
Synchronous versus asynchronous requests
Depending on how the structure connector issues the request, XES can behave in one of two ways when it sends a request to the CF:
•It can send the request as a synchronous request. In this case, XES spins on the CP, consuming CPU in the requester’s address space until the response is received from the CF.
•It can send the request as an asynchronous request. In this case, after the request is sent to the CF, XES returns control to the MVS dispatcher. The dispatcher will pass control to another task. After some time, control is returned to the dispatcher. If the response has arrived back from the CF, the dispatcher passes control back to XES.
Most of the CPU time required to process an asynchronous request gets charged back to various operating system components rather than to the requester. The CPU time is still consumed (asynchronous CF requests are not free); it is simply a question of which address space gets charged for it. Also, because of all the task switching involved, the elapsed time for an asynchronous request is always higher than if the same request had been processed synchronously.
This is an important point, because a change in CF performance that results in a different balance of synchronous and asynchronous requests might have the affect that some address spaces appear to be consuming more or less CPU time. In either case, the CPU is still consumed; it is simply a question of which address space is charged.
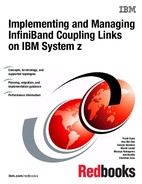
The amount of z/OS CPU time that is consumed to process an asynchronous request, including the task switches, will vary with the speed of the CPU. But for the sake of example, assume that it is 26 microseconds. Regardless of the actual time, the important point is that the z/OS CPU cost will be the same, regardless of whether the response arrived back from the CF in very little time, or if it took a very long time. This is illustrated by the horizontal line in the chart in Figure 5-1.
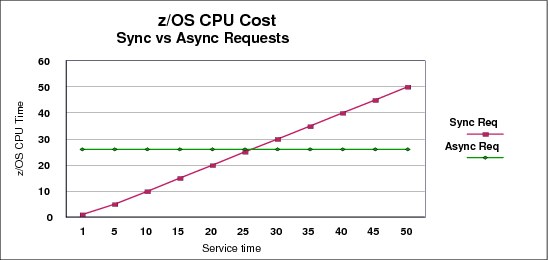
Figure 5-1 Comparison of synchronous and asynchronous requests
In contrast, for a synchronous request, the z/OS CPU time associated with the request will be equal to the CF service time. If the response arrives back from the CF in 5 microseconds, the CPU time will be 5 microseconds. If the response takes 50 microseconds to arrive back from the CF, then the CPU cost will be 50 microseconds. This is shown by the diagonal line in Figure 5-1.
Starting in z/OS 1.2, XES is able to decide whether to convert synchronous requests to be asynchronous, depending on whether the expected service time is above a certain threshold. If the service time is expected to be below the threshold, XES will leave the request as a synchronous one. The threshold is based on the expected z/OS CPU cost of processing the request asynchronously.
For example, assume that XES expects the service time for a given request to be 5 microseconds. Using the chart in Figure 5-1, we can see that if the request was issued synchronously, the z/OS CPU time to process that request would be 5 microseconds. If that request was issued asynchronously, the z/OS CPU time would be about 26 microseconds. So, for this request, the most efficient option (in terms of z/OS CPU time to process the request) is to issue it synchronously. If XES expects the service time for another request to be 50 microseconds, the z/OS CPU time to process it would be 50 microseconds if it was issued synchronously, but only 26 microseconds if it was issued asynchronously. In this case, issuing the request asynchronously is the most efficient option.
Based on these examples, the most efficient option for a given service time is for XES to select the lower of the two lines. For short service times (up to about 26 microseconds in this example), the most efficient option would be for XES to issue the request synchronously. For longer service times (greater than 26 microseconds) it would be more efficient for XES to issue the request asynchronously.
This decision process is called the z/OS heuristic algorithm and is described in detail in the section titled “How z/OS performs synchronous to asynchronous conversion of coupling facility requests” in z/OS MVS Setting Up a Sysplex, SA22-7625.
To minimize the z/OS CPU cost of using the CF, ideally the CF service times should be as low as possible. And, as illustrated by the chart in Figure 5-1 on page 123, low service times will result in the requests being issued synchronously. Based on this, it is generally a positive sign to see a high percentage of CF requests being issued synchronously1. If the percentage of CF requests being issued asynchronously increases over time (but the workload mix remains consistent), that is a possible indicator that CF service times are increasing.
CF CPU speed and utilization
The life of a CF request consists of the following steps:
•Finding an available subchannel
•Finding an available link buffer
•Sending the request over the link to the CF
•Processing the request in the CF
•Sending the request over the link back to z/OS
•z/OS retrieving the request from the link buffer
Notice that the time that the request spends in the CF is only one part of the service time. And the amount of time that is spent in the CF depends on:
•The utilization of the CF engine - higher utilization increases the likelihood that the request will need to queue for access to the engine
•The request type - some requests involve more extensive processing for the CF than others
•The speed of the CF engine - this is more important for requests that involve a lot of processing in the CF.
To understand the difference that a change in CF engine speed might deliver, you need to know how much time, on average, each request is spending in the CF. You can derive this information from the RMF CF Usage Summary report. An annotated example is shown in Figure 5-2 on page 125.
At the bottom of the report, the AVERAGE CF UTILIZATION field reports how busy the CF was over the interval and the LOGICAL PROCESSORS field shows the number of engines in the interval. In this example, there was one engine in the CF, and that was busy for 35% of the time. The INTERVAL field at the top of the report shows the amount of time that is being reported on; in this case, the interval is one minute.

Figure 5-2 Calculating CF CPU time per CF request
To determine the average amount of CF CPU time that is spent to process requests for the THRLSTCQS_1 structure, obtain the number of requests that were processed (from the # REQUESTS column) and the percent of the used CF CPU that was used to process those requests (from the % OF CF UTIL column). In this example, those values are 120237 and 4.1, respectively.
Insert these values into the following equation:
((INTERVAL (in mics.) * CF CPU BUSY * # ENGINES) * % OF CF UTIL) / # REQUESTS
((60000000 * .35 * 1) * .041) / 120237
7.16 mics per request
Then compare the CF CPU time for an average request to that structure to the service time for that structure as reported by z/OS. In this case, the overall average service time for the THRLSTCQS_1 structure was 16.4 microseconds. So doubling the speed of the CF CPU would be expected to decrease the overall service time for this structure by between 20% and 25%, plus possibly a decrease in queuing time within the CF.
CF link type and length of link
|
Note: Because the link type pays such a large role in sysplex performance, in this chapter we use the full name of each link type (for example, HCA3-O 12X IFB3) in every case to ensure that there is no confusion or misunderstanding.
|
The link type plays a significant part in how long it takes for the request to get from z/OS to the CF and back again. Table 5-1 is a subset of the coupling cost table contained in 1.5, “The importance of an efficient coupling infrastructure” on page 9. It shows how a CF that is capable of delivering better service times (z196 with HCA2-O 12X IFB links compared to z196 with ISC3 links, for example) results in a lower coupling cost for the connected z/OS systems. That lower coupling cost translates into better application response times and a reduction in the amount of z/OS CPU capacity required to complete a given piece of work.
As you look through that table, notice that changing the link technology to a faster one generally results in a larger reduction in coupling cost than replacing the CF CPU with a faster one. This illustrates the importance of focusing on providing an efficient and appropriate coupling infrastructure.
Table 5-1 Coupling z/OS CPU cost
|
CF/Host
|
z10 BC
|
z10 EC
|
z114
|
z196
|
zBC12
|
zEC12
|
|
z10 EC ISC3
|
16%
|
17%
|
17%
|
21%
|
19%
|
24%
|
|
z10 EC ICB4
|
9%
|
10%
|
NA
|
NA
|
NA
|
NA
|
|
z10 EC 12X IFB
|
11%
|
12%
|
12%
|
14%
|
14%
|
16%
|
|
z196 ISC3
|
16%
|
17%
|
17%
|
21%
|
19%
|
24%
|
|
z196 12X IFB
|
11%
|
12%
|
11%
|
14%
|
14%
|
15%
|
|
z196 12X IFB3
|
NA
|
NA
|
9%
|
11%
|
10%
|
12%
|
|
The XES Synch/Async heuristic algorithm effectively caps overhead at about 18%.
These values are based on nine CF requests per second per MIPS.
|
||||||
The other aspect of CF links that can have a significant impact on service times is the length of the fiber connecting z/OS to the CF. Every 1 km of cable length increases service times by 10 microseconds. So 10 kms (a common distance between data centers) increases service times by 100 microseconds. 100 microseconds might not seem like a long time, but compared to lock service times of 5 microseconds, 100 microseconds becomes a very significant number. There probably is not much that you can do to influence the length of cable that you need, but you do need to bear the impact of that distance in mind when considering service times.
The remainder of this chapter reports the results of various measurements we carried out on different combinations of CPCs and link types.
|
Important: The results are reported here cannot be used to determine service times to be seen in your configuration. There are many variables that can affect service times. It is possible that your service times will be better than those that we observed, or they might be longer. What is more valuable is to compare the service time we got from one configuration with the service times we observed in a different configuration.
|
5.2 Our measurements
Because all sysplex clients using ISC3 and ICB4 links will move to InfiniBand links as part of their migration to z196 or later CPCs, we performed a number of measurements using a variety of link types. Presumably you will find a measurement of an environment that is similar to your current configuration, and one that resembles your target configuration.
Because System z10 CPCs do not support HCA3 fanouts, and z196 CPCs do not support ICB4 links, we were unable to perform a direct comparison of ICB4 to HCA3-O 12X IFB3-mode links. Despite this, the measurements we carried out should still be valuable to you.
We carried out the following measurements running z/OS on our z10:
•Two z/OS systems connected to a z10 CF using ICB4 links
•Two z/OS systems connected to a z10 CF using HCA2-O 12X IFB links
•Two z/OS systems connected to a z196 CF using HCA2-O 12X IFB links
•Two z/OS systems connected to two z10 CFs with ICB4 links and using System Managed Duplexing
•Two z/OS systems connected to two z10 CFs with HCA2-O 12X IFB links and using System Managed Duplexing
With z/OS running on our z196, we carried out the following measurements:
•Two z/OS systems connected to a z196 CF using ISC3 links
•Two z/OS systems connected to a z196 CF using HCA2-O 12X IFB links
•Two z/OS systems connected to a z196 CF using HCA3-O 12X IFB3 links with 4 CHPIDs defined (so they would run in IFB3 mode)
•Two z/OS systems connected to a z196 CF using HCA2-O LR 1X links
•Two z/OS systems connected to a z196 CF using HCA3-O LR 1X links with 32 subchannels defined for each CHPID
•Two z/OS systems connected to two z196 CFs using HCA2-O 12X IFB links and using System Managed Duplexing
•Two z/OS systems connected to two z196 CFs using HCA3-O 12X IFB3 links and using System Managed Duplexing
5.3 Our configuration
The configuration we used for our measurements consisted of one System z10 CPC and one zEnterprise 196 CPC. To reflect a configuration with two CPCs of the same type, most of the measurements were carried out with the z/OS LPARs connected to CF LPARs in the same physical CPC using physical links that were attached to separate cards. In an attempt to get more repeatable results, and provide a degree of isolation from the other work running on the CPCs, all the LPARs used for the measurements were defined with dedicated engines.
The links from the z/OS LPARs to the CF LPARs were shared in all cases. Also, in the InfiniBand measurements, four CHPIDs were assigned to each link. In practice, we did not actually need that many CHPIDs, partially because our workload did not contain the bursty type of activity that exists in a production environment. However, we used a configuration with four CHPIDs on each InfiniBand port for the following reasons:
•Based on early IBM recommendations to avoid assigning more than four CHPIDs per InfiniBand port, many clients use a configuration of four CHPIDs per InfiniBand port.
•For HCA3-O 12X ports to run in IFB3 mode, no more than four CHPIDs can be assigned to each port.
•Stand-alone CFs currently require a power-on reset (POR) to change the number of CHPIDs assigned to an InfiniBand port. Even if your workload does not require four CHPIDs today, assigning four CHPIDs to each InfiniBand port can allow you to grow the workload in the future without requiring a POR to implement that change.
5.4 Testing background
This section provides background about the methodology and philosophy associated with our testing for collection of performance data used in our comparisons.
5.4.1 z/OS LPAR configurations
All testing of the workloads was driven by two z/OS LPARs. The driving LPARs were always configured to have three dedicated CPs. The z/OS level was 1.12. The actual workloads that we used for the measurement are described in 5.4.3, “Workloads used for our measurements” on page 129.
5.4.2 CF configurations
For all tests, the CF LPARs were assigned dedicated ICF engines. The only structures in the CF that was the focus of the measurement were those being used by the workload driver jobs. Regular system traffic was directed to another CF LPAR to remove any variability caused by activity that was not part of the workload being measured2.
The CF LPAR on the z10 had two dedicated engines. The CF on the z196 had one dedicated engine. Based on information from zPCR, the 2-way z10 CF had 1.23 times more capacity than the 1-way z196 CF. When normalizing the CF CPU utilization later in this chapter, we will use that relative capacity in our calculations.
Even though the capacity of the z196 CF (with just one engine) was less than that of the z10 CF (with two engines), the engine speed of the z196 CF is higher. “HCA2-O 12X IFB links to z196 CF” on page 132 shows how the higher engine speed resulted in reduced response times when the CF was moved from the z10 to the z196.
For the System Managed Duplexing measurements, we used a third CF, with the secondary copy of the DB2 and IBM IMS™ lock structures being the only structures in that CF.
5.4.3 Workloads used for our measurements
The workload we used to generate the activity for the measurements is a custom-written set of programs that generate requests to CF structures. Although these programs do not use IBM CICS® or DB2 or IMS, they do generate CF requests that are intended to reflect the type of list, lock, and cache requests that are generated by those subsystems. The advantage of these programs is that they provide great flexibility over the request rate, the size of the requests, the ratio of reads-to-writes, whether the requests are synchronous or asynchronous, and so on. Also, all they do is generate CF requests, so there are no secondary delays that can be caused by resource contention or any of the other delays that can impact a “real” subsystem. Because the jobs do nothing other than generate CF requests, their behavior is very consistent, resulting in repeatable and reliable results.
However, they tend to generate requests at a consistent rate, whereas real workloads tend to be more “bursty”. This results in our probably seeing fewer subchannel or path busy conditions than you might expect in a real production environment.
Because one of the objectives of this document is to provide comparative analysis of link performance, we felt that the repeatability and consistency provided by these drivers outweighed the small disadvantage of not being completely real-world in nature.
Custom program description
The programs used to simulate the various workloads are designed to generate CF requests that are similar to those produced by DB2, GRS, IMS, System Logger, and WebSphere MQ. Each program ran as a batch job, with each program writing to just one structure. To generate activity from both z/OS systems, we ran multiple copies of the jobs. More detail about the structures they used and the target level of activity for each structure is listed in Table 5-2.
Table 5-2 Performance measurement structures and loads
|
Structure type and attributes
|
Target request rate
|
|
IMS Shared Message Queue
|
1000
|
|
DB2 GBP 4 KB heavy write bias
|
2500
|
|
DB2 GBP 32 KB heavy read bias
|
2500
|
|
DB2 GBP 4 KB heavy read bias
|
2500
|
|
DB2 GBP 4 KB read bias
|
2500
|
|
DB2 GBP 4 KB read bias
|
2500
|
|
DB2 Lock
|
10000
|
|
GRS Lock
|
5000
|
|
IMS Lock
|
5000
|
|
IMS Cache 4 KB read bias
|
3000
|
|
IMS Cache 4 KB read bias
|
3000
|
|
System Logger 4 K only writes
|
1000
|
|
System Logger 1KB mainly writes
|
1000
|
|
WebSphere MQ 1 KB read and write
|
500
|
|
WebSphere MQ 1 KB read and write
|
500
|
|
WebSphere MQ 1 KB read and write
|
500
|
|
WebSphere MQ 1 KB read and write
|
500
|
|
WebSphere MQ 1 KB read and write
|
500
|
|
WebSphere MQ 1 KB read and write
|
500
|
|
Total (per z/OS system)
|
44,500
|
5.4.4 Run-time test composition
All measurement runs consisted of running the test programs in both z/OS systems. The programs themselves were not changed at all; the only changes that were made were to the configuration. All measurements were run for at least 15 minutes, and the measurement interval did not start until all jobs had been running for a few minutes and the level of activity had settled down.
5.4.5 Measurement summaries
If you are familiar with RMF CF reports, you know that there is a plethora of data about various aspects of CF and CF structure usage. Reporting all of that information here would serve little purpose. Our objective is to provide you with a few key metrics, particularly the ones that provide insight into performance and link usage, so that you can easily see the changes that were brought about by each configuration change. For that reason, we settled on the following metrics:
•The link type
•The number of physical links to the target CF
•The number of CHPIDs used to connect the target CF
•CF CPU Utilization
•The percent of synchronous and asynchronous CF requests
•The average synchronous and average asynchronous service time
•The total request rate to the CF
In addition, for the System Managed Duplexing measurements, we provide:
•CF utilization for each of the peer CFs
•For each of the duplexed structures, we provide:
– The synchronous request rate
– The average synchronous service time
– The asynchronous request rate
– The average asynchronous service time
5.5 Simplex performance measurements results
As described in 5.1, “Introduction to performance considerations” on page 122, ICB4 links are not available on CPC generations after System z10, so to obtain a baseline set of measurements, we started with a measurement of ICB4 links on our z10, followed by a run with HCA2-O 12X IFB links on the same CPC. We then ran a wider set of measurements on our z196, measuring ISC, HCA2 (1X and 12X), and HCA3 (1X and 12X) links. The results of those measurements are presented in this section.
Because only a subset of clients is using System Managed Duplexing, the results of the duplexing runs are presented separately, in 5.7, “SM Duplex performance measurements results” on page 143. There is also a separate section with a comparison of ISC3 links with HCA2-O LR 1X and HCA3-O LR 1X links, in 5.6, “ISC and PSIFB 1X performance measurements results” on page 140.
5.5.1 Measurements on z10
In this section we compare our experiences with the ICB4 and HCA2-O 12X IFB links on our z10 (including one HCA2-O 12X IFB measurement where we ran z/OS on the z10 and connected to the CF running on the z196).
ICB4 links
Prior to the announcement of the HCA3-O links running in IFB3 mode, the best-performing physical CF links (as opposed to ICP internal links) were ICB4 links. Table 5-3 summarizes the results of the measurement for the ICB4 links. The interesting numbers are:
•The total request rate, which was a little under the target rate of 89,000 requests a second
•The CF CPU utilization, of 24.3%
•The high percent of requests that were issued synchronously, 94.6%
•The average synchronous service time of 14.1 microseconds
Table 5-3 ICB4 on z10 results
|
Link
type
|
Number
links
|
Number
CHPIDs
|
CF type
|
CF %
util
|
Sync %
|
Sync serv time
|
Async %
|
Async serv time
|
Total req rate
|
|
ICB4
|
2
|
2
|
z10
|
24.3%
|
94.6%
|
14.1
|
5.4%
|
84
|
86959
|
These results reflect the activity across all 19 structures. Various structures (the lock structures, for example) experienced better service times than the average. Other structures (the 32 KB DB2 GBP, for example) experienced longer service times than the average.
We only used two ICB4 links for these measurements. However, we had zero path busy and zero subchannel busy events, indicating that the number of links did not pose a bottleneck.
HCA2-O 12X IFB links
If you have ICB4 links today, the most likely upgrade path is to install HCA2-O 12X fanouts on your existing z10 CPCs in preparation for a migration to z196. Therefore, the next measurement we performed was to run the same workload, using the same z/OS and CF LPARs, but with HCA2-O 12X fanouts instead of the ICB4 links.
The HCA2-O 12X fanouts are the best performing InfiniBand technology available on z10. Compared to ICB4, the big advantages of the HCA2-O 12X fanouts are that they support a maximum distance of 150 meters compared to the 10 meters that are supported by ICB4 links3, and that you can easily add more CHPIDs to an existing link to address subchannel or path busy conditions. The results of the z10 HCA2-O 12X IFB measurement are summarized in Table 5-4 on page 132.
Table 5-4 HCA2-O 12X IFB on z10 results
|
Link
type
|
Number
links
|
Number
CHPIDs
|
CF type
|
CF %
util
|
Sync %
|
Sync serv time
|
Async %
|
Async serv time
|
Total req rate
|
|
|
ICB4
|
2
|
2
|
z10
|
24.3%
|
94.6
|
14.1
|
5.4
|
84
|
86959
|
|
|
HCA2-O
|
2
|
8
|
z10
|
36.7%
|
90.3
|
18.7
|
9.7
|
92.4
|
85435
|
Note the following interesting comparisons between the ICB4 and HCA2-O 12X IFB measurements:
•The average synchronous service time increased from 14.1 microseconds to 18.7 microseconds. This is in line with the expectation of an increase in synchronous service times when moving from ICB4 links to HCA2-O 12X IFB on z10.
•As a result of the increased synchronous service times, the percentage of requests that were processed synchronously dropped a little, from 94.6% to 90.3%.
•The overall number of requests also dropped a little, from 86,959 per second to 85,435 per second.
The design of the workload generating programs is that, regardless of the target request rate, they will not submit a new CF request until they have received the response from the previous request. Therefore, as the average service time increases, you might see a corresponding decrease in the request rate.
•When we changed from the ICB4 to the HCA2-O 12X IFB links, the CF utilization increased, from 24.3% to 36.7%. This is a pattern that we observed over all the measurements, namely that there is a direct correlation between the speed of the CF links and the utilization of the CF CPU: as the link speed increases, the CF CPU utilization decreases.
The results of this measurement were broadly in line with expectations: that moving from ICB4 to HCA2-O 12X IFB links (and all other parts of the configuration remaining unchanged) will result in an increase in average synchronous service times4, and that increased average service times will result in a lower percent of requests being handled synchronously.
HCA2-O 12X IFB links to z196 CF
Because the remaining measurements will be run with a z196 CF, and thereby benefit from the faster CPU of that processer, we ran one more measurement on the z10. This one involved running both z/OS systems on the z10, and using the HCA2-O 12X fanouts to connect to a CF in the z196. As we move on to more measurements on the z196, this will provide an indication of how much benefit those measurements are getting from the fact that they are using a faster CF.
The results of this measurement are shown in Table 5-5 on page 133.
Table 5-5 HCA2-O 12X IFB on z10 to z196 results
|
Link
type
|
Number
links
|
Number
CHPIDs
|
CF type
|
CF %
util
|
Sync %
|
Sync serv time
|
Async %
|
Async serv time
|
Total req rate
|
|
ICB4
|
2
|
2
|
z10
|
24.3%
|
94.6
|
14.1
|
5.4
|
84
|
86959
|
|
HCA2-O
|
2
|
8
|
z10
|
36.7%
|
90.3
|
18.7
|
9.7
|
92.4
|
85435
|
|
HCA2-O to z196
|
2
|
8
|
z196
|
34.9%1
|
95.4
|
14
|
4.6
|
105.5
|
86204
|
1 Note that this is 34.9% of a 1-way z196 CF, and that the previous two measurements were using a 2-way z10 CF. The z10 CF had about 1.23 times as much capacity as the 1-way z196 CF.
Comparing the HCA2-O 12X IFB to z10 run with the HCA2-O 12X IFB to z196 CF run, we make the following observations:
•For this workload mix, the faster CPU speed on the z196 CF delivered a reduction of 4.7 microseconds in the average synchronous service time, across all the structures.
•As a result of the improved average synchronous service times, the percent of requests that were processed synchronously was actually a little higher than the base case on the z10 with the ICB4 links. This was because the service times improved enough that some border-line requests were no longer being converted to run asynchronously.
•The average asynchronous service time increased. However, the nature of asynchronous requests is that their service time tends not to be very consistent, particularly at low request rates. Also, asynchronous service times are often seen to improve as the number of asynchronous requests increases. So, conversely, as the number of asynchronous requests decreases, the service times might increase. Because of this behavior, and the inconsistency of their service times, the asynchronous service times are not really of much interest here.
•The overall number of requests that were processed is still a fraction lower than was the case with the ICB4 links on the z10; however, it is within the margin of error, and is still more than was the case with the HCA2-O 12X IFB links to the z10 CF.
The net result was that replacing a z10 CF that is connected using ICB4 links with a z196 CF that is connected using HCA2-O 12X IFB links results in about the same CF service times.
5.5.2 Measurements on z196
The remaining measurements were all taken on the z196. We wanted to take as many of the measurements as possible with the same CPC, thereby removing the effect of the speed of the z/OS or CF CPCs from the differences between one measurement and another.
|
Note: All the measurements in this section were taken using a 1-way z196 CF. The reported CPU utilizations were not normalized to the z10 measurements, however the text takes note of this where appropriate.
|
ISC3 links
The first set of measurements we took were using ISC3 links. There are many installations using ISC3 links within a single data center, so it was important to determine a baseline for clients that are using ISC3 links on z196 today.
IBM has issued a statement of direction that z196 is the last generation of CPCs that will support ordering of ISC3 links, so clients using ISC3 links today should be planning for a migration to InfiniBand as part of their future upgrade path.
We took a measurement using ISC3 so that those clients can see how the performance of InfiniBand links compares to the performance of ISC3. The results of that measurement are summarized in Table 5-6.
Table 5-6 ISC3 on z196 results
|
Link
type
|
Number
links
|
Number
CHPIDs
|
CF type
|
CF %
util
|
Sync %
|
Sync serv time
|
Async %
|
Async serv time
|
Total req rate
|
|
ISC3
|
8
|
8
|
z196
|
52.1%
|
41.2
|
26.5
|
58.8
|
105.5
|
76528
|
Reviewing the ISC3 measurement, we make the following observations:
•The percent of requests that were issued synchronously dropped to just 41.2%, which is an indication that the synchronous service times were going to be poor.
•The average synchronous service time was 26.5 microseconds. The current threshold at which synchronous requests get converted to asynchronous is about 26 microseconds, so when you see an average service time that is close to that threshold, it is an indication that a large number of requests were above the threshold.
•The CF CPU utilization was very high, at 52.1%. In a production environment, such a high utilization indicates an urgent need to add more capacity.5
|
Note: The design intent of Parallel Sysplex is that if a CF is unavailable, its workload can be moved to another CF in the sysplex. Therefore, CFs should be sized so that each CF has sufficient capacity to be able to run the entire CF workload and still deliver acceptable service times. The general IBM guideline is that the combined CF CPU utilization is to not exceed 70% to 80%, meaning that if you have two CFs and a balanced configuration, each CF should not exceed about 35% to 40% busy.
In the example here, if you have two CFs and both of them are over 50% utilized, the utilization of the surviving CF in case of an outage would be over 100%, which is well above the IBM guideline.
|
To put the 52.1% in perspective, the CF CPU utilization when using the HCA2-O 12X IFB links to connect from the z/OS systems on the z10 to the CF in the z196 was just 34.9%, despite the fact that the CF processed over 12% more requests when using the HCA2-O 12X IFB links than when using the ISC3 links.
•The total number of requests was down by over 11% compared to the run where z/OS was on the z10, and the CF was on the z196, connected using HCA2-O 12X IFB links. The decrease was because the increased service times delayed the initiation of new requests by the workload generator.
•Notice that for this measurement we used eight ISC3 links, compared to only two links (with four CHPIDs per link) for all the InfiniBand measurements. However, even the increased number of links cannot compensate for the weaker performance of the ISC3 links. It is not shown in Table 5-6, but there were no subchannel busy or path busy events, so the slow performance of the ISC3 links was not related to any bottlenecks in that area.
For anyone using ISC3 links to connect CPCs in a single data center today, this is all good news, because it means that benefits in terms of reduced service times, reduced CF CPU utilization, a reduction in the number of links that are required, and a reduction in the z/OS CPU required to drive the same number of CF requests can result when you migrate to InfiniBand 12X links.
HCA2-O 12X IFB links
The next set of measurements were with the HCA2-O 12X IFB links. These are the ones that were available when z196 was initially delivered, and are the links that are carried over if a z10 is upgraded to a z1966. The results of those measurements are summarized in Table 5-7.
Table 5-7 HCA2-O 12X IFB on z196 results
|
Link
type
|
Number
links
|
Number
CHPIDs
|
CF type
|
CF %
util
|
Sync %
|
Sync serv time
|
Async %
|
Async serv time
|
Total req rate
|
|
|
ISC3
|
8
|
8
|
z196
|
52.1%
|
41.2
|
26.5
|
58.8
|
105.5
|
76528
|
|
|
HCA2-O
|
2
|
8
|
z196
|
34.5%
|
94.7
|
14
|
5.3
|
108.3
|
87175
|
We can make the following observations about the results of this run compared to the ISC3 on z196 measurement:
•The request rate increased, from 76,528 requests a second to 87,175 requests a second, which is an increase of nearly 14%. This was the highest request rate achieved in any of the measurements so far.
•Despite the increased number of requests being processed, the CF CPU utilization actually dropped, from 52.1% to 34.5%.
•The percent of requests that were processed synchronously increased from 41.2% with ISC3, to 94.7% with HCA2-O 12X IFB. This was also a slightly higher percent than was achieved with the ICB4 links on the z10.
•Compared to the ISC3 links, the average synchronous service time dropped by nearly 50%, to 14 microseconds, and this included many requests that previously were being processed asynchronously, so the service time improvement for those requests would be even more than 50%.
•Notice that the results of this measurement were similar to those of the run where z/OS was on the z10 and the CF was on the z196. For synchronous requests, and assuming that there are no delays due to lack of available subchannels or link buffers, most of the service time consists of going to the CF over the link, getting processed in the CF, and coming back over the link to z/OS. For these two measurements, the link type was the same and the CF was the same, and there were no delays due to lack of available subchannels or link buffers, so it is to be expected that the service times (especially for synchronous requests) will be similar.
If you are using ISC3 links today and are contemplating a migration to 12X InfiniBand links, the results of these measurements can give you the confidence to proceed and help you in planning for the number of links you will require. For information about planning for an appropriate number of CHPIDs, see 3.7, “Physical and logical coupling link capacity planning” on page 50.
HCA3-O 12X links in IFB3 mode
The next set of measurements was to determine the impact of the new HCA3-O 12X links running in IFB3 mode. The results are summarized in Table 5-8.
Table 5-8 HCA3-O 12X IFB3 mode on z196 results
|
Link
type
|
Number
links
|
Number
CHPIDs
|
CF type
|
CF %
util
|
Sync %
|
Sync serv time
|
Async %
|
Async serv time
|
Total req rate
|
|
|
ISC3
|
8
|
8
|
z196
|
52.1%
|
41.2
|
26.5
|
58.8
|
105.5
|
76528
|
|
|
HCA2-O
|
2
|
8
|
z196
|
34.5%
|
94.7
|
14
|
5.3
|
108.3
|
87175
|
|
|
HCA3-O
|
2
|
8
|
z196
|
25.8%
|
99.7%
|
7
|
0.3
|
148.5
|
89476
|
|
Note: This set of measurements was for HCA3-O 12X links, with HCA3-O adapters at both ends of the link, and with only four CHPIDs assigned to those ports, meaning that the ports were running in IFB3 mode.
If the HCA3-O 12X ports had been connected to HCA2-O 12X ports, or had more than four CHPIDs assigned to them, they would have run in IFB mode and the performance would have been equivalent to the performance of HCA2-O 12X links.
|
Based on the results of the measurement with the HCA3-O 12X links in IFB3 mode, and comparing those results to the ICB4 measurement on the z10 and the HCA2-O 12X IFB measurement on the z196, we have the following observations:
•The percent of requests that were processed synchronously increased to 99.7%, the highest by far of all the measurements. This indicates that the overall average synchronous service time is going to be very good.
•The average synchronous service time dropped 50% from 14 microseconds on both the HCA2-O 12X IFB on z196 measurement and the ICB4 on z10 measurements, to 7 microseconds on the HCA3-O 12X IFB3 measurement.
•The improved service time contributed to an increase in the request rate from 87,175 per second with HCA2-O 12X IFB, to 89,476 per second on the HCA3-O 12X IFB3 links. The request rate with the ICB4 links was 86,959 per second.
•The more efficient coupling links also contributed to a reduction in the CF CPU utilization, from 34.5% with HCA2-O 12X IFB links to 25.8% with the HCA3-O 12X IFB3 links.
Overall, the results of the HCA3-O links in IFB3 mode were excellent. There was no aspect of the performance where the HCA3-O 12X IFB3 links were not significantly better than the HCA2-O 12X IFB. They were also better than our experiences with the ICB4 links. The relationship between CF service times and z/OS CPU utilization will be discussed in “z/OS CPU utilization” on page 139.
Summary of 12X and legacy link measurements
To help you more clearly evaluate the performance of one link type versus another, this section investigates some of the aspects of performance and presents the results in a graphical format.
|
Note: All the measurements in this section have been normalized to the capacity of our z196 and the request rate that was achieved during the HCA3-O 12X IFB3 measurement.
|
CF CPU utilization
The utilization of the CF CPU is important for a number of reasons:
•Higher utilization results in more queuing in the CF. This manifests itself in higher service times.
•As CF CPU utilization increases, a point (known as “the knee of the curve”) is reached where the service times start increasing more sharply.
•CFs should be configured so that the full sysplex workload can be handled by the surviving CFs if one CF is unavailable for some reason. This means that CFs are to be configured with spare capacity (known as white space) so that they can take over the workload from a failed or unavailable CF. Additionally, to protect service times during such an event, the utilization of the CF should not exceed the point at which the knee of the curve is reached. This typically means aiming for a combined utilization that is not greater than the 70% to 80% range. If you have two CFs, and the load is balanced between the two, then the normal peak utilization should not exceed 35% to 40%.
As shown by the measurements, there is a clear relationship between the utilization of the CF and the speed of the links that are being used. To be able to make a fair comparison between the various configurations and measurement results, we performed the following calculations:
•We multiplied the CF CPU utilization of the z10 CF by 1.23 (because the z10 CF LPAR had 23% more capacity than the z196 CF). This converted the utilization percentages into z196 terms.
•We divided the request rate for the HCA3-O 12X IFB3 measurement by the request rate for each of the other measurements, and then multiplied the CF CPU utilization of each measurement by the result of that calculation.
For example, if the request rate of the HCA3-O 12X IFB3 measurement was 90,000 requests a second, and the request rate of some other measurement was 60,000 requests a second, dividing 90,000 by 60,000 equals 1.5. So if the CF CPU utilization of that other measurement was 40%, we multiplied that by 1.5 to show (approximately) what the utilization would have been if it had processed the same request rate as the HCA3-O 12X IFB3 configuration.
The result of these calculations gave a normalized number that showed what the CF CPU utilization would have been for each configuration if its CF had been in the z196, and if it had processed 89476 requests a second (the actual rate achieved by the HCA3-O 12X IFB3 configuration).
Figure 5-3 shows the result of these calculations for all of the measurements.

Figure 5-3 CF CPU utilization
In this particular environment, if the ISC3 links are not going to replaced, the CF needs to be upgraded to add another engine to bring the white space back to a level that can successfully handle a CF outage situation. Alternatively, if the ISC3 links are replaced with HCA3-O 12X links and those links are configured so that they run in IFB3 mode, not only will the upgrade be avoided, but there will be spare capacity available to handle more workload growth.
Overall, you can see the relationship between link technology and utilization of the CF engines.
Synchronous service times
There are many reasons why good service times for synchronous requests are important:
•Low service times reduce utilization of the subchannels and link buffers associated with those requests.
•The CF exploiters that issued the request to the CF will benefit from shorter service times, enabling better transaction service times or reduced batch job elapsed times.
•The shorter the synchronous service time, the less CPU is consumed in z/OS to process that request.
•Converting a request to run asynchronously rather than synchronously increases the service time of the request, typically by 2 to 3 times the synchronous service time. This results in increased concurrency and more competition for CF-related resources.
The average synchronous service times for the various configurations we measured are shown in Figure 5-4.
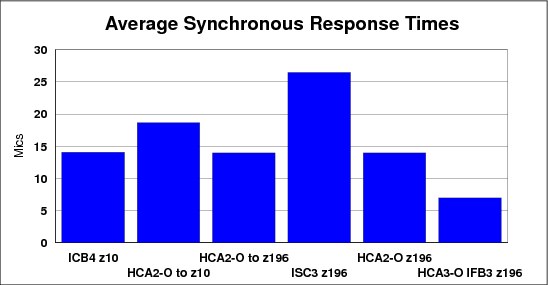
Figure 5-4 Synchronous service times
Figure 5-4 is an excellent example of the importance of CF link technology to CF service times. Moving the CF from a z10 to a z196 reduced service times by a little over 4 microseconds (compare the second and third bars in the chart). However, replacing the HCA2-O 12X IFB links with HCA3-O 12X links in IFB3 mode, but keeping the same CF CPC, reduced the service time by 7 microseconds. Replacing the ISC3 links with any type of InfiniBand link resulted in an even larger decrease in service times.
z/OS CPU utilization
As discussed in “Synchronous versus asynchronous requests” on page 122, CF requests can be handled synchronously or asynchronously. Processing a request asynchronously consumes a relatively fixed amount of z/OS CPU time, whereas the z/OS CPU time to process a synchronous request is equal to the CF service time. So, the lower the synchronous service time, the less z/OS CPU is consumed to process the request.
Calculating the approximate z/OS CPU time to process a set of CF requests is relatively easy. Simply multiply the number of synchronous CF requests by the synchronous service time and add to that the sum of the number of asynchronous requests multiplied by the Sync/Async heuristic threshold (about 26 microseconds at the time of writing).
Figure 5-5 shows the results of applying this formula to our measurements (normalized to the capacity of a z196 and the request rate during the HCA3-O 12X in IFB3 mode measurement).

Figure 5-5 z/OS CPU utilization
Changing from one link type to another might (or might not) result in a noticeable change in overall z/OS CPU utilization; it depends on how constrained the system is and what the bottlenecks are. What is more likely is that because each request completes in less time, the elapsed time for batch jobs and transactions will reduce, so the same amount of work will be done in less time. However, it is fair to say that moving to links that reduce your synchronous service times can free up z/OS CPU capacity that is then available to other work.
5.6 ISC and PSIFB 1X performance measurements results
The next set of measurements we performed were aimed at comparing ISC3 and long reach InfiniBand (1X) links. These link types are most typically used for long-distance connections. Although we did not have very long cables, we were able to perform various measurements to compare the underlying performance of the two link types. The impact of distance on service times (10 microseconds per km) will be the same on both link types.
The ability of InfiniBand to assign multiple CHPIDs to a single link might allow you to provide equivalent performance and connectivity with InfiniBand 1X, but with fewer adapters, cables, and DWDM ports than required to provide equivalent performance with ISC3 links.
Because each subchannel and link buffer cannot accept a new CF request until the previous one that it was handling has completed, long distances (and the resulting high service times) significantly increase subchannel and link buffer utilization. Assigning multiple CHPIDs to a single InfiniBand link allows you to drive more value from the physical links than can be achieved with ISC3 links. Also, Driver 93 on z196 and z114 changed 1X links (both HCA2-O LR 1X and HCA3-O LR 1X) to have 32 link buffers per CHPID instead of the 7 that were supported previously. Both of these characteristics make 1X InfiniBand links a very attractive alternative to ISC3 links for connecting over relatively large distances.
In this set of measurements we concentrated on the underlying performance differences between ISC3 links and HCA2-O LR 1X and HCA3-O LR 1X links, because we did not have the long distances that generate high service times.
ISC3
The base case for this set of runs is the legacy (and widely-used) ISC3 links. We used the results of the same run that we used in “ISC3 links” on page 133; they are repeated in Table 5-9.
Table 5-9 ISC3 on z196 results
|
Link
type
|
Number
links
|
Number
CHPIDs
|
CF type
|
CF %
util
|
Sync %
|
Sync serv time
|
Async %
|
Async serv time
|
Total req rate
|
|
ISC3
|
8
|
8
|
z196
|
52.1%
|
41.2
|
26.5
|
58.8
|
105.5
|
76528
|
Because long-distance links are particularly intensive on subchannel and link buffer utilization, for this measurement we also calculated the link buffer utilization. There were eight ISC3 links shared between the two z/OS LPARs, which equate to 56 subchannels in each z/OS system and 56 link buffers in the link adapters. The average link buffer utilization was 9.97% over the measurement interval.
HCA2-O LR 1X
The next run was to compare the ISC3 links to the HCA2-O LR 1X links. The results are summarized in Table 5-10.
Table 5-10 HCA2-O LR 1X on z196 results
|
Link
type
|
Number
links
|
Number
CHPIDs
|
CF type
|
CF %
util
|
Sync %
|
Sync serv time
|
Async %
|
Async serv time
|
Total req rate
|
|
|
ISC3
|
8
|
8
|
z196
|
52.1%
|
41.2
|
26.5
|
58.8
|
105.5
|
76528
|
|
|
HCA2-O LR
|
2
|
8
|
z196
|
34.7%
|
83.7
|
19.5
|
16.3
|
99.7
|
84099
|
Reviewing the results from the ISC3 and HCA2-O LR 1X runs, we can make the following observations:
•The percent of requests that were issued synchronously increased from 41.2% with ISC3 links to 83.7% with the HCA2-O LR 1X links. This indicates significantly better service times with the HCA2-O LR 1X links.
•The request rate that was handled with the HCA2-O LR 1X links increased more than 10% from the load that was processed with the ISC3 links (from 76,528 per second to 84,099 per second).
•The average synchronous service time decreased from 26.5 microseconds with ISC3 to 19.5 microseconds with HCA2-O LR 1X. This facilitated the increases in the percent of requests that were processed synchronously and the increase in the overall request rate.
•In line with the pattern of CF utilization being related to the link speed, the CF CPU utilization decreased from 52.1% to 34.7%, despite the fact that the request rate increased by more than 10%.
•Due to the decreased service times, the link buffer utilization dropped to 4.89%, a reduction of over 50%. Remember that only two physical links were used in this measurement, compared to the eight links that were used in the ISC3 measurement.
Although the performance delivered by the HCA2-O LR 1X links was not as good as the HCA2-O 12X IFB links, it was still a significant improvement over the performance of the ISC3 links. Given that HCA2-O 12X IFB links support distances up to 150 meters, it is expected that most connections within a data center will use the 12X links, and that HCA2-O LR 1X links will be used more for cross-site connectivity.
As the length of the connection increases, the latency caused by the speed of light comes to dominate the service time. So, at distances of 10 km or more, the performance advantage of HCA2-O 12X IFB links compared to ISC3 links becomes less noticeable. However, you still obtain the significant benefit of more subchannels and more link buffers, which lets you reduce the number of physical links required.
HCA3-O LR 1X
The final run of this suite was based on the HCA3-O LR 1X links. These provide 32 link buffers per CHPID instead of the 7 that you had prior to Driver 937. However, given that we did not have very long links (and very high service times) and therefore did not encounter any subchannel or link buffer busy conditions, we did not expect any performance benefit from the additional link buffers.
In a configuration that was experiencing high path or subchannel busy, the additional link buffers are expected to result in better service times and less contention. The results are summarized in Table 5-11.
Table 5-11 HCA3-O LR 1X with 32 link buffers on z196 results
|
Link
type
|
#
links
|
#
CHPIDs
|
Total # subch
|
CF type
|
CF %
util
|
Sync %
|
Sync serv time
|
Async %
|
Async serv time
|
Total req rate
|
|
|
ISC3
|
8
|
8
|
56
|
z196
|
52.1%
|
41.2
|
26.5
|
58.8
|
105.5
|
76528
|
|
|
HCA2-O LR
|
2
|
8
|
56
|
z196
|
34.7%
|
83.7
|
19.5
|
16.3
|
99.7
|
84099
|
|
|
HCA3-O LR
|
2
|
8
|
256
|
z196
|
34.9%
|
82.01
|
20
|
17.99
|
105.5
|
81388
|
As shown, the results for the HCA3-O LR 1X links were very similar to our experiences with the HCA2-O LR 1X links. This is what we expected. Unlike the HCA3-O 12X adapters, the HCA3-O LR 1X adapters do not use the IFB3 protocol, so the performance in an environment that is not constrained for subchannels or link buffers would be expected to be similar to the HCA2-O LR 1X links. Also, the HCA2-O LR 1X and HCA3-O LR 1X measurements were taken some weeks apart (before and after the CPC upgrade to Driver 93 and to add new adapters).
The small performance difference between the HCA2-O LR 1X and HCA3-O LR 1X measurements is a good example of how small changes in the environment can result in small differences in performance. The performance differences are only likely to be noticeable in a benchmark environment; the variances in workload in a production environment mean that such differences probably are not even noticed.
Specifically of interest to installations planning to use 1X links to connect two sites is the link buffer utilization. In the ISC3 measurement, it was 9.9% of eight physical links. Migrating to HCA2-O LR 1X links prior to Driver 93 (so there are still only seven link buffers per CHPID), reduced link buffer utilization to 4.9% of just two physical links. Installing Driver 93 increased the number of link buffers. Even though the service times increased by a small amount, the link buffer utilization dropped to just 1.1% of two physical links. Given that the rule of thumb for subchannel and link buffer utilization is that it should not exceed 30%, the use of 1X links combined with Driver 93 or later provides significantly more scope for growth than the ISC3 links. HCA3-O LR 1X fanouts also provide four ports instead of the two that are provided on the HCA2-O LR 1X fanouts. This might be especially attractive to installations with large numbers of CPCs to interconnect.
Relationship between bandwidth and service times
Different types of CF requests cause different amounts of data to be sent to or retrieved from the CF. For example, writing a 32 KB buffer to a DB2 GBP structure involves moving 32 KB to the CF. In contrast, a lock request might be as small as 256 bytes.
The bandwidth of a CF link has an impact on the amount of time it takes to move data into the link and retrieve it from the link at the other end. And the smaller the bandwidth, the larger the impact. Figure 5-6 shows the service times for each of the structures in our measurement, for both ISC3 and HCA2-O LR 1X links. ISC3 links have a data rate of 2.0 GBps, and HCA2-O LR 1X and HCA3-O LR 1X links have a data rate of 5.0 Gbps.
Figure 5-6 Comparison of HCA2-O LR 1X and ISC3 structure service times
In the figure, the cache structures are all 4 KB except for Cache 2, which is 32 KB. As shown, the service time difference is more pronounced for the 32 KB structure than the other cache structures. And the lock structures, which tend to have the smallest requests, have the best service times, and the smallest difference between the ISC3 and HCA2-O LR 1X links. This information might be helpful if you are attempting to predict the change in service time if you move from ISC3 to HCA2-O LR 1X or HCA3-O LR 1X adapters.
5.7 SM Duplex performance measurements results
The final set of measurements we took are for clients that are using System Managed Duplexing with ICB4 links today, and are facing a migration to InfiniBand.
System Managed Duplexing was never envisioned to be a high performance solution. It was designed to provide a high availability capability for CF exploiters that do not support user-managed rebuild and to provide protection for exploiters that cannot survive a double failure. It is expected that clients with high volume and high performance requirements will not use System Managed Duplexing for database manager lock structures.
Nevertheless, it is valuable to provide information about the relative performance changes that clients can expect when migrating from ICB4 links to HCA3-O 12X links running in IFB3 mode.
ICB4 on z10
The base case measurement consisted of the following configuration:
•Two z/OS systems, both on z10. Both z/OS LPARs had three dedicated engines.
•Two CF LPARs, both on z10. Both CF LPARs had two dedicated engines.
•ICB4 links from the z/OS LPARs to each of the CF LPARs.
•ICB4 links between the two CF LPARs.
•In an attempt to be more client-like, the full workload was used, but only the IMS-like and DB2-like lock structures were duplexed using System Managed Duplexing.
•The second CF (referred to as CF2) contained only the secondary lock structures. All other structures were in CF1, as in all the other measurements.
There was also a third CF that contained all structures other than those that were associated with the workload. The performance of that CF and its associated structures was not part of the measurement.
The results of this measurement are summarized in Table 5-12 and Table 5-13.
Table 5-12 ICB4 System Managed Duplexing results
|
Link
type
|
Number
links to each CF
|
Number
CHPIDs to each CF
|
CF types
|
Total req rate
|
|
ICB4
|
2
|
2
|
z10
|
75607
|
Table 5-13 shows the information for ICB4 System Managed Duplexing for CF1 and CF2.
Table 5-13 ICB4 System Managed Duplexing results for CF1 and CF2
|
Link
type/
CF CPU type
|
CF1 %
Util
|
CF1 Sync %
|
CF1 Sync serv time
|
CF1 Async %
|
CF1 Async serv time
|
CF2 % Util
|
CF2 Sync %
|
CF2 Sync serv time
|
CF2 Async %
|
CF2 Async serv time
|
|
ICB4
z10
|
33.2%
|
71.24
|
17
|
28.76
|
73.5
|
16.8%
|
0.44
|
42
|
99.56
|
72
|
Because the focus of these measurements is on System Managed Duplexing, we extracted performance information for the two structures that were duplexed; that information is presented in Table 5-14 and Table 5-15 on page 145.
Table 5-14 shows the information for System Managed Duplexing with the ICB4 - DB2 lock structure.
Table 5-14 System Managed Duplexing with ICB4: DB2 lock structure
|
Config
|
Prim Sync rate
|
Prim Sync resp time
|
Prim Async rate
|
Prim Async resp time
|
Secondry Sync rate
|
Secondry Sync resp time
|
Secondry Async rate
|
Secondry Async resp time
|
|
|
ICB4 z10
|
46.4
|
42
|
10022
|
76
|
46
|
44
|
10022
|
74
|
|
Table 5-15 shows the information for System Managed Duplexing with the ICB4 - IMS lock structure.
Table 5-15 System Managed Duplexing with ICB4 - IMS lock structure
|
Config
|
Prim Sync rate
|
Prim Sync resp time
|
Prim Async rate
|
Prim Async resp time
|
Secondry Sync rate
|
Secondry Sync resp time
|
Secondry Async rate
|
Secondry Async resp time
|
|
|
ICB4 z10
|
29.7
|
36
|
7199
|
71
|
29.7
|
38
|
7199
|
68
|
|
Because this is the baseline measurement, there are no observations other than that the overall CF CPU utilization and average service times are increased compared to the simplex case, but this is in line with expectations.
HCA2-O 12X IFB on z10
The next set of measurements were performed with the same workload drivers, and with the following configuration:
•Two z/OS systems, both on z10. Both z/OS LPARs had three dedicated engines.
•Two CF LPARs, both on z10. Both CF LPARs had two dedicated engines.
•HCA2-O 12X IFB links from the z/OS LPARs to each of the CF LPARs.
•HCA2-O 12X IFB links between the two CF LPARs.
The results of this measurement are shown in Table 5-16 and Table 5-17.
Table 5-16 HCA2-O 12X IFB System Managed Duplexing results
|
Link
type
|
Number
links to each CF
|
Number
CHPIDs to each CF
|
CF types
|
Total req rate
|
|
ICB4
|
2
|
2
|
z10
|
75607
|
|
HCA2-O
|
2
|
8
|
z10
|
71810
|
Table 5-17 shows the information for HCA2-O 12X IFB System Managed Duplexing for CF1 and CF2.
Table 5-17 HCA2-O 12X IFB System Managed Duplexing results for CF1 and CF2
|
Link
type/
CF CPU type
|
CF1 %
Util
|
CF1 Sync %
|
CF1 Sync serv time
|
CF1 Async %
|
CF1 Async serv time
|
CF2 % Util
|
CF2 Sync %
|
CF2 Sync serv time
|
CF2 Async %
|
CF2 Async serv time
|
|
ICB4
z10
|
33.2%
|
71.24
|
17
|
28.76
|
73.5
|
16.8%
|
0.44
|
42
|
99.56
|
72
|
|
HCA2-O
z10
|
44.2%
|
67.3
|
21.5
|
32.7
|
104.2
|
16.4%
|
0.40
|
78.25
|
99.6
|
114
|
At the CF level, notice that there was an increase in the CPU consumption when the ICB4 links were replaced with HCA2-O 12X IFB links, but that is in line with the pattern that we saw earlier, where the CF CPU consumption changes in line with the speed of the links that are being used. Interestingly, the CPU utilization of the peer CF (CF2) did not increase following the move to HCA2-O 12X IFB links; that CF contained only lock structures, which indicates that there is a relationship between the mix of CF requests and the impact on CF CPU utilization (lock structures tend to have the smallest CF requests).
For a better understanding of the impact on System Managed Duplexing of changing the link types, we really need to look at information for the two structures that were being duplexed. That information is contained in Table 5-18 and Table 5-19.
Table 5-18 shows the information for the HCA2-O 12X IFB on z10 with the DB2 lock structure.
Table 5-18 System Managed Duplexing with HCA2-O 12X IFB on z10 - DB2 lock structure
|
Config
|
Prim Sync rate
|
Prim Sync resp time
|
Prim Async rate
|
Prim Async resp time
|
Secondry Sync rate
|
Secondry Sync resp time
|
Secondry Async rate
|
Secondry Async resp time
|
|
ICB4 z10
|
46.4
|
42
|
10022
|
76
|
46
|
44
|
10022
|
74
|
|
HCA2 z10
|
33.5
|
81.3
|
8073
|
116.5
|
33.8
|
82.1
|
8073
|
117.8
|
Table 5-19 shows the information for the HCA2-O 12X IFB on z10 with the IMS lock structure.
Table 5-19 System Managed Duplexing with HCA2-O 12X IFB on z10 - IMS lock structure
|
Config
|
Prim Sync rate
|
Prim Sync resp time
|
Prim Async rate
|
Prim Async resp time
|
Secondry Sync rate
|
Secondry Sync resp time
|
Secondry Async rate
|
Secondry Async resp time
|
|
ICB4 z10
|
29.7
|
36
|
7199
|
71
|
29.7
|
38
|
7199
|
68
|
|
HCA2 z10
|
25.2
|
71.4
|
6195
|
109.6
|
25.2
|
73.1
|
6195
|
109.0
|
As shown, there was a decrease in the rate of requests that were being processed synchronously. That decrease was caused by a sizeable increase in the average synchronous service time for both duplexed structures (both experienced an increase in average synchronous service time of about 40 microseconds.). That increase resulted in a decrease in the total number of requests that were processed, from 75,607 per second with ICB4 links, down to 71,810 with the HCA2-O 12X IFB links.
Recall from the simplex measurements that the HCA2-O 12X IFB links caused an increase in service times compared to ICB4 links. When using System Managed Duplexing, the impact is compounded by the fact that there are four interactions back and forth between the peer CFs. Thus, not only is the time to send the request to the CF increased, but also each of the interactions between the CFs also experiences an increase.
HCA2-O 12X IFB on z196
The next set of measurements were taken on the z196, using HCA2-O 12X IFB links. Given our experiences when we moved the workload to the z196 CF connected by HCA2-O 12X IFB links, we were expecting an improvement in overall performance, compared to the HCA2-O 12X IFB links on the z10. The results are summarized in Table 5-20 and Table 5-21 on page 147.
Table 5-20 HCA2-O 12X IFB on z196 System Managed Duplexing results
|
Link
type
|
Number
links to each CF
|
Number
CHPIDs to each CF
|
CF types
|
Total req rate
|
|
ICB4
|
2
|
2
|
z10
|
75607
|
|
HCA2-O
|
2
|
8
|
z10
|
71810
|
|
HCA2-O on z196
|
2
|
8
|
z196
|
74514
|
Table 5-21 shows the information for HCA2-O 12X IFB on z196 System Managed Duplexing for CF1 and CF2.
Table 5-21 HCA2-O 12X IFB on z196 System Managed Duplexing results for CF1 and CF2
|
Link
type/
CF CPU type
|
CF1 %
Util
|
CF1 Sync %
|
CF1 Sync serv time
|
CF1 Async %
|
CF1 Async serv time
|
CF2 % Util
|
CF2 Sync %
|
CF2 Sync serv time
|
CF2 Async %
|
CF2 Async serv time
|
|
|
ICB4
z10
|
33.2%
|
71.24
|
17
|
28.76
|
73.5
|
16.8%
|
0.44
|
42
|
99.56
|
72
|
|
|
HCA2-O z10
|
44.2%
|
67.3
|
21.5
|
32.7
|
104.2
|
16.4%
|
0.40
|
78.25
|
99.6
|
114
|
|
|
HCA2-O z196
|
43.1%
|
72.4
|
18
|
27.6
|
97
|
17.1%
|
0.41
|
65
|
99.59
|
102
|
We can make a number of observations at the CF level:
•The faster engine in the z196 helped by reducing both synchronous and asynchronous service times.
•The improved service times resulted in the workload generators sending more requests to the CF, up from 71,810 per second on the z10 to 74,514 on the z196. This is still less than were processed with the ICB4 on the z10, but it is line with the pattern we saw with the simplex HCA2-O 12X IFB links measurement, where the z196 HCA2-O 12X IFB measurements were closer to the ICB4 results than the HCA2-O 12X IFB on z10 results.
•When normalized for the relative capacities of the z10 and z196 CFs, there was a significant reduction in CF CPU utilization from 44.2% of the z10 CF capacity to the equivalent of 35% on that same CF when the workload was moved to the z196. This was despite an increase in the volume of requests being processed, compared to the HCA2-O 12X IFB on z10 measurement. This change reflects greater link layer efficiencies on the z196 than on the z10.
For a better understanding of the impact on System Managed Duplexing, Table 5-22 and Table 5-23 on page 148 show the results for the two duplexed structures.
Table 5-22 shows the information for System Managed Duplexing with HCA2-O 12X IFB on z196 with the DB2 lock structure.
Table 5-22 System Managed Duplexing with HCA2-O 12X IFB on z196: DB2 lock structure
|
Config
|
Prim Sync rate
|
Prim Sync resp time
|
Prim Async rate
|
Prim Async resp time
|
Secondry Sync rate
|
Secondry Sync resp time
|
Secondry Async rate
|
Secondry Async resp time
|
|
|
ICB4 z10
|
46.4
|
42
|
10022
|
76
|
46
|
44
|
10022
|
74
|
|
|
HCA2 z10
|
33.5
|
81.3
|
8073
|
116.5
|
33.8
|
82.1
|
8073
|
117.8
|
|
|
HCA2 z196
|
37.9
|
69
|
9085
|
101
|
37.6
|
69
|
9085
|
105
|
Table 5-23 shows the information for System Managed Duplexing with HCA2-O 12X IFB on z196 with the IMS lock structure.
Table 5-23 System Managed Duplexing with HCA2-O 12X IFB on z196 - IMS lock structure
|
Config
|
Prim Sync rate
|
Prim Sync resp time
|
Prim Async rate
|
Prim Async resp time
|
Secondry Sync rate
|
Secondry Sync resp time
|
Secondry Async rate
|
Secondry Async resp time
|
|
|
ICB4 z10
|
29.7
|
36
|
7199
|
71
|
29.7
|
38
|
7199
|
68
|
|
|
HCA2 z10
|
25.2
|
71.4
|
6195
|
109.6
|
25.2
|
73.1
|
6195
|
109.0
|
|
|
HCA2 z196
|
27.3
|
60
|
6758
|
92
|
27.3
|
59
|
6758
|
97
|
At the structure level, when compared to HCA2-O 12X IFB on the z10, HCA2-O 12X IFB on the z196 did noticeably better. The rate increased for both synchronous and asynchronous requests, all of the service times decreased by at least 10 microseconds, and the overall number of requests that was processed also increased.
Although the results are not yet equivalent to the performance observed when using the ICB4 links on z10, they are an improvement over HCA2-O 12X IFB on z10. The next step is to replace the HCA2-O 12X IFB adapters with HCA3-O 12X adapters and configure them to run in IFB3 mode.
HCA3-O 12X IFB3 mode on z196
The final set of System Managed Duplexing measurements that we undertook were of the same workload and configuration, except using HCA3-O 12X links in IFB3 mode in place of the HCA2-O 12X IFB links. The results at the CF level are summarized in Table 5-24 and Table 5-25 on page 149.
Table 5-24 HCA3-O 12X IFB3 on z196 System Managed Duplexing results
|
Link
type
|
Number
links to each CF
|
Number
CHPIDs to each CF
|
CF types
|
Total req rate
|
|
ICB4
|
2
|
2
|
z10
|
75607
|
|
HCA2-O
|
2
|
8
|
z10
|
71810
|
|
HCA2-O on z196
|
2
|
8
|
z196
|
74514
|
|
HCA3-O IFB3 on z196
|
2
|
8
|
z196
|
77467
|
Table 5-25 on page 149 shows the information for HCA3-O 12X IFB3 on z196 System Managed Duplexing for CF1 and CF2.
Table 5-25 HCA3-O 12X IFB3 on z196 System Managed Duplexing results for CF1 and CF2
|
Link
type/
CF CPU type
|
CF1 %
Util
|
CF1 Sync %
|
CF1 Sync serv time
|
CF1 Async %
|
CF1 Async serv time
|
CF2 % Util
|
CF2 Sync %
|
CF2 Sync serv time
|
CF2 Async %
|
CF2 Async serv time
|
|
|
ICB4
z10
|
33.2%
|
71.24
|
17
|
28.76
|
73.5
|
16.8%
|
0.44
|
42
|
99.56
|
72
|
|
|
HCA2-O
z10
|
44.2%
|
67.3
|
21.5
|
32.7
|
104.2
|
16.4%
|
0.40
|
78.25
|
99.6
|
114
|
|
|
HCA2-O z196
|
43.1%
|
72.4
|
18
|
27.6
|
97
|
17.1%
|
0.41
|
65
|
99.59
|
102
|
|
|
HCA3-O IFB3 z196
|
34.7%
|
76.25
|
9
|
23.75
|
70
|
15.7%
|
0.42
|
37
|
99.58
|
74
|
At the CF level, notice the following points:
•The number of requests being processed was up by nearly 4% compared to the HCA2-O 12X IFB on z196 run.
•The CF CPU utilization of CF1 was down by nearly 20%. The utilization of CF2 (which only handles requests to the secondary structures) was also down, although by a smaller amount. This is another indication that it is not only the link speed that affects CF CPU utilization, but a combination of link speed and workload mix.
•The average synchronous service time for CF1 was reduced by 50%. The average synchronous service time for CF2 was down by over 43%.
For a better understanding of the impact of the HCA3-O 12X IFB3 links on the duplexed structures, Table 5-26 and Table 5-27 on page 150 contain information about the two duplexed structures.
Table 5-26 shows the information for System Managed Duplexing with HCA3-O 12X in IFB3 mode on z196 with the DB2 lock structure.
Table 5-26 System Managed Duplexing with HCA3-O 12X in IFB3 mode on z196 - DB2 lock structure
|
Config
|
Prim Sync rate
|
Prim Sync resp time
|
Prim Async rate
|
Prim Async resp time
|
Secondry Sync rate
|
Secondry Sync resp time
|
Secondry Async rate
|
Secondry Async resp time
|
|
|
ICB4 z10
|
46.4
|
42
|
10022
|
76
|
46
|
44
|
10022
|
74
|
|
|
HCA2 z10
|
33.5
|
81.3
|
8073
|
116.5
|
33.8
|
82.1
|
8073
|
117.8
|
|
|
HCA2 z196
|
37.9
|
69
|
9085
|
101
|
37.6
|
69
|
9085
|
105
|
|
|
HCA3 IFB3 z196
|
45.3
|
37
|
10283
|
71
|
44.9
|
39
|
10283
|
76
|
Table 5-27 on page 150 shows the information for System Managed Duplexing with HCA3-O 12X in IFB3 mode on z196 with the IMS lock structure.
Table 5-27 System Managed Duplexing with HCA3-O 12X in IFB3 mode on z196: IMS lock structure
|
Config
|
Prim Sync rate
|
Prim Sync resp time
|
Prim Async rate
|
Prim Async resp time
|
Secondry Sync rate
|
Secondry Sync resp time
|
Secondry Async rate
|
Secondry Async resp time
|
|
|
ICB4 z10
|
29.7
|
36
|
7199
|
71
|
29.7
|
38
|
7199
|
68
|
|
|
HCA2 z10
|
25.2
|
71.4
|
6195
|
109.6
|
25.2
|
73.1
|
6195
|
109.0
|
|
|
HCA2 z196
|
27.3
|
60
|
6758
|
92
|
27.3
|
59
|
6758
|
97
|
|
|
HCA3 IFB3 z196
|
29.3
|
33
|
7126
|
66
|
29.2
|
34
|
7126
|
71
|
The results are the structure level are equally impressive:
•The rate for both synchronous and asynchronous requests increased again, compared to the HCA2-O 12X IFB links on z196 and were now equivalent to the request rate with the ICB4 links.
•All of the service times, both synchronous and asynchronous, for both structures were significantly improved compared to the HCA2-O 12X IFB on z196 run and the baseline ICB4 run.
Summary of System Managed Duplexing measurements
The following figures summarize the results for the various configurations for you in graphical format.
Figure 5-7 shows how the total request rate to the duplexed structures changed as the link type was changed.

Figure 5-7 Summary of duplexed structure average synchronous service times
Figure 5-8 shows how the average synchronous service time changed as the link types were changed.
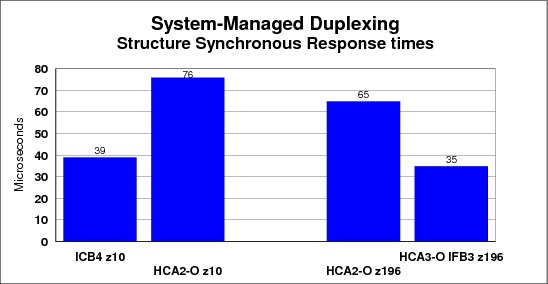
Figure 5-8 Summary of duplexed structure average synchronous service times
Although asynchronous service times tend to be less predictable and consistent because such a large percent of the duplexed requests were processed asynchronously, it is valuable to provide that information as well. The average asynchronous service times for each configuration are shown in Figure 5-9.
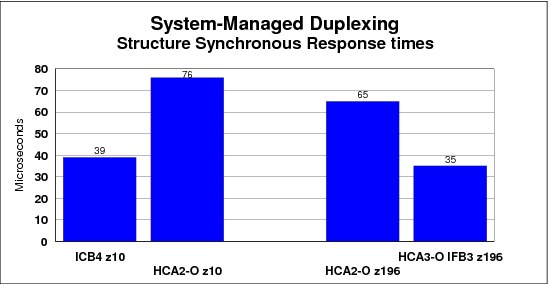
Figure 5-9 Summary of duplexed structure average asynchronous service times
If you are using ICB4 links and exploiting System Managed Duplexing today, there are a number of scenarios which might describe your environment:
•You are not duplexing many CF requests, or the service time of those requests is not critical for your workload.
In this case, the performance impact as you move to HCA2-O 12X IFB on z10 and then migrate to HCA2-O 12X IFB on z196 might be acceptable, so it will not be necessary to replace the HCA2-O 12X IFB links with HCA3-O 12X IFB3 links at this time.
•You are duplexing a large number of requests, and the service time of those requests is critical to meeting your online service time targets and your batch window deadlines.
In this case, you have two options:
– Provide a failure-isolated CF (such as a z114 or a z196) and discontinue duplexing for your lock structures. Turning off duplexing will result in a significant improvement in structures service times, regardless of the type of links that are being used. For example, a simplex lock request using ISC3 links (which are the slowest link type available) will have a better service time than a duplexed lock request using the fastest link type available.
Note that structure types that do not provide user-managed rebuild support will still need to be duplexed even if you have a failure-isolated CF. For more information, see the System Managed Duplexing white paper, available on the web at the following link:
– Try to minimize the time between the start of the migration to z196 and the time when all CPCs will have migrated to HCA3-O fanouts. If you have multiple CPCs, try to move the ones that contain the CFs to z196 first. You can then implement HCA3-O fanouts for communication between the peer CFs, and get the benefit of the better performance for those requests while you are waiting to move the remaining CPCs to z196.
The migration from legacy CF link technology to InfiniBand provides an opportunity to reevaluate your use of System Managed Duplexing and create a strategy for moving forward that will deliver the optimum performance and availability in the most cost-effective manner.
5.8 Summary
For clients that exploit high performance ICB4 links today, our results confirm the general IBM guidance that migrating from ICB4 links on a z10 to InfiniBand links on the z10 will result in elongated CF service times. However, replacing the z10 CF with a z196 CF can deliver performance improvements that bring the service times back into line with the ICB4 on z10 configuration. Completing the migration by replacing the HCA2-O 12X IFB links with HCA3-O 12X links running in IFB3 mode will deliver further performance benefits and bring the z/OS coupling cost back in line with z10/ICB4 levels.
Clients that are currently exploiting ISC3 links within a single data center can migrate to 12X InfiniBand links and experience significant performance improvements. Further, the migration can provide one or more of the following benefits:
•Better connectivity
•More flexibility
•Fewer links
•Reduced CF CPU utilization
Clients that are currently exploiting ISC3 links to connect across data centers can benefit from the ability to assign multiple CHPIDs to a single link and the greater number of link buffers that 1X links support8. This can result in a reduction in the number of coupling links that are required to connect the two sites (which means fewer fanouts and fewer DWDM ports) and possible performance improvements (depending on the distance between the sites).
1 Various CF requests (XCF and secondary DB2 GBP, for example) are specifically issued as asynchronous requests and XES does not change an asynchronous request to make it synchronous, regardless of the actual service times.
2 In a production environment, all structure types would normally be spread across the available CFs to achieve a balanced configuration and meet performance and availability objectives.
3 To minimize the performance impact of sending the signal over a larger distance than necessary, we suggest using cables that are close to the actual distance between the z/OS and CF CPCs. The InfiniBand 12X cables we used in our measurements were 25 feet (about 7.5 meters) long, and the 1X cables were 50 feet (15 meters) long.
4 In our measurements, the increase was about 29%, a little less than rule of thumb of 40% that is used for planning purposes.
5 To deliver consistent service times, CF utilization should not exceed about 70%. Assuming that your workload is balanced across the available CFs, running a CF at 52% busy would indicate that the combined utilization in case of the unavailability of one CF would be close to 100%.
6 It is advisable to order HCA3-O fanouts rather than HCA2-O fanouts when ordering 12X links on any CPC that supports both options.
7 HCA2-O LR 1X CHPIDs also have 32 link buffers when used with Driver 93 or later.
8 When used with Driver 93 or later and connected to a CPC that is also running Driver 93 or later.
..................Content has been hidden....................
You can't read the all page of ebook, please click here login for view all page.