CHAPTER
11
Allocations Using Calculation Manager
General Ledger allocations are components of the financial period closing cycle, along with revaluation, management of historical rates, and other activities that take place before, during, and after period close. Although the period-close process is covered in the chapters that follow, we felt that the readers will benefit from covering the subject of allocations on its own.
To that end, we’ll go through an easy-to-follow, step-by-step example, but before we do that, we’ll provide an overview of what allocations are and the business motivation for their use, as well as some technical and system architecture background required to understand what is underpinning the allocations’ functionality.
Overview of GL Allocations
We often think of allocations as the process of cost sharing. For example, a business might allocate or spread the cost of a large item expense like an advertising campaign across multiple lines of business, departments, or cost centers that benefit from using that item (Figure 11-1). More broadly, in this book we are going to refer to allocation as the process of spreading of expenses or revenues across an organizational hierarchy like a group of cost centers, departments, divisions, and so on.

FIGURE 11-1. Allocation of cost incurred at HQ divided equally across departments
Here are a couple of examples related to the banking narrative discussed throughout this book. ACME Global Markets, Inc., may decide to bear the cost of development of a trading platform that will be used by its fixed income, foreign exchange, equity, and other trading teams. In our example organization structure, these trading teams belong to ACME Global Markets LOB (line of business) and they are also assigned to individual cost centers. In order to hold cost center and LOB managers more accountable for profit and loss, the company’s management may decide to track the trading platform development on the cost center level by proportionally allocating the cost of development to individual cost centers associated with different trading teams. The proportionality of allocations can be based on previously agreed criteria such as turnover, headcount, or even a complex formula-based calculation.
The allocations do not necessarily have to be cost related. For example, the previously mentioned trading teams may need to be allocated trading funds at the beginning of each accounting period from a central trading pool of funds. They use these funds to carry out their trading activities, but in order to manage the risks, the management may decide to allocate the trading funds to the individual teams based on the trading team’s experience, past performance, volatility of returns, and other criteria, with the aim of reducing the risk. This is a slightly different use case than cost allocation, but the pattern is still the same; we traverse an organizational hierarchy with the aim of allocating the funds based on defined criteria from some account that is controlled centrally.
Business Motivation for Using Allocations
Cost management is an activity typically associated with business operations on LOB, department, and cost center levels. In today’s world of somewhat stalled top-line growth, there is an ever-increasing need for efficient cost management, and both finance and IT play important roles in capturing adequate data for analysis.
As we have seen in the previous section, there are also other types of allocations that are good candidates for automation, and business drivers for allocation can vary from risk management to various types of reporting requirements.
The allocation procedures can be very complex, and executing that process manually can be not only just cumbersome and slow, but also prone to errors, which can have a profound impact on business reporting efficiency and accuracy.
Automation of the allocation process can contribute to a greater efficiency, as well as enforcing the governance of applying the allocation rules as per agreed-upon business strategy and goals. IT and finance departments are typically responsible to deploy, make operational, and administer automated allocation processes. The role of technology is very important, and products like Fusion Financials come with out-of-the box tools to help companies avoid relying on offline tools for allocations such as spreadsheets.
Relationship to Allocations’ Functionality in Other Oracle Products
Most ERP products out there have functionality to generate recurring and allocation GL journals. In Oracle E-Business Suite (EBS), the corresponding allocation functionality is referred to as Mass Allocations, while in Oracle Enterprise Performance Management (formerly Hyperion EPM), allocations are set up in the Calculation Manager module.
In Fusion Financials, EPM Calculation Manager is incorporated in the technology stack and completely replaces EBS Mass Allocations. In some Oracle documentation and articles, this functionality is also referred to as Allocation Manager; whatever the name, the bottom line is that generation of allocations in Fusion Financials now leverages Oracle Essbase, and from a technology standpoint it is very different in comparison to EBS.
In this chapter we’ll go through a detailed example of allocation journal definition and generation, but before we do that, let’s brush up on some key technology and Essbase concepts.
The Allocations Process and Oracle Essbase Cube
Fusion General Ledger leverages Oracle Essbase, which was known as Hyperion Essbase, to store balances in a multidimensional database (MDB). MDBs are often used to build analytic applications that support multidimensional queries, often referred to as online analytical processing (OLAP).
However, balances and journal entries are also processed, generated, and stored in Oracle Relational Database using a more traditional online transaction processing (OLTP) approach. In Fusion Financials, most reporting activities are performed against GL Essbase cubes rather than relational tables in Oracle Database.
The reason for this hybrid architectural approach is that balances in Essbase can be preaggregated on every dimension level and hierarchy, which allows accounting data to be analyzed more quickly using numerous analytical tools from the Hyperion product offerings. For example, end users can perform a slice-and-dice type of data analysis using the Hyperion Smart View add-on in Microsoft Excel or directly in Fusion General Ledger application screens.

NOTE
The detailed technical reasoning behind architectural choices is outside the scope of this book. Reporting will be covered in subsequent chapters and will give more insight into how Fusion Financials leverages Hyperion, Fusion Middleware, and the Oracle Database tech stack.
High-Level Allocation Journals Generation Process Flow
In previous chapters we mentioned that when we configure and create a general ledger in the Fusion General Ledger application, an Essbase cube automatically gets created for each combination of CoA instance and Accounting Calendar as defined in the GL setup.
From a technical perspective, the process of generating allocation journals is different than in Oracle E-Business Suite in that it is driven by Hyperion Calculation Manager and Allocation Engine as depicted in Figure 11-2. Preaggregated balances in Essbase Cube serve as the source for generation of allocation journals, and integration with Enterprise Scheduler Service (ESS) jobs to import and post journals back into Oracle Relational Database is seamless and doesn’t require manual intervention.

FIGURE 11-2. Generation of allocation GL journals in Fusion General Ledger
Multidimensional View of GL Balances
In this section we’ll just briefly review some key Oracle Essbase concepts applicable for OLAP-oriented databases and relate those concepts to Fusion General Ledger.
Essbase is a general-purpose multidimensional database developed to address the scalability issues associated with spreadsheet software. Figure 11-3 illustrates this concept; for example, we consider financial data like product and/or services sales and expenses across accounting periods Jan-14 to Mar-14 recorded in a single spreadsheet. If we need to break down the same data across different legal entities like ACME Insurance Holding, ACME Mortgage Inc, and ACME Commercial Finance, then we have multiple spreadsheets, which starts looking like a cube. This gives rise to the idea of multidimensional databases like Oracle Essbase that structure data as the end user uses it in the real world.

FIGURE 11-3. Multidimensional view of financial data
In the multidimensional model, data is described through measures based on dimensions that represent facts. The individual values that dimensions are made up of are called members, and they can be organized to form hierarchies to describe different structural relationships between members within a dimension.
In our example from Figure 11-3, the cube consists of three dimensions:
![]() Accounting Periods dimension consisting of Jan-14, Feb-14, Mar-14, and Apr-14 members.
Accounting Periods dimension consisting of Jan-14, Feb-14, Mar-14, and Apr-14 members.
![]() Legal Entities dimension consisting of ACME Commercial Finance, ACME Mortgage Inc, and ACME Insurance Holding members.
Legal Entities dimension consisting of ACME Commercial Finance, ACME Mortgage Inc, and ACME Insurance Holding members.
![]() Account dimension consisting of Sales Account and Expenses Account members.
Account dimension consisting of Sales Account and Expenses Account members.
The measures in the GL cube are account balances, which in Fusion GL are updated in real time by the GL Journal Post program.
Typical operations in a multidimensional data model are
![]() Slice and dice Defines a subcube data selection; for example, expense account balances for ACME Mortgage Inc company (legal entity) during the Jan-14 and Feb-14 accounting periods. If we select a member from a dimension (for example, ACME Mortgage Inc), the remaining two dimensions (natural account and accounting period in this example) define a spreadsheet, also known as slice. On the other hand, if we select a range of legal entity members like ACME Commercial Finance, ACME Mortgage Inc, and ACME Insurance Holding members along with the remaining two dimensions (natural account and accounting period), the selection defines a subcube, also known as dice, with dimensions restricted to a selected range of members.
Slice and dice Defines a subcube data selection; for example, expense account balances for ACME Mortgage Inc company (legal entity) during the Jan-14 and Feb-14 accounting periods. If we select a member from a dimension (for example, ACME Mortgage Inc), the remaining two dimensions (natural account and accounting period in this example) define a spreadsheet, also known as slice. On the other hand, if we select a range of legal entity members like ACME Commercial Finance, ACME Mortgage Inc, and ACME Insurance Holding members along with the remaining two dimensions (natural account and accounting period), the selection defines a subcube, also known as dice, with dimensions restricted to a selected range of members.
![]() Roll-up and drill-down Defines aggregation of data within the dimension hierarchy. For example, a financial year consists of four quarters and individual accounting period members like Jan-14, Feb-14, and Mar-14, which can be rolled up into Q1-14. Rolling up summarizes the data by walking the dimension hierarchy upward, while drill-down is the reverse of roll-up. In drill-down we walk down the hierarchy from less detailed to more detailed data (for example, Q1-14 -> Jan-14, Feb-14, Mar-14, and so on).
Roll-up and drill-down Defines aggregation of data within the dimension hierarchy. For example, a financial year consists of four quarters and individual accounting period members like Jan-14, Feb-14, and Mar-14, which can be rolled up into Q1-14. Rolling up summarizes the data by walking the dimension hierarchy upward, while drill-down is the reverse of roll-up. In drill-down we walk down the hierarchy from less detailed to more detailed data (for example, Q1-14 -> Jan-14, Feb-14, Mar-14, and so on).
In Table 11-1 we list for reference purposes the GL cube dimensions that are available in Fusion GL and documented in the Oracle Fusion Applications Financials Implementation Guide for creating financial reports and allocations using Essbase multidimensional cubes.


TABLE 11-1. List of Dimensions in GL Cube as Documented in Oracle Product Documentation
In the next section we’ll go through a detailed example of sample allocation creation and generation.
Step-by-Step Example
Our example will demonstrate how to create an allocation rule and generate corresponding allocation journals. Before going through the setup, let’s define the business requirements for the exercise.
Business Requirements and Accounts Setup
ACME Global Markets USA line of business has four departments that are also separate cost centers along with the Central Trading cost center, which is designated as a central pool:
![]() Central Trading (Cost Center 8000)
Central Trading (Cost Center 8000)
![]() Fixed Income Trading (Cost Center 8100)
Fixed Income Trading (Cost Center 8100)
![]() Foreign Exchange Trading (Cost Center 8200)
Foreign Exchange Trading (Cost Center 8200)
![]() Commodities Trading (Cost Center 8300)
Commodities Trading (Cost Center 8300)
![]() Equity Trading (Cost Center 8400)
Equity Trading (Cost Center 8400)
All trading departments use the same software platform for their trading activities, and management decided to divide the license fee cost based on the number of employees in each department. To meet that requirement, the finance department created the following natural accounts: 57360 (Expense Related to Trading Software License), 79000 (Trading Software Licenses), and 19000 (Cash Account).
Account 79000 is defined as a statistical account to hold the department headcount.
NOTE
Fusion General Ledger lets us maintain statistical as well as monetary balances in an account. In our example, the account combination 13.201.8100.79000.00.00000 is assigned Debit (DR) value 10 to represent the headcount in the Fixed Income Trading department.
Finance department accountants came up with the following accounting journal transactions required for allocations:


After completing the allocation setup, we should post the following journal entries and test the setup:

Cost Center Hierarchy Creation Prerequisite
Before creating an allocation rule using Calculation Manager, we need to create a cost center hierarchy to encompass cost centers 8100, 8200, 8300, and 8400 under a parent value that we arbitrarily called “TRAD.”
Prior to creating the hierarchy, we create the value TRAD in the ACME Cost Centre value set code.
To do that, we go to the Manage Value Set task, query and select the ACME Cost Centre value set, click the Manage Values button, and make sure that the TRAD value is created with the Summary attribute set to Yes as shown in Figure 11-4.

FIGURE 11-4. Parent value TRAD set up in ACME Cost Centre value set
To define account hierarchies, we use the Manage Trees And Tree Versions task. Here we create the ACME Cost Centre tree as illustrated in Figure 11-5.

FIGURE 11-5. Creating the Cost Centre tree hierarchy
After creation the tree needs to be audited (online audit is OK for this exercise) and set to Active status from the Actions menu.
Now we go to the Publish Account Hierarchies task, select ACME Cost Centre (Version1) hierarchy, and publish it to an Essbase cube as shown in Figure 11-6.

FIGURE 11-6. Publishing the Cost Centre hierarchy
We are now ready to proceed with allocation rule creation as per the business requirements.
Allocation Rule Creation Walkthrough
Allocation rules are created in the EPM System Workspace application, which is fully embedded in Fusion Applications. There are different navigation paths to reach its user interface, and in our installation, we navigate to General Accounting Dashboard | Manage Journals | Create Allocation Rules. Once in EPM System Workspace, we click the Navigate menu item and hover the mouse pointer above the Application item until Calculation Manager appears.
TIP
You have to use Internet Explorer to use EPM System Workspace. In current releases, it is a bit tricky to select the Calculation Manager application; click the Navigate menu item, and hover the mouse pointer up and down until Calculation Manager shows up.
Expand ACMEGlobalCOAInstance as shown in Figure 11-7 and create an allocation rule by right-clicking Rules | New. This should result in the Rule Designer tool being open in your browser. Follow the steps outlined next to create a rule we called Test_Alloc_1 in this exercise:

FIGURE 11-7. Point of View values
1. In Rules Designer, in the New Objects section, drag and drop the Point Of View object between Begin and End nodes. Specify values for dimensions as shown in Figure 11-7.
In Point Of View (POV) we define dimension values that remain fixed for this rule (see the previous section on cube operations).
2. Drag Allocation from the New Objects section and drop it between Point Of View nodes in the Rule Designer. Click the Next button and enter values for Source as shown in Figure 11-8.

FIGURE 11-8. Source values in the Allocate Wizard
Source usually points to the central account or pool balance from which the balance amount is allocated. In our case, that is Central Trading Cost Centre 8000 and natural account 57360.
3. Next we enter the allocation range as shown in Figure 11-9.

FIGURE 11-9. Entering the allocation range
The allocation range specifies the range of values where amounts should be allocated. These values are parent values, and in our example, we specify TRAD Cost Centre as the parent value.
4. Next, we enter target values as shown in Figure 11-10.

FIGURE 11-10. Entering target values
In our example, the target account is 57360. For expenses, the target is the debit side of the allocation.
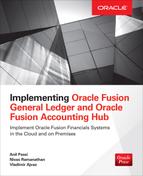
5. Next, we enter an offset value as shown in Figure 11-11.
FIGURE 11-11. Entering offset values
Offset for expense allocations is the credit side of the transaction.
NOTE
We are not excluding any members from the allocation range; therefore, we skip the Exclude step.
6. Next, we define the basis of the allocation as shown in Figure 11-12.

FIGURE 11-12. Entering the basis for allocation
In our example, the basis for allocation is statistical account 79000, where we keep the department headcount. Please note that Currency is defined as “STAT.” We click the Next, Finish, and Save buttons and then Validate And Deploy. If there are no issues, the rule is deployed and ready to be used.
NOTE
We have hard-coded the AccountPeriod value to Jan-14, which is the only open period in our development instance. However, in the real world, you would create a run-time prompt variable that will allow you to pick an accounting period as required at run time.
Generate Allocation Journals
To execute the rule we have just created, on our installation we navigate to General Accounting Dashboard | Manage Journals | Generate General Ledger Allocations and run the TEST_ALLOC_1 rule as illustrated in Figure 11-13.

FIGURE 11-13. Running the allocation rule and system-generated allocation journal
Summary
In this chapter we provided an overview of allocations and the business motivation for using allocations in Fusion General Ledger. We anticipate that the readers with an Oracle E-Business Suite background will benefit from comparison to the Mass Allocation feature in that product, as well as a gentle introduction to Oracle Essbase basic concepts, as an introduction to the hands-on example at the end of this chapter.