

Optimization of an IBM AIX operating system
In this chapter we discuss performance considerations on AIX. We also describe some basic general tuning for AIX. Some tuning may not apply to all workloads. It is important to check best practices documentation and guidelines for each type of workload (database, web server, fileserver) and follow the recommendations for each product.
We show parameters that can be changed in AIX and features that can be enabled:
4.1 Processor folding, Active System Optimizer, and simultaneous multithreading
In this section we discuss some concepts related to processor performance in AIX.
4.1.1 Active System Optimizer
Active System Optimizer (ASO) is an AIX feature introduced in AIX 6.1 TL7 and AIX 7.1 TL1, which monitors and dynamically optimizes the system. ASO needs POWER7 hardware running in POWER7 mode. For more information, refer to 6.1.2, “IBM AIX Dynamic System Optimizer” on page 288.
4.1.2 Simultaneous multithreading (SMT)
First referred to as SMT with the introduction of POWER5. Prior to that, a previous incarnation of SMT was known as HMT (or hardware multithreading). There are many sources of information regarding SMT, some of which we reference later. This section complements these existing sources by highlighting some key areas and illustrating some scenarios when hosting them on the POWER7 platform.
POWER5, POWER6 and POWER7
The implementation of SMT has matured and evolved through each generation. It is important to understand which SMT component is provided by a given platform, but equally how it differs from the implementations in other generations. Such understanding can be critical when planning to migrate existing workloads from older hardware onto POWER7.
For example, both POWER5 and POWER6 provide SMT2 (although remember that prior to POWER7, it was just referred to as SMT). However, while there is no difference in naming to suggest otherwise, the implementation of SMT2 is significantly different between the two platforms. Similarly, SMT4 is not simply a parallel implementation of SMT2.
A confusion can easily arise between the acronyms of SMT and Symmetric Multi Processing (SMP). As we demonstrate in “SMT4” on page 120, inefficiencies can be introduced by confusing the two.
For a detailed comparison of the three implementations of SMT, refer to 2.14.1 of IBM PowerVM Introduction and Configuration, SG24-7940.
SMT4
An important characteristic of SMT4 is that the four hardware threads are ordered in a priority hierarchy. That is, for each core or virtual processor, there is one primary hardware thread, one secondary hardware thread, and two tertiary hardware threads in SMT4 mode. This means that work will not be allocated to the secondary threads until consumption of the primary threads exceeds a threshold (controlled by schedo options); similarly the tertiary threads will not have work scheduled to them until enough workload exists to drive the primary and secondary threads. This priority hierarchy provides best raw application throughput on POWER7 and POWER7+. Thus the default AIX dispatching behavior is to dispatch across primary threads and then pack across the secondary and tertiary threads.
However, it is possible to negate or influence the efficiency offered by SMT4, through suboptimal LPAR profile configuration. Also, the default AIX dispatching behavior can be changed via schedo options, which are discussed in 4.1.4, “Scaled throughput” on page 124.
|
Note: The following scenario illustrates how inefficiencies can be introduced. There are other elements of PowerVM such as processor folding, Active System Optimizer (ASO), and power saving features that can provide compensation against such issues.
|
An existing workload is hosted on a POWER6-based LPAR, running AIX 6.1 TL02. The uncapped LPAR is configured to have two virtual processors (VP) and 4 GB of RAM. The LPAR is backed up and restored to a new POWER7 server and the LPAR profile is recreated with the same uncapped/2 VP settings as before. All other processor settings in the new LPAR profile are default.
At a later date, the POWER7-based LPAR is migrated from AIX6.1 TL02 to AIX6.1 TL07. On reboot, the LPAR automatically switches from SMT2 to SMT4 due to the higher AIX level allowing the LPAR to switch from POWER6+™ to POWER7 compatibility mode.
To illustrate this we used a WMB workload. Figure 4-1 shows how the application is only using two of the eight available threads.
Figure 4-1 WMB workload with two VPs and SMT4
Reconfiguring the LPAR to have only a single VP (Figure 4-2) shows that the WMB workload is using the same amount of resource, but now more efficiently within one core. In our example, we were able to achieve a comparable throughput with one VP as with two VPs. AIX would only have to manage two idle threads, not six, so the resource allocation would be more optimal in that respect.

Figure 4-2 WMB workload with one VP and SMT4
Scaling the WMB workload to produce double the footprint in the same processor constraints again demonstrated similar efficient distribution. Figure 4-3 on page 122 illustrates the difference in consumption across the four SMT threads.

Figure 4-3 Increased WMB workload with one VP and SMT4
However, the throughput recorded using this larger footprint was around 90% less with one VP than with two VPs because the greater workload consumed the maximum capacity at some times. Remember that even if an LPAR is configured as uncapped, the amount of extra entitlement it can request is limited by the number of VPs. So one VP allows up to 1.0 units of allocation.
We observed that other smaller workloads could not take advantage of the larger number of SMT threads, thus it was more efficient to reconfigure the LPAR profile to have fewer VPs (potential example of our NIM server). Allocating what is required is the best approach compared to over-allocating based on a legacy viewpoint. Fewer idle SMT threads or VPs is less overhead for the hypervisor too. Just because your old POWER5-based LPAR had four dedicated processors, it does not always follow that your POWER7-based LPAR requires the same.
Where workloads or LPARs will be migrated from previous platform generations, spending time evaluating and understanding your workload footprint is important; investing time post-migrating is equally important. Regular monitoring of LPAR activity will help build a profile of resource usage to help assess the efficiency of your configuration and also will allow detection of footprint growth. While it is common for an LPAR to be allocated too many resources, it is also common for footprint growth to go undetected.
It is primarily beneficial in commercial environments where the speed of an individual transaction is not as important as the total number of transactions that are performed. Simultaneous multithreading is expected to increase the throughput of workloads with large or frequently changing working sets, such as database servers and web servers.
Workloads that do not benefit much from simultaneous multithreading are those in which the majority of individual software threads uses a large amount of any specific resource in the processor or memory. For example, workloads that are floating-point intensive are likely to gain little from simultaneous multithreading and are the ones most likely to lose performance.
AIX allows you to control the mode of the partition for simultaneous multithreading with the smtctl command. By default, AIX enables simultaneous multithreading.
In Example 4-1, in the smtctl output, we can see that SMT is enabled and the mode is SMT4. There are two virtual processors, proc0 and proc4, and four logical processors associated with each virtual one, giving a total of eight logical processors.
Example 4-1 Verifying that SMT is enabled and what the mode is
# smtctl
This system is SMT capable.
This system supports up to 4 SMT threads per processor.
SMT is currently enabled.
SMT boot mode is set to enabled.
SMT threads are bound to the same virtual processor.
proc0 has 4 SMT threads.
Bind processor 0 is bound with proc0
Bind processor 1 is bound with proc0
Bind processor 2 is bound with proc0
Bind processor 3 is bound with proc0
proc4 has 4 SMT threads.
Bind processor 4 is bound with proc4
Bind processor 5 is bound with proc4
Bind processor 6 is bound with proc4
Bind processor 7 is bound with proc4
4.1.3 Processor folding
On a shared-processor LPAR, AIX monitors the utilization of virtual processors. It watches each virtual processor and the LPAR as a whole. By default AIX will take action when the aggregate utilization drops below 49% (schedo option vpm_fold_threshold). When current load drops below this threshold, AIX will start folding away virtual processors to make more efficient use of fewer resources. The opposite reaction occurs when the workload increases and breaches the 49% threshold, in which case AIX dynamically unfolds virtual processors to accommodate the increased load.
The aim of this feature is to improve efficiency of thread and virtual processor usage within the LPAR. The folding and unfolding encourages the LPAR to make best use of its processing resources. Improved performance is achieved by attempting to reduce cache misses in the physical processors by efficiently distributing the processes.
Thus, processor folding is a feature introduced in AIX 5.3 ML3 that allows the kernel scheduler to dynamically increase and decrease the use of virtual processors. During low workload demand, some virtual processors are deactivated. Every second, the kernel scheduler evaluates the number of virtual processors that should be activated to accommodate the physical utilization of the partition.
When virtual processors are deactivated, they are not removed from the partition as with dynamic LPAR. The virtual processor is no longer a candidate to run on or receive unbound work; however, it can still run bound jobs. The number of online logical processors and online virtual processors that are visible to the user or applications does not change. There are no impacts to the middleware or the applications running on the system.
Some benefits of processor folding are:
•Better processor affinity
•Less overhead to the hypervisor due to lower number of context switches
•Less virtual processors being dispatched in physical processors implies more physical processors available to other partitions
•Improved energy resources consumption when the processors are idle
Processor folding is enabled by default. In specific situations where you do not want to have the system folding and unfolding all the time, the behavior can be controlled using the schedo command to modify the vpm_xvcpus tunable.
To determine whether or not processor folding is enabled, use the command shown in Example 4-2.
Example 4-2 How to check whether processor folding is enabled
# schedo -o vpm_xvcpus
vpm_xvcpus = 0
If vpm_xvcpus is greater than or equal to zero, processor folding is enabled. Otherwise, if it is equal to -1, folding is disabled. The command to enable is shown in Example 4-3.
Example 4-3 How to enable processor folding
# schedo -o vpm_xvcpus=0
Setting vpm_xvcpus to 0
Each virtual processor can consume a maximum of one physical processor. The number of virtual processors needed is determined by calculating the sum of the physical processor utilization and the value of the vpm_xvcpus tunable, as shown in the following equation:
Number of virtual processors needed = roundup (physical processor utilization) + vpm_xvcpus
If the number of virtual processors needed is less than the current number of enabled virtual processors, a virtual processor is disabled. If the number of virtual processors needed is greater than the current number of enabled virtual processors, a disabled virtual processor is enabled. Threads that are attached to a disabled virtual processor are still allowed to run on it.
Currently, there is no way to monitor the folding behavior on an AIX partition. The nmon tool does some attempt to track VP folding behavior based on the measured processor utilization but again, that is an estimation, not a value reported by any system component.
|
Important: Folding is available for both dedicated and shared mode partitions. On AIX 7.1, folding is disabled for dedicated-mode partitions and enabled for shared-mode.
|
4.1.4 Scaled throughput
This setting is an alternative dispatcher scheduling mechanism introduced with AIX 6.1 TL08 and AIX 7.1 TL02; the new logic affects how AIX utilizes SMT threads and directly dictates how and when folded VPs will be unfolded. This feature was added based on client requirements and is controlled by a schedo tunable. Therefore, it is enabled on an LPAR, by LPAR basis.
The implication of enabling this tunable is that AIX will utilize all SMT threads on a given VP before unfolding additional VPs. The characteristics we observed during tests are best described as a more scientific, controlled approach to what we achieved by forceably reducing VP allocation in “SMT4” on page 120.
The scaled_throughput_mode tunable has four settings: 0, 1, 2 and 4. A value of 0 is the default and disables the tunable. The three other settings enable the feature and dictate the desired level of SMT exploitation (that is SMT1, SMT2, or SMT4).
We tested the feature using our WebSphere Message Broker workload, running on an AIX 7.1 TL02 LPAR configured with four VPs. Two sizes of Message Broker workload were profiled to see what difference would be observed by running with two or four application threads.
Table 4-1 Message Broker scaled_throughput_mode results
|
|
0
|
1
|
2
|
4
|
|
TPS for four WMB threads
|
409.46
|
286.44
|
208.08
|
243.06
|
|
Perf per core
|
127.96
|
149.18
|
208.08
|
243.06
|
|
TPS for two WMB threads
|
235.00
|
215.28
|
177.55
|
177.43
|
|
Perf per core
|
120.51
|
130.47
|
177.55
|
177.43
|
Table 4-1details the statistics from the eight iterations. In both cases the TPS declined as utilization increased. In the case of the 4-thread workload the trade-off was a 41% decline in throughput against an 89% increase in core efficiency. Whereas for the 2-thread workload it was a 25% decline in throughput against a 47% increase in core efficiency.
So the benefit of implementing this feature is increased core throughput, because AIX maximizes SMT thread utilization before dispatching to additional VPs. But this increased utilization is at the expense of overall performance. However, the tunable will allow aggressively dense server consolidation; another potential use case would be to implement this feature on low load, small footprint LPARs of a noncritical nature, reducing the hypervisor overhead for managing the LPAR and making more system resources available for more demanding LPARs.
|
Note: Use of the scaled_throughput_mode tunable should only be implemented after understanding the implications. While it is not a restricted schedo tunable, we strongly suggest only using it under the guidance of IBM Support.
|
4.2 Memory
Similar to other operating systems, AIX utilizes virtual memory. This allows the memory footprint of workloads to be greater than the physical memory allocated to the LPAR. This virtual memory is composed of several devices with different technology:
•Real Memory - Composed of physical memory DIMMs (SDRAM or DDRAM)
•Paging device - One or more devices hosted on storage (SATA, FC, SSD, or SAN)
Size of virtual memory = size of real memory + size of paging devices
All memory pages allocated by processes are located in real memory. When the amount of free physical memory reaches a certain threshold, the virtual memory manager (VMM) through the page-replacement algorithm will search for some pages to be evicted from RAM and sent to paging devices (this operation is called paging out). If a program needs to access a memory page located on a paging device (hard disk), this page needs to be first copied back to the real memory (paging in).
Because of the technology difference between real memory (RAM) and paging devices (hard disks), the time to access a page is much slower when it is located on paging space and needs a disk I/O to be paged in to the real memory. Paging activity is one of the most common reasons for performance degradation.
Example 4-4 Monitoring paging activity with vmstat
{D-PW2k2-lpar1:root}/ #vmstat -w 2
kthr memory page faults cpu
------- --------------------- ------------------------------------ ------------------ -----------
r b avm fre re pi po fr sr cy in sy cs us sy id wa
1 0 12121859 655411 0 0 0 0 0 0 2 19588 3761 4 0 95 0
2 0 12387502 389768 0 0 0 0 0 0 1 13877 3731 4 0 95 0
1 0 12652613 124561 0 46 0 0 0 0 48 19580 3886 4 1 95 0
3 9 12834625 80095 0 59 54301 81898 586695 0 13634 9323 14718 3 10 78 9
2 13 12936506 82780 0 18 50349 53034 52856 0 16557 223 19123 2 6 77 16
1 18 13046280 76018 0 31 49768 54040 53937 0 16139 210 20793 2 6 77 16
2 19 13145505 81261 0 33 51443 48306 48243 0 16913 133 19889 1 5 77 17
With vmstat, the paging activity can be monitored by looking at the column po (number of pagings out per second) and pi (number of pagings in per second).

Figure 4-4 Monitoring paging activity with nmon
In Figure 4-4, we started nmon in interactive mode. We can monitor the number of paging in and out by looking at the values in to Paging Space in and out. This number is given in pages per second.
4.2.1 AIX vmo settings
The AIX virtual memory is partitioned into segments sized 256 MB (default segment size) or 1 TB. Note that 1 TB segment size is only used for 16 GB huge pages, and is similar but a different concept from what is mentioned in 4.2.3, “One TB segment aliasing” on page 129, which still uses a 256 MB segment size.
Depending on the backing storage type, the virtual memory segments can be classified into three types, as described in Table 4-2.
Table 4-2 VMM segments classification depending on backing storage
|
Segment type
|
Definition
|
|
Persistent
|
The pages of persistent segments have permanent storage locations on disk (JFS file systems). The persistent segments are used for file caching of JFS file systems.
|
|
Client
|
The client segments also have permanent storage locations, which are backed by a JFS2, CD-ROM file system, or remote file systems such as NFS. The client segments are used for file caching of those file systems.
|
|
Working
|
Working segments are transitory and exist only during their use by a process. They have no permanent disk storage location and are stored on paging space when they are paged out.
Typical working segments include process private segments (data, BSS, stack, u-block, heap), shared data segments (shmat or mmap), shared libary data segments, and so on. The kernel segments are also classified as working segments.
|
Computation memory, also known as computational pages, consists of the pages that belong to working segments or program text (executable files or shared libary files) segments.
File memory, also known as file pages or non-computation memory, consists of the remaining pages. These are usually pages belonging to client segments or persistent segments.
Some AIX tunable parameter can be modified via the vmo command to change the behavior of the VMM such as:
•Change the threshold to start or stop the page-replacement algorithm.
•Give more or less priority for the file pages to stay in physical memory compared to computational pages.
Since AIX 6.1, the default values of some vmo tunables were updated to fit most workloads. Refer to Table 4-3.
Table 4-3 vmo parameters: AIX 5.3 defaults vs. AIX 6.1 defaults
|
AIX 5.3 defaults
|
AIX 6.1/7.1 defaults
|
|
minperm% = 20
maxperm% = 80
maxclient% = 80
strict_maxperm = 0
strict_maxclient = 1
lru_file_repage = 1
page_steal_methode = 0
|
minperm% = 3
maxperm% = 90
maxclient% = 90
strict_maxperm = 0
strict_maxclient = 1
lru_file_repage = 0
page_steal_methode = 1
|
With these new parameters, VMM gives more priority to the computational pages to stay in the real memory and avoid paging. When the page replacement algorithm starts, it steals only the file pages as long as the percentage of file pages in memory is above minperm%, regardless of the repage rate. This is controlled by the vmo parameter lru_file_repage=0 and it guarantees 97% memory (minperm%=3) for computational pages. If the percentage of file pages drops below minperm%, both file and computational pages might be stolen.
|
Note: In the new version of AIX 7.1, lru_file_repage=0 is still the default, but this parameter disappears from the vmo tunables and cannot be changed any more.
|
The memory percentage used by the file pages can be monitored with nmon by looking at the value numperm, as shown in Figure 4-4 on page 126.
The page_steal_method=1 specification improves the efficiency of the page replacement algorithm by maintaining several lists of pages (computational pages, file pages, and workload manager class). When used with lru_file_repage=0, the page replacement algorithm can directly find file pages by looking at the corresponding list instead of searching in the entire page frame table. This reduces the number of scanned pages compared to freed pages (scan to free ratio).
The number of pages scanned and freed can be monitored in vmstat by looking at the sr column (pages scanned) and fr column (pages freed). In nmon, these values are reported by Pages Scans and Pages Steals. Usually, with page_steal_method=1, the ratio
Pages scanned to Pages freed should be between 1 and 2.
|
Conclusion: On new systems (AIX 6.1 and later), default parameters are usually good enough for the majority of the workloads. If you migrate your system from AIX 5.3, undo your old changes to vmo tunables indicated in /etc/tunables/nextboot, restart with the default, and change only if needed.
If you still have high paging activity, go through the perfpmr process (“Trace tools and PerfPMR” on page 316), and do not tune restricted tunables unless guided by IBM Support.
|
4.2.2 Paging space
Paging space or swap space is a special type of logical volume that is used to accommodate pages from RAM. This allows the memory footprint of workloads and processes to be greater than the physical memory allocated to the LPAR. When physical memory utilization reaches a certain threshold, the virtual memory manager (VMM) through the page-replacement algorithm will search for some pages to be evicted from RAM and sent to paging devices. This is called a page-out. When a program makes reference to a page, that page needs to be in real memory. If that page is on disk, a page-in must happen. This delays the execution of the program because it requires disk I/O, which is time-consuming. So it is important to have adequate paging devices.
The best situation is, where possible, to run the workload in main memory. However, it is important to have well dimensioned and good performing paging space to ensure that your system has the best performance when paging is inevitable. Note that some applications have a requirement on paging space, regardless of how much physical RAM is allocated. Therefore, performance of paging space is still valid today as it was previously.
Paging space size considerations can be found at:
http://www.ibm.com/developerworks/aix/library/au-aix7memoryoptimize3/
•Look for any specific recommendation from software vendors. Products such as IBM DB2 and Oracle have minimum requirements.
•Monitor your system frequently after going live. If you see that you are never approaching 50 percent of paging space utilization, do not add the space.
•A more sensible rule is to configure the paging space to be half the size of RAM plus 4 GB, with an upper limit of 32 GB.
Performance considerations for paging devices:
•Use multiple paging spaces.
•Use as many physical disks as possible.
•Avoid to use a heavily accessed disk.
•Use devices of the same size.
•Use a striped configuration with 4 KB stripe size.
•Use disks from your Storage Area Network (SAN).
4.2.3 One TB segment aliasing
One TB segment aliasing or Large Segment Aliasing (LSA) improves performance by using 1-TB segment translations for shared memory segments. 64-bit applications with large memory footprint and low spatial locality are likely to benefit from this feature. Both directed and undirected shared memory attachments are eligible for LSA promotion.
In this section, we introduce how 1-TB segment aliasing works, when to enable it, and how to observe the benefits of using it.
Introduction to 1-TB segment aliasing
To understand how LSA works, you need to get some knowledge about 64-bit memory addressing.
Virtual address space of 64-bit applications
64-bit architecture has an addressable range of 2**64, from 0x0000000000000000 to 0xFFFFFFFFFFFFFFFF, which is 16 exabytes (EB) in size. The address space is organized in segments, and there are 2**36 segments, each segment being 256 MB in size.
Table 4-4 shows the 64-bit effective address space.
Table 4-4 64-bit effective address space
|
Segment Number (hex)
|
Segment usage
|
|
0x0000_0000_0
|
System call tables, kernel text
|
|
0x0000_0000_1
|
Reserved for system use
|
|
0x0000_0000_2
|
Reserved for user mode loader (process private segment)
|
|
0x0000_0000_3 - 0x0000_0000_C
|
shmat or mmap use
|
|
0x0000_0000_D
|
Reserved for user mode loader
|
|
0x0000_0000_E
|
shmat or mmap use
|
|
0x0000_0000_F
|
Reserved for user mode loader
|
|
0x0000_0001_0 - 0x06FF_FFFF_F
|
Application text, data, BSS and heap
|
|
0x0700_0000_0 - 0x07FF_FFFF_F
|
Default application shmat and mmap area if 1-TB Segment Aliasing (LSA) is not enabled.
Directed application shmat and mmap area if LSA is enabled.
|
|
0x0800_0000_0 - 0x08FF_FFFF_F
|
Application explicit module load area
|
|
0x0900_0000_0 - 0x09FF_FFFF_F
|
Shared library text and per-process shared library data
|
|
0x0A00_0000_0 - 0x0AFF_FFFF_F
|
Default (undirected) shmat and mmap area if LSA is enabled
|
|
0x0B00_0000_0 - 0x0EFF_FFFF_F
|
Reserved for future use
|
|
0x0F00_0000_0 - 0x0FFF_FFFF_F
|
Application primary thread stack
|
|
0x1000_0000_0 - 0XEFFF_FFFF_F
|
Reserved for future use
|
|
0xF000_0000_0 - 0xFFFF_FFFF_F
|
Additional kernel segments
|
64-bit hardware address resolution
Figure 4-5 gives an explanation of how the effective address of one process is translated to a virtual address, and finally the real hardware address in AIX.
As mentioned in “Virtual address space of 64-bit applications” on page 129, each 64 bit effective address uses the first 36 bits as the effective segment ID (ESID), and then it is mapped to a 52-bit virtual segment ID (VSID) using a segment lookaside buffer (SLB) or a segment table (STAB).
After the translation, we get a 52-bit VSID. Combine this VSID with the 16-bit page index, and we get a 68-bit virtual page number. Then the operating system uses TLB and other tables to translate the virtual page number into a real page number, which is combined with the 12-bit page offset to eventually form a 64-bit real address.

Figure 4-5 64-bit hardware address resolution
ESID and VSID mapping can be found with the svmon command, as shown in Example 4-5. Note that the VSID is unique in the operating system, while different processes may have the same ESID.
Example 4-5 VSID and ESID mapping in svmon
#svmon -P 9437198
-------------------------------------------------------------------------------
Pid Command Inuse Pin Pgsp Virtual 64-bit Mthrd 16MB
9437198 lsatest 24990 9968 0 24961 Y N N
PageSize Inuse Pin Pgsp Virtual
s 4 KB 11374 0 0 11345
m 64 KB 851 623 0 851
Vsid Esid Type Description PSize Inuse Pin Pgsp Virtual
20002 0 work kernel segment m 671 620 0 671
9d001d 90000000 work shared library text m 175 0 0 175
50005 9ffffffd work shared library sm 2544 0 0 2544
9f001f 90020014 work shared library s 166 0 0 166
840fa4 70000004 work default shmat/mmap sm 135 0 0 135
890fc9 70000029 work default shmat/mmap sm 135 0 0 135
9d0efd 70000024 work default shmat/mmap sm 135 0 0 135
8c0f6c 70000012 work default shmat/mmap sm 135 0 0 135
9b0edb 70000008 work default shmat/mmap sm 135 0 0 135
980f38 7000000d work default shmat/mmap sm 135 0 0 135
8e0f0e 7000003b work default shmat/mmap sm 135 0 0 135
870ec7 70000036 work default shmat/mmap sm 135 0 0 135
9504b5 7000002d work default shmat/mmap sm 135 0 0 135
Hardware limits on SLB entries and benefits of LSA
Now you know that SLB is used to translate ESID to VSID when doing address translation. Because SLB is in processor cache, the translation will be very efficient if we hit the SLB when accessing memory.
However, POWER6 and POWER7 processor has limited SLB entries, as follows:
•POWER6
– SLB has 64 entries
– 20 reserved for the kernel
– 44 available for user processes, which yields 11 GB of accessible memory
– Many client workloads do not fit into 11 GB
•POWER7
– SLB has 32 entries; architectural trend towards smaller SLB sizes
– 20 still reserved for the kernel
– 12 available for user processes, which yields 3 GB of accessible memory
– Potential for performance regression
As the SLB entries are limited, you can only address 3 GB of user memory directly from SLB in POWER7, which is usually not enough for most applications. And if you failed to address memory directly from SLB, the performance deteriorates.
This is why LSA is introduced in AIX. Through LSA, you can address 12 TB of memory using 12 SLB entries, and SLB faults should be rare. Because this is transparent to the application, you can expect an immediate performance boost for many applications that have a large memory footprint (Figure 4-6 on page 132).

Figure 4-6 Process address space example with LSA
Enabling LSA and verification
In the following sections, we introduce how to enable LSA and check whether LSA has taken effect.
Enabling LSA
There are vmo options as well as environment variables available to enable LSA. For most cases, you need to set esid_allocator=1 when in AIX 6.1, and do nothing in AIX 7.1 because the default is on already. You can also change the environment variables on a per process basis. The option details are as follows:
•esid_allocator, VMM_CNTRL=ESID_ALLOCATOR=[0,1]
Default off (0) in AIX 6.1 TL06, on (1) in AIX 7.1. When on, indicates that the large segment aliasing effective address allocation policy is in use. This parameter can be changed dynamically but will only be effective for future shared memory allocations.
•shm_1tb_shared, VMM_CNTRL=SHM_1TB_SHARED=[0,4096]
Default set to 12 (3 GB) on POWER7, 44 (11GB) on POWER6 and earlier. This is in accord with the hardware limit of POWER6 and POWER7. This parameter sets the threshold number of 256 MB segments at which a shared memory region is promoted to use a 1-TB alias.
•shm_1tb_unshared, VMM_CNTRL=SHM_1TB_UNSHARED=[0,4096]
Default set to 256 (64 GB). This parameter controls the threshold number of 256 MB segments at which multiple homogeneous small shared memory regions will be promoted to an unshared alias. Use this parameter with caution because there could be performance degradation when there are frequent shared memory attaches and detaches.
•shm_1tb_unsh_enable
Default set to on (1) in AIX 6.1 TL06 and AIX 7.1 TL01; Default set to off (0) in AIX 7.1 TL02 and later releases. When on, indicates unshared aliases are in use.
|
Note: Unshared aliases might degrade performance in case there are frequent shared memory attaches and detaches. We suggest you turn unshared aliasing off.
|
You can also refer to the Oracle Database and 1-TB Segment Aliasing in the following website for more information:
http://www-03.ibm.com/support/techdocs/atsmastr.nsf/WebIndex/TD105761
Verification of LSA
This section shows the LSA verification steps:
1. Get the process ID of the process using LSA, which can be any user process, for example a database process.
2. Use svmon to confirm that the shared memory regions are already allocated, as shown in Example 4-6.
Example 4-6 svmon -P <pid>
#svmon -P 3670250
-------------------------------------------------------------------------------
Pid Command Inuse Pin Pgsp Virtual 64-bit Mthrd 16MB
3670250 lsatest 17260 10000 0 17229 Y N N
PageSize Inuse Pin Pgsp Virtual
s 4 KB 3692 0 0 3661
m 64 KB 848 625 0 848
Vsid Esid Type Description PSize Inuse Pin Pgsp Virtual
20002 0 work kernel segment m 671 622 0 671
990019 90000000 work shared library text m 172 0 0 172
50005 9ffffffd work shared library sm 2541 0 0 2541
9b001b 90020014 work shared library s 161 0 0 161
b70f37 f00000002 work process private m 5 3 0 5
fb0b7b 9001000a work shared library data sm 68 0 0 68
a10021 9fffffff clnt USLA text,/dev/hd2:4225 s 20 0 - -
e60f66 70000004 work default shmat/mmap sm 14 0 0 14
fd0e7d 70000023 work default shmat/mmap sm 14 0 0 14
ee0fee 70000007 work default shmat/mmap sm 14 0 0 14
ea0f6a 7000003f work default shmat/mmap sm 14 0 0 14
e50e65 70000021 work default shmat/mmap sm 14 0 0 14
d10bd1 7000001a work default shmat/mmap sm 14 0 0 14
fb0f7b 70000002 work default shmat/mmap sm 14 0 0 14
ff0fff 70000009 work default shmat/mmap sm 14 0 0 14
f20e72 7000003d work default shmat/mmap sm 14 0 0 14
e50fe5 70000028 work default shmat/mmap sm 14 0 0 14
f00e70 7000000e work default shmat/mmap sm 14 0 0 14
8a0c8a 7000001e work default shmat/mmap sm 14 0 0 14
f80f78 7000002f work default shmat/mmap sm 14 0 0 14
Example 4-7 Running kdb
#kdb
START END <name>
0000000000001000 00000000058A0000 start+000FD8
F00000002FF47600 F00000002FFDF9C8 __ublock+000000
000000002FF22FF4 000000002FF22FF8 environ+000000
000000002FF22FF8 000000002FF22FFC errno+000000
F1000F0A00000000 F1000F0A10000000 pvproc+000000
F1000F0A10000000 F1000F0A18000000 pvthread+000000
read vscsi_scsi_ptrs OK, ptr = 0xF1000000C02D6380
(0)>
Example 4-8 tpid -d <pid>
(0)> tpid -d 3670250
SLOT NAME STATE TID PRI RQ CPUID CL WCHAN
pvthread+019500 405!lsatest RUN 1950075 071 4 0
5. Choose any of the thread SLOT numbers listed (only one available above), and run “user -ad <slot_number>” in kdb. As in Example 4-9, the LSA_ALIAS in the command output means LSA is activated for the shared memory allocation. If LSA_ALIAS flag does not exist, LSA is not in effect.
Example 4-9 user -ad <slot_number>
(0)> user -ad 405
User-mode address space mapping:
uadspace node allocation......(U_unode) @ F00000002FF48960
usr adspace 32bit process.(U_adspace32) @ F00000002FF48980
segment node allocation.......(U_snode) @ F00000002FF48940
segnode for 32bit process...(U_segnode) @ F00000002FF48BE0
U_adspace_lock @ F00000002FF48E20
lock_word.....0000000000000000 vmm_lock_wait.0000000000000000
V_USERACC strtaddr:0x0000000000000000 Size:0x0000000000000000
ESID Allocator version (U_esid_allocator)........ 0001
shared alias thresh (U_shared_alias_thresh)...... 000C
unshared alias thresh (U_unshared_alias_thresh).. 0100
vmmflags......00400401 SHMAT BIGSTAB LSA_ALIAS
Identify LSA issues
In the following sections, we introduce how to identify LSA issues using hpmstat and tprof.
Using hpmstat to identify LSA issues
The hpmstat command provides system-wide hardware performance counter information that can be used to monitor SLB misses. Refer to “The hpmstat and hpmcount utilities” on page 334 for more information about hpmstat. If there are a lot of SLB misses, then enabling LSA should help.
You can get the supported event groups from the pmlist command in AIX, as shown in Example 4-10 on page 135.
Example 4-10 Supported hardware performance event groups
#pmlist -g -1|pg
...
Group #10: pm_slb_miss
Group name: SLB Misses
Group description: SLB Misses
Group status: Verified
Group members:
Counter 1, event 77: PM_IERAT_MISS : IERAT Reloaded (Miss)
Counter 2, event 41: PM_DSLB_MISS : Data SLB misses
Counter 3, event 89: PM_ISLB_MISS : Instruction SLB misses
Counter 4, event 226: PM_SLB_MISS : SLB misses
Counter 5, event 0: PM_RUN_INST_CMPL : Run instructions completed
Counter 6, event 0: PM_RUN_CYC : Run cycles
...
Group #10 is used for reporting SLB misses. Use hpmstat to monitor the SLB misses events as shown in Example 4-11. Generally you should further investigate the issue when the SLB miss rate per instruction is greater than 0.5%. The DSLB miss rate per instruction is 1.295%, and is not acceptable. You can enable LSA by setting vmo -p -o esid_allocator=1 and seeing the effect.
Example 4-11 hpmstat before LSA is enabled
#hpmstat -r -g 10 20
Execution time (wall clock time): 20.010013996 seconds
Group: 10
Counting mode: user+kernel+hypervisor+runlatch
Counting duration: 160.115119955 seconds
PM_IERAT_MISS (IERAT Reloaded (Miss)) : 20894033
PM_DSLB_MISS (Data SLB misses) : 72329260
PM_ISLB_MISS (Instruction SLB misses) : 15710
PM_SLB_MISS (SLB misses) : 72344970
PM_RUN_INST_CMPL (Run instructions completed) : 5584383071
PM_RUN_CYC (Run cycles) : 66322682987
Normalization base: time
Counting mode: user+kernel+hypervisor+runlatch
Derived metric group: Translation
[ ] % DSLB_Miss_Rate per inst : 1.295 %
[ ] IERAT miss rate (%) : 0.374 %
[ ] % ISLB miss rate per inst : 0.000 %
Derived metric group: General
[ ] Run cycles per run instruction : 11.876
[ ] MIPS : 34.877 MIPS
u=Unverified c=Caveat R=Redefined m=Interleaved
Example 4-12 shows the hpmstat output after we set esid_allocator=1 and restarted the application. You can see that the SLB misses are gone after LSA is activated.
Example 4-12 hpmstat output after LSA is enabled
#hpmstat -r -g 10 20
Execution time (wall clock time): 20.001231826 seconds
Group: 10
Counting mode: user+kernel+hypervisor+runlatch
Counting duration: 160.005281724 seconds
PM_IERAT_MISS (IERAT Reloaded (Miss)) : 189529
PM_DSLB_MISS (Data SLB misses) : 25347
PM_ISLB_MISS (Instruction SLB misses) : 15090
PM_SLB_MISS (SLB misses) : 40437
PM_RUN_INST_CMPL (Run instructions completed) : 2371507258
PM_RUN_CYC (Run cycles) : 66319381743
Normalization base: time
Counting mode: user+kernel+hypervisor+runlatch
Derived metric group: Translation
[ ] % DSLB_Miss_Rate per inst : 0.001 %
[ ] IERAT miss rate (%) : 0.008 %
[ ] % ISLB miss rate per inst : 0.001 %
Derived metric group: General
[ ] Run cycles per run instruction : 27.965
[ ] MIPS : 14.821 MIPS
u=Unverified c=Caveat R=Redefined m=Interleaved
Using tprof to identify LSA issues
An -E option is available for monitoring such events. When there is a notable amount of SLB misses, you should be able to see a lot of kernel processor time spent in set_smt_pri_user_slb_found. In Example 4-13 you can see 13.92% set_smt_pri_user_slb_found, and you can find that lsatest caused the problem.
Example 4-13 tprof before LSA is enabled
#tprof -E -sku -x sleep 10
Configuration information
=========================
System: AIX 7.1 Node: p750s1aix2 Machine: 00F660114C00
Tprof command was:
tprof -E -sku -x sleep 10
Trace command was:
/usr/bin/trace -ad -M -L 1073741312 -T 500000 -j 00A,001,002,003,38F,005,006,134,210,139,5A2,5A5,465,2FF,5D8, -o -
Total Samples = 1007
Traced Time = 10.02s (out of a total execution time of 10.02s)
Performance Monitor based reports:
Processor name: POWER7
Monitored event: Processor cycles
Sampling interval: 10ms
<<<<<<<<<<<<<<<<<<<<<<<<<<<<<<<<<<<<<<<<<<<<<<<<<<<<<<<<<<<<<<<<<<<<<<<<<<<<<<<<
Process Freq Total Kernel User Shared Other
======= ==== ===== ====== ==== ====== =====
lsatest 1 99.50 24.85 74.65 0.00 0.00
/usr/bin/sh 2 0.20 0.10 0.00 0.10 0.00
gil 1 0.10 0.10 0.00 0.00 0.00
...
Total % For All Processes (KERNEL) = 25.25
Subroutine % Source
========== ====== ======
set_smt_pri_user_slb_found 13.92 noname
start 8.05 low.s
.user_slb_found 1.79 noname
slb_stats_usr_point 0.80 noname
._ptrgl 0.20 low.s
slb_user_tmm_fixup 0.10 noname
.enable 0.10 misc.s
.tstart 0.10 /kernel/proc/clock.c
.v_freexpt 0.10 rnel/vmm/v_xptsubs.c
After we enabled LSA, set_smt_pri_user_slb_found was gone (Example 4-14).
Example 4-14 tprof after LSA is enabled
#tprof -E -sku -x sleep 10
Configuration information
=========================
System: AIX 7.1 Node: p750s1aix2 Machine: 00F660114C00
Tprof command was:
tprof -E -sku -x sleep 10
Trace command was:
/usr/bin/trace -ad -M -L 1073741312 -T 500000 -j 00A,001,002,003,38F,005,006,134,210,139,5A2,5A5,465,2FF,5D8, -o -
Total Samples = 1007
Traced Time = 10.02s (out of a total execution time of 10.02s)
Performance Monitor based reports:
Processor name: POWER7
Monitored event: Processor cycles
Sampling interval: 10ms
...
Total % For All Processes (KERNEL) = 0.10
Subroutine % Source
========== ====== ======
ovlya_addr_sc_ret 0.10 low.s
Sample program illustration
The sample program used in this section is in Appendix C, “Workloads” on page 341. In the sample scenario, we got about a 30% performance gain. Note that real workload benefits can vary.
4.2.4 Multiple page size support
In AIX, the virtual memory is split into pages, with a default page size of 4 KB. The POWER5+ processor supports four virtual memory page sizes: 4 KB (small pages), 64 KB (medium pages), 16 MB (large pages), and 16 GB (huge pages). The POWER6 processor also supports using 64 KB pages in segments with base page size of 4 KB. AIX uses this process to provide the performance benefits of 64 KB pages when useful or resorting to 4 KB pages where 64 KB pages would waste too much memory, such as allocated but not used by the application.
Using a larger virtual memory page size such as 64 KB for an application’s memory can improve the application's performance and throughput due to hardware efficiencies associated with larger page sizes. Using a larger page size can decrease the hardware latency of translating a virtual page address to a physical page address. This decrease in latency is due to improving the efficiency of hardware translation caches such as a processor’s translation lookaside buffer (TLB). Because a hardware translation cache only has a limited number of entries, using larger page sizes increases the amount of virtual memory that can be translated by each entry in the cache. This increases the amount of memory that can be accessed by an application without incurring hardware translation delays.
POWER6 supports mixing 4 KB and 64 KB page sizes. AIX 6.1 takes advantage of this new hardware capability automatically without user intervention. This AIX feature is called Dynamic Variable Page Size Support (DVPSS). To avoid backward compatibility issues, VPSS is disabled in segments that currently have an explicit page size selected by the user.
Some applications may require a configuration to take advantage of multiple page support, while others will take advantage by default. SAP, for example, needs some additional configuration to make use of 64 KB pages. Information regarding the required configuratin can be found in the “Improving SAP performance on IBM AIX: Modification of the application memory page size to improve the performance of SAP NetWeaver on the AIX operating system” whitepaper at:
|
Note: The use of multiple page support cannot be combined with Active Memory Sharing (AMS) or Active Memory Expansion (AME). Both only support 4 KB pages. AME can optionally support 64 K pages, but the overhead in enabling that support can cause poor performance.
|
Large pages
Large pages are intended to be used in specific environments. AIX does not automatically use these page sizes. AIX must be configured to do so, and the number of pages of each of these page sizes must also be configured. AIX cannot automatically change the number of configured 16 MB or 16 GB pages.
Not all applications benefit from using large pages. Memory-access-intensive applications such as databases that use large amounts of virtual memory can benefit from using large pages (16 MB). DB2 and Oracle require specific settings to use this. IBM Java can take advantage of medium (64 K) and large page sizes. Refer to section 7.3, “Memory and page size considerations” in the POWER7 and POWER7+ Optimization and Tuning Guide, SG24-8079.
AIX maintains different pools for 4 KB and 16 MB pages. An application (at least WebSphere) configured to use large pages can still use 4 KB pages. However, other applications and system processes may not be able to use 16 MB pages. In this case, if you allocate too many large pages you can have contention for 4 KB and high paging activity.
AIX treats large pages as pinned memory and does not provide paging support for them. Using large pages can result in an increased memory footprint due to memory fragmentation.
|
Note: You should be extremely cautious when configuring your system for supporting large pages. You need to understand your workload before using large pages in your system.
|
Since AIX 5.3, the large page pool is dynamic. The amount of physical memory that you specify takes effect immediately and does not require a reboot.
Example 4-15 shows how to verify the available page sizes.
Example 4-15 Display the possible page sizes
# pagesize -a
4096
65536
16777216
17179869184
Example 4-16 shows how to configure two large pages dynamically.
Example 4-16 Configuring two large pages (16 MB)
# vmo -o lgpg_regions=2 -o lgpg_size=16777216
Setting lgpg_size to 16777216
Setting lgpg_regions to 2
Example 4-17 shows how to disable large pages.
Example 4-17 Removing large page configuration
# vmo -o lgpg_regions=0
Setting lgpg_regions to 0
The commands that can be used to monitor different page size utilization are vmstat and svmon. The flag -P of vmstat followed by the page size shows the information for that page size, as seen in Example 4-18. The flag -P ALL shows the overall memory utilization divided into different page sizes, as seen in Example 4-19 on page 140.
Example 4-18 vmstat command to verify large page utilization
# vmstat -P 16MB
System configuration: mem=8192MB
pgsz memory page
----- -------------------------- ------------------------------------
siz avm fre re pi po fr sr cy
16M 200 49 136 0 0 0 0 0 0
Example 4-19 vmstat command to show memory utilization grouped by page sizes
# vmstat -P ALL
System configuration: mem=8192MB
pgsz memory page
----- -------------------------- ------------------------------------
siz avm fre re pi po fr sr cy
4K 308832 228825 41133 0 0 0 13 42 0
64K 60570 11370 51292 0 0 39 40 133 0
16M 200 49 136 0 0 0 0 0 0
Example 4-20 shows that svmon with the flag -G is another command that can be used to verify memory utilization divided into different page sizes.
Example 4-20 svmon command to show memory utilization grouped by page sizes
# svmon -G
size inuse free pin virtual mmode
memory 2097152 1235568 861584 1129884 611529 Ded
pg space 655360 31314
work pers clnt other
pin 371788 0 0 135504
in use 578121 0 38951
PageSize PoolSize inuse pgsp pin virtual
s 4 KB - 267856 3858 176364 228905
m 64 KB - 9282 1716 8395 11370
L 16 MB 200 49 0 200 49
In the three previous examples, the output shows 200 large pages configured in AIX and 49 in use.
4.3 I/O device tuning
When configuring AIX I/O devices for performance, there are many factors to take into consideration. It is important to understand the underlying disk subsystem, and how the AIX system is attached to it.
In this section we focus only on the tuning of disk devices and disk adapter devices in AIX. AIX LVM and file system performance tuning are discussed in detail in 4.4, “AIX LVM and file systems” on page 157.
4.3.1 I/O chain overview
Understanding I/O chain specifically regarding disks and disk adapters is important because it ensures that all devices in the stack have the appropriate tuning parameters defined.
We look at three types of disk attachments:
•Disk presented via dedicated physical adapters
•Virtualized disk using NPIV
•Virtualized disk using virtual SCSI
Refer to IBM PowerVM Virtualization Introduction and Configuration, SG24-7940-04, which describes in detail how to configure NPIV and Virtual SCSI. In this section we only discuss the concepts and how to tune parameters related to performance.
In 3.6.1, “Virtual SCSI” on page 75, 3.6.2, “Shared storage pools” on page 76, 3.6.3, “N_Port Virtualization” on page 79 we discuss in detail the use cases and potential performance implications of using NPIV and Virtual SCSI.
Dedicated physical adapters
When we referred to disk storage presented via direct physical adapters, this implies that the disk is attached to the AIX system without the use of Virtual I/O. This means that the AIX system has exclusive access to fiber channel adapters, which are used to send I/O to an external storage system.
Looking at Figure 4-7 from left to right, when a write or a read operation is issued to AIX, LVM uses one physical buffer (pbuf) for each request. The physical buffers are described in 4.3.3, “Pbuf on AIX disk devices” on page 148. The I/O is then queued to the physical volume (PV), then handed to the multipathing driver and queued to the disk adapter device. The I/O is then passed through one or more SAN fabric switches (unless the storage is direct-attached to the AIX system) and reaches the external storage. If the I/O can be written to or read from the storage system’s cache, it is, otherwise it goes to disk.

Figure 4-7 Dedicated adapters
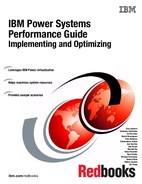
NPIV
NPIV is a method where disk storage is implemented using PowerVM’s N_Port virtualization capability. In this instance, the Virtual I/O servers act as a passthrough enabling multiple AIX LPARs to access a single shared fiber channel (FC) port. A single FC adapter port on a Virtual I/O server is capable of virtualizing up to 64 worldwide port names (WWPN), meaning there are a maximum of 64 client logical partitions that can connect.
The I/O sequence is very similar to that of using dedicated physical adapters with the exception that there is an additional queue on each fiber channel adapter per Virtual I/O server, and there might be competing workloads on the fiber channel port from different logical partitions.
Figure 4-8 illustrates the I/O chain when NPIV is in use.
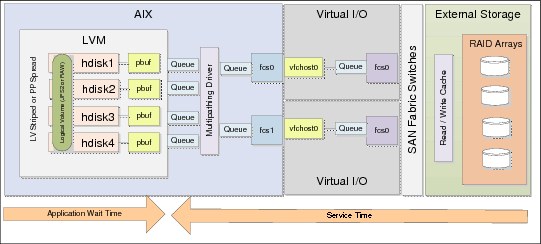
Figure 4-8 N_Port virtualization
Virtual SCSI
Virtual SCSI is a method of presenting a disk assigned to one or more Virtual I/O servers to a client logical partition. When an I/O is issued to the AIX LVM, the pbuf and hdisk queue is used exactly the same as in the dedicated physical adapter and NPIV scenarios. The difference is that there is a native AIX SCSI driver used and I/O requests are sent to a virtual SCSI adapter. The virtual SCSI adapter is a direct mapping to the Virtual I/O server’s vhost adapter, which is allocated to the client logical partition.
The hdisk device exists on both the client logical partition and the virtual I/O server, so there is also a queue to the hdisk on the virtual I/O server. The multipathing driver installed on the virtual I/O server then queues the I/O to the physical fiber channel adapter assigned to the VIO server and the I/O is passed to the external storage subsystem as described in the dedicated physical adapter and NPIV scenarios. There may be some limitation with copy services from a storage system in the case that a device driver is required to be installed on the AIX LPAR for this type of functionality.
Figure 4-9 on page 143 illustrates the I/O chain when virtual SCSI is in use.
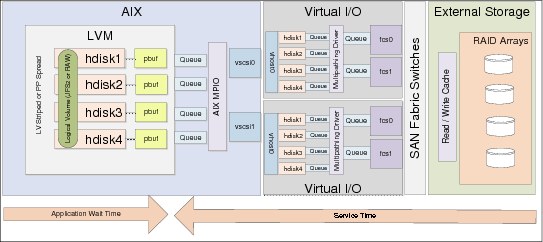
Figure 4-9 Virtual SCSI
|
Note: The same disk presentation method applies when presenting disks on a Virtual I/O server to a client logical partition as well as using shared storage pools.
|
4.3.2 Disk device tuning
The objective of this section is to discuss which AIX hdisk device settings can be tuned and what their purpose is. Most of the settings discussed here are dependant on the type of workload and the performance capabilities of the storage system.
Understanding your I/O workload is important when performing an analysis of which settings need to be tuned. Your workload may be an OLTP type workload processing small block random I/O or conversely a data warehouse type workload that processes large block sequential I/O. The tuning parameters here differ depending on the type of workload running on the system.
It is also important to understand that changing these values here may enable AIX to send more I/O and larger I/O to the storage system, but this adds additional load to the storage system and SAN fabric switches. We suggest that you work with your SAN and storage administrator to understand the effect that tuning the device will have on your storage system.
Table 4-5 provides a summary of the tuning parameters available on an hdisk device and their purpose.
Table 4-5 Tuning parameters on an AIX hdisk device
|
Setting
|
Description
|
|
algorithm
|
This determines the method by which AIX distributes I/O down the paths that are available. The typical values are failover, where only one path is used, and round_robin where I/O is distributed across all available paths. Some device drivers add additional options, such as SDDPCM, which adds load_balance, which is similar to round_robin except it has more intelligent queueing. We suggest that you consult your storage vendor to find out the optimal setting.
|
|
hcheck_interval
|
This is the interval in seconds that AIX sends health check polls to a disk. If failed MPIO paths are found, the failed path will also be polled and re-enabled when it is found to be responding. It is suggested to confirm with the storage vendor what the recommended value to use here is.
|
|
max_transfer
|
This specifies the maximum amount of data that can be transmitted in a single I/O operation. If an application makes a large I/O request, the I/O is broken down into multiple I/Os the size of the max_transfer tunable. Typically, for applications transmitting small block I/O the default 256 KB is sufficient. However, in cases where there is large block streaming workload, the max_transfer size may be increased.
|
|
max_coalesce
|
This value sets the limit for the maximum size of an I/O that the disk driver will create by grouping together smaller adjacent requests. We suggest that the max_coalesce value match the max_transfer value.
|
|
queue_depth
|
The service queue depth of an hdisk device specifies the maximum number of I/O operations that can be in progress simultaneously on the disk. Any requests beyond this number are placed into another queue (wait queue) and remain in a pending state until an earlier request on the disk completes. Depending on how many concurrent I/O operations the backend disk storage can support, this value may be increased. However, this will place additional workload on the storage system.
|
|
reserve_policy
|
This parameter defines the reservation method used when a device is opened. The reservation policy is required to be set appropriately depending on what multipathing algorithm is in place. We suggest that you consult your storage vendor to understand what this should be set to based on the algorithm. Possible values include no_reserve, single_path, PR_exclusive, and PR_shared. This reservation policy is required to be set to no_reserve in a dual VIO server setup with virtual SCSI configuration, enabling both VIO servers to access the device.
|
As described in Table 4-5 on page 143, the max_transfer setting specifies the maximum amount of data that is transmitted in a single I/O operation. In Example 4-21, a simple I/O test is performed to demonstrate the use of the max_transfer setting. There is an AIX system processing a heavy workload of 1024 k block sequential I/Os with a read/write ratio of 80:20 to an hdisk (hdisk1) which has the max_transfer set to the default of 0x40000, which equates to 256 KB.
Typically, the default max_transfer value is suitable for most small block workloads. However, in a scenario with large block streaming workloads, it is suggested to consider tuning the max_transfer setting.
This is only an example test with a repeatable workload—the difference between achieving good performance and having performance issues is to properly understand your workload, establishing a baseline and tuning parameters individually and measuring the results.
Example 4-21 Simple test using 256KB max_transfer size
root@aix1:/ # lsattr -El hdisk1 -a max_transfer
max_transfer 0x40000 Maximum TRANSFER Size True
root@aix1:/ # iostat -D hdisk1 10 1
System configuration: lcpu=32 drives=3 paths=10 vdisks=2
hdisk1 xfer: %tm_act bps tps bread bwrtn
100.0 2.0G 7446.8 1.6G 391.4M
read: rps avgserv minserv maxserv timeouts fails
5953.9 8.2 0.6 30.0 0 0
write: wps avgserv minserv maxserv timeouts fails
1492.9 10.1 1.2 40.1 0 0
queue: avgtime mintime maxtime avgwqsz avgsqsz sqfull
20.0 0.0 35.2 145.0 62.0 7446.8
--------------------------------------------------------------------------------
root@aix1:/ #
The resulting output of iostat -D for a single 10-second interval looking at hdisk1 displays the following:
•Observed throughput is 2 GB per second. This is described as bytes per second (bps).
•This is made up of 7446.8 I/O operations per second. This is described as transfers per second (tps).
•The storage shows an average read service time of 8.2 milliseconds and an average write of 10.1 milliseconds. This is described as average service time (avgserv).
•The time that our application has to wait for the I/O to be processed in the queue is 20 milliseconds. This is described as the average time spent by a transfer request in the wait queue (avgtime). This is a result of our hdisk queue becoming full, which is shown as sqfull. The queue has filled up as a result of each I/O 1024 KB I/O request consisting of four 256 KB I/O operations. Handling the queue depth is described later in this section.
•The service queue for the disk was also full, due to the large number of I/O requests.
We knew that our I/O request size was 1024 KB, so we changed our max_transfer on hdisk1 to be 0x100000 which is 1 MB to match our I/O request size. This is shown in Example 4-22.
Example 4-22 Changing the max_transfer size to 1 MB
root@aix1:/ # chdev -l hdisk1 -a max_transfer=0x100000
hdisk1 changed
root@aix1:/
On completion of changing the max_transfer, we ran the same test again, as shown in Example 4-23, and observed the results.
Example 4-23 Simple test using 1MB max_transfer size
root@aix1:/ # lsattr -El hdisk1 -a max_transfer
max_transfer 0x100000 Maximum TRANSFER Size True
root@aix1:/ # iostat -D hdisk1 10 1
hdisk1 xfer: %tm_act bps tps bread bwrtn
100.0 1.9G 1834.6 1.5G 384.8M
read: rps avgserv minserv maxserv timeouts fails
1467.6 24.5 14.4 127.2 0 0
write: wps avgserv minserv maxserv timeouts fails
367.0 28.6 16.2 110.7 0 0
queue: avgtime mintime maxtime avgwqsz avgsqsz sqfull
0.0 0.0 0.3 0.0 61.0 0.0
--------------------------------------------------------------------------------
root@aix1:/ #
The output of iostat -D for a single 10-second interval looking at hdisk1 in the second test displayed the following:
•Observed throughput is 1.9 Gb per second. This is almost the same as the first test, shown in bps.
•This is made up of 1,834 I/O operations per second, which is shown in tps in the output in Example 4-23 on page 145. You can see that the number of I/O operations has been reduced by a factor of four, which is a result of moving from a max_transfer size of 256 KB to 1 MB. This means our 1024 KB I/O request is now processed in a single I/O operation.
•The storage shows an average read service time of 24.5 milliseconds and an average write service time of 28.6 milliseconds. This is shown as avgserv. Notice here that our service time from the storage system has gone up by a factor of 2.5, while our I/O size is four times larger. This demonstrates that we placed additional load on our storage system as our I/O size increased, while overall the time taken for the 1024 KB read I/O request to be processed was reduced as a result of the change.
•The time that our application had to wait for the I/O to be retrieved from the queue was 0.0 shown as avgtime. This was a result of the amount of I/O operations being reduced by a factor of four and their size increased by a factor of four. In the first test for a single read 1024 KB I/O request to be completed, this consisted of four 256 KB I/O operations with a 8.2 millisecond service time and a 20 millisecond wait queue time, giving an overall average response time to the I/O request of 52.8 milliseconds since a single 1024 KB I/O request consists of four 256 KB I/Os.
•In the second test after changing the max_transfer size to 1 MB, we completed the 1024 KB I/O request in a single I/O operation with an average service time of 24.5 milliseconds, giving an average of a 28.3 millisecond improvement per 1024 KB I/O request. This can be calculated by the formula avg IO time = avgtime + avgserv.
The conclusion of this test is that for our large block I/O workload, increasing the value of the max_transfer size to enable larger I/Os to be processed without filling up the disk’s I/O queue provided a significant increase in performance.
|
Important: If you are using virtual SCSI and you change to max_transfer on an AIX hdisk device, it is critical that these settings are replicated on the Virtual I/O server to ensure that the changes take effect.
|
The next setting that is important to consider is queue_depth on an AIX hdisk device. This is described in Table 4-5 on page 143 as the maximum number of I/O operations that can be in progress simultaneously on a disk device.
To be able to tune this setting, it is important to understand whether your queue is filling up on the disk and what value to set queue_depth to. Increasing queue_depth also places additional load on the storage system, because a larger number of I/O requests are sent to the storage system before they are queued.
Example 4-24 shows how to display the current queue_depth and observe what the maximum queue_depth is that can be set on the disk device. In this case the range is between 1 and 256. Depending on what device driver is in use, the maximum queue_depth may vary. It is always good practice to obtain the optimal queue depth for the storage system and its configuration from your storage vendor.
Example 4-24 Display current queue depth and maximum supported queue depth
root@aix1:/ # lsattr -El hdisk1 -a queue_depth
queue_depth 20 Queue DEPTH True
root@paix1:/ # lsattr -Rl hdisk1 -a queue_depth
1...256 (+1)
root@aix1:/ #
|
Note: In the event that the required queue_depth value cannot be assigned to an individual disk, as a result of being beyond the recommendation by the storage vendor, it is suggested to spread the workload across more hdisk devices because each hdisk has its own queue.
|
In Example 4-25 a simple test is performed to demonstrate the use of the queue_depth setting. There is an AIX system processing a heavy workload of 8 k small block random I/Os with an 80:20 read write ratio to an hdisk (hdisk1) which has its queue_depth currently set to 20. The iostat command issued here shows hdisk1 for a single interval of 10 seconds while the load is active on the system.
Example 4-25 Test execution with a queue_depth of 20 on hdisk1
root@aix1:/ # iostat -D hdisk1 10 1
System configuration: lcpu=32 drives=3 paths=10 vdisks=2
hdisk1 xfer: %tm_act bps tps bread bwrtn
99.9 296.5M 35745.1 237.2M 59.3M
read: rps avgserv minserv maxserv timeouts fails
28534.2 0.2 0.1 48.3 0 0
write: wps avgserv minserv maxserv timeouts fails
7210.9 0.4 0.2 50.7 0 0
queue: avgtime mintime maxtime avgwqsz avgsqsz sqfull
1.1 0.0 16.8 36.0 7.0 33898.5
--------------------------------------------------------------------------------
Looking at the resulting output of iostat -D in Example 4-25, you can observe the following:
•Our sample workload is highly read intensive and performing 35,745 I/O requests per second (tps) with a throughput of 296 MB per second (bps).
•The average read service time from the storage system is 0.2 milliseconds (avgserv).
•The average wait time per I/O transaction for the queue is 1.1 milliseconds (avgtime) and the disk’s queue in the 10-second period iostat was monitoring the disk workload filled up a total of 33,898 times (sqfull).
•The average amount of I/O requests waiting in the service wait queue was 36 (avgwqsz).
Based on this we could add our current queue depth (20) to the number of I/Os on average in the service wait queue (36), and have a queue_depth of 56 for the next test. This should stop the queue from filling up.
Example 4-26 shows changing the queue_depth on hdisk1 to our new queue_depth value. The queue_depth value is our target queue_depth of 56, plus some slight headroom bringing the total queue_depth to 64.
Example 4-26 Changing the queue_depth to 64 on hdisk1
root@aix1:/ # chdev -l hdisk1 -a queue_depth=64
hdisk1 changed
root@aix1:/ #
Example 4-27 on page 148 demonstrates the same test being executed again, but with the increased queue_depth of 64 on hdisk1.
Example 4-27 Test execution with a queue_depth of 64 on hdisk1
root@aix1:/ # iostat -D hdisk1 10 1
System configuration: lcpu=32 drives=3 paths=10 vdisks=2
hdisk1 xfer: %tm_act bps tps bread bwrtn
100.0 410.4M 50096.9 328.3M 82.1M
read: rps avgserv minserv maxserv timeouts fails
40078.9 0.4 0.1 47.3 0 0
write: wps avgserv minserv maxserv timeouts fails
10018.0 0.7 0.2 51.6 0 0
queue: avgtime mintime maxtime avgwqsz avgsqsz sqfull
0.0 0.0 0.3 0.0 23.0 0.0
--------------------------------------------------------------------------------
Looking at the resulting output of iostat -D in Example 4-27, you can observe the following:
•Our sample workload is highly read intensive and performing 50,096 I/O requests per second (tps) with a throughput of 410 MB per second (bps). This is significantly more than the previous test.
•The average read service time from the storage stem is 0.4 milliseconds (avgserv), which is slightly more than it was in the first test, because we are processing significantly more I/O operations.
•The average wait time per I/O transaction for the queue is 0 milliseconds (avgtime) and the disk’s queue in the 10-second period iostat was monitoring the disk workload did not fill up at all. In contrast to the previous test, where the queue filled up 33,898 times and the wait time for each I/O request was 1.1 milliseconds.
•The average amount of I/O requests waiting in the wait queue was 0 (avgwqsz), meaning our queue was empty; however; additional load was put on the external storage system.
Based on this test, we can conclude that each I/O request had an additional 0.2 millisecond response time from the storage system, while the 1.1 millisecond service queue wait time has gone away, meaning that after making this change, our workload’s response time went from 1.3 milliseconds to 0.4 milliseconds.
|
Important: If you are using virtual SCSI and you change to queue_depth on an AIX hdisk device, it is critical that these settings are replicated on the Virtual I/O server to ensure that the changes take effect.
|
|
Note: When you change the max_transfer or queue_depth setting on an hdisk device, it will be necessary that the disk is not being accessed and that the disk is not part of a volume group that is varied on. To change the setting either unmount any file systems and vary off the volume group, or change the queue_depth option with the -P flag of the chdev command to make the change active at the next reboot.
|
4.3.3 Pbuf on AIX disk devices
AIX Logical Volume Manager (LVM) uses a construct named pbuf to control a pending disk I/O. Pbufs are pinned memory buffers and one pbuf is always used for each individual I/O request, regardless of the amount of data that is supposed to be transferred. AIX creates extra pbufs when a new physical volume is added to a volume group.
Example 4-28 shows the AIX volume group data_vg with two physical volumes. We can see that the pv_pbuf_count is 512, which is the pbuf size for each physical volume in the volume group, and the total_vg_pbufs is 1024, which is because there are two physical volumes in the volume group, each with a pbuf size of 512.
Example 4-28 lvmo -av output
root@aix1:/ # lsvg -p data_vg
data_vg:
PV_NAME PV STATE TOTAL PPs FREE PPs FREE DISTRIBUTION
hdisk1 active 399 239 79..00..00..80..80
hdisk2 active 399 239 79..00..00..80..80
root@aix1:/ # lvmo -av data_vg
vgname = data_vg
pv_pbuf_count = 512
total_vg_pbufs = 1024
max_vg_pbufs = 524288
pervg_blocked_io_count = 3047
pv_min_pbuf = 512
max_vg_pbuf_count = 0
global_blocked_io_count = 3136
root@aix1:/ #
Also seen in Example 4-28, you can see that the pervg_blocked_io_count is 3047 and the global_blocked_io_count is 3136. This means that the data_vg volume group has 3047 I/O requests that have been blocked due to insufficient pinned memory buffers (pervg_blocked_io_count). Globally across all of the volume groups, 3136 I/O requests have been blocked due to insufficient pinned memory buffers.
In the case where the pervg_blocked_io_count is growing for a volume group, it may be necessary to increase the number of pbuf buffers. This can be changed globally by using ioo to set pv_min_pbuf to a greater number. However, it is suggested to handle this on a per volume group basis.
pv_pbuf_count is the number of pbufs that are added when a physical volume is added to the volume group.
Example 4-29 demonstrates increasing the pbuf buffers for the data_vg volume group from 512 per physical volume to 1024 per physical volume. Subsequently, the total number of pbuf buffers for the volume group is also increased.
Example 4-29 Increasing the pbuf for data_vg
root@aix1:/ # lvmo -v data_vg -o pv_pbuf_count=1024
root@aix1:/ # lvmo -av data_vg
vgname = data_vg
pv_pbuf_count = 1024
total_vg_pbufs = 2048
max_vg_pbufs = 524288
pervg_blocked_io_count = 3047
pv_min_pbuf = 512
max_vg_pbuf_count = 0
global_blocked_io_count = 3136
root@aix1:/ #
If you are unsure about changing these values, contact IBM Support for assistance.
|
Note: If at any point the volume group is exported and imported, the pbuf values will reset to their defaults. If you have modified these, ensure that you re-apply the changes in the event that you export and import the volume group.
|
4.3.4 Multipathing drivers
Drivers for IBM storage include SDDPCM for IBM DS8000, DS6000, SAN Volume Controller, and Storwize® V7000 as well as the XIV® Host Attachment kit for an XIV Storage System.
The best source of reference for which driver to use is the IBM System Storage Interoperation Center (SSIC), which provides details on drivers for IBM storage at:
Third-party drivers should be obtained from storage vendors and installed to deliver the best possible performance.
4.3.5 Adapter tuning
The objective of this section is to detail what AIX storage adapter device settings can be tuned to and their purpose. Three scenarios are covered here:
•Dedicated fiber channel adapters
•NPIV virtual fiber channel adapters
•Virtual SCSI
The most important thing to do when tuning the adapter settings is to understand the workload that the disks associated with the adapters are handling and what their configuration is. 4.3.2, “Disk device tuning” on page 143 details the configuration attributes that are applied to hdisk devices in AIX.
Dedicated fiber channel adapters
The scenario of dedicated fiber channel (FC) adapters entails an AIX system or logical partition (LPAR) with exclusive use of one or more FC adapters. There are two devices associated with an FC adapter:
fcsN This is the actual adapter itself, and there is one of these devices per port on a fiber channel card. For example, you may have a dual port fiber channel card. Its associated devices could be fcs0 and fcs1.
fscsiN This is a child device that the FC adapter has which acts as a SCSI software interface to handle SCSI commands related to disk access. If you have a dual port fiber channel card associated with devices fcs0 and fcs1, their respective child devices will be fscsi0 and fscsi1.
Table 4-6 on page 151 describes attributes of the fcs device which it is advised to consider tuning.
Table 4-6 fcs device attributes
|
Attribute
|
Description
|
|
lg_term_dma
|
The attribute lg_term_dma is the size in bytes of the DMA memory area used as a transfer buffer. The default value of 0x800000 in most cases is sufficient unless there is a very large number of fiber channel devices attached. This value typically should only be tuned under the direction of IBM Support.
|
|
max_xfer_size
|
The max_xfer_size attribute dictates the maximum transfer size of I/O requests. Depending on the block size of the workload, this value may be increased from the default 0x100000 (1 MB) to 0x200000 (2 MB) when there are large block workloads, and the hdisk devices are tuned for large transfer sizes. This attribute must be large enough to accommodate the transfer sizes used by any child devices, such as an hdisk device.
|
|
num_cmd_elems
|
The attribute num_cmd_elems is the queue depth for the adapter. The maximum value for a fiber channel adapter is 2048 and this should be increased to support the total amount of I/O requests that the attached devices are sending to the adapter.
|
When tuning the attributes described in Table 4-6, the fcstat command can be used to establish whether the adapter is experiencing any performance issues (Example 4-30).
Example 4-30 fcstat output
root@aix1:/ # fcstat fcs0
FIBRE CHANNEL STATISTICS REPORT: fcs0
Device Type: 8Gb PCI Express Dual Port FC Adapter (df1000f114108a03) (adapter/pciex/df1000f114108a0)
Serial Number: 1C041083F7
Option ROM Version: 02781174
ZA: U2D1.11X4
World Wide Node Name: 0x20000000C9A8C4A6
World Wide Port Name: 0x10000000C9A8C4A6
FC-4 TYPES:
Supported: 0x0000012000000000000000000000000000000000000000000000000000000000
Active: 0x0000010000000000000000000000000000000000000000000000000000000000
Class of Service: 3
Port Speed (supported): 8 GBIT
Port Speed (running): 8 GBIT
Port FC ID: 0x010000
Port Type: Fabric
Seconds Since Last Reset: 270300
Transmit Statistics Receive Statistics
------------------- ------------------
Frames: 2503792149 704083655
Words: 104864195328 437384431872
LIP Count: 0
NOS Count: 0
Error Frames: 0
Dumped Frames: 0
Link Failure Count: 0
Loss of Sync Count: 8
Loss of Signal: 0
Primitive Seq Protocol Error Count: 0
Invalid Tx Word Count: 31
Invalid CRC Count: 0
IP over FC Adapter Driver Information
No DMA Resource Count: 3207
No Adapter Elements Count: 126345
FC SCSI Adapter Driver Information
No DMA Resource Count: 3207
No Adapter Elements Count: 126345
No Command Resource Count: 133
IP over FC Traffic Statistics
Input Requests: 0
Output Requests: 0
Control Requests: 0
Input Bytes: 0
Output Bytes: 0
FC SCSI Traffic Statistics
Input Requests: 6777091279
Output Requests: 2337796
Control Requests: 116362
Input Bytes: 57919837230920
Output Bytes: 39340971008
#
Highlighted in bold in the fcstat output in Example 4-30 on page 151 are the items of interest. These counters are held since system boot and Table 4-7 describes the problem and the suggested action.
Table 4-7 Problems detected in fcstat output
|
Problem
|
Action
|
|
No DMA Resource Count increasing
|
Increase max_xfer_size
|
|
No Command Resource Count
|
Increase num_cmd_elems
|
In Example 4-30 on page 151 we noticed that all three conditions in Table 4-7 are met, so we increased num_cmd_elems and max_xfer_size on the adapter.
Example 4-31 shows how to change fcs0 to have a queue depth (num_cmd_elems) of 2048, and a maximum transfer size (max_xfer_size) of 0x200000 which is 2 MB. The -P option was used on the chdev command for the attributes to take effect on the next reboot of the system.
Example 4-31 Modify the AIX fcs device
root@aix1:/ # chdev -l fcs0 -a num_cmd_elems=2048 -a max_xfer_size=0x200000 -P
fcs0 changed
root@aix1:/ #
|
Note: It is important to ensure that all fcs devices on the system that are associated with the same devices are tuned with the same attributes. If you have two FC adapters, you need to apply the settings in Example 4-31 to both of them.
|
There are no performance related tunables that can be set on the fscsi devices. However, there are two tunables that are applied. These are described in Table 4-8.
Table 4-8 fscsi device attributes
|
Attribute
|
Description
|
|
dyntrk
|
Dynamic tracking (dyntrk) is a setting that enables devices to remain online during changes in the SAN that cause an N_Port ID to change. This could be moving a cable from one switch port to another, for example.
|
|
fc_err_recov
|
Fiber channel event error recovery (fc_err_recov) has two possible settings. These are delayed_fail and fast_fail. The recommended setting is fast_fail when multipathed devices are attached to the adapter.
|
Example 4-32 demonstrates how to enable dynamic tracking and set the fiber channel event error recovery to fast_fail. The -P option on chdev will set the change to take effect at the next reboot of the system.
Example 4-32 Modify the AIX fscsi device
root@aix1:/ # chdev -l fscsi0 -a dyntrk=yes -a fc_err_recov=fast_fail -P
fscsi0 changed
root@aix1:/ #
|
Note: It is important to ensure that all fscsi devices on the system that are associated with the same devices are tuned with the same attributes.
|
NPIV
The attributes applied to a virtual fiber channel adapter on an AIX logical partition are exactly the same as those of a physical fiber channel adapter, and should be configured exactly as described in dedicated fiber channel adapters in this section.
The difference with NPIV is that on the VIO server there is a fiber channel fcs device that is shared by up to 64 client logical partitions. As a result there are a few critical considerations when using NPIV:
•Does the queue depth (num_cmd_elems) attribute on the fcs device support all of the logical partitions connecting NPIV to the adapter? In the event that the fcstat command run on the Virtual I/O server provides evidence that the queue is filling up (no adapter elements count and no command resource count), the queue depth will need to be increased. If queue_depth has already been increased, the virtual fiber channel mappings may need to be spread across more physical fiber channel ports where oversubscribed ports are causing a performance degradation.
•Does the maximum transfer size (max_xfer_size) set on the physical adapter on the VIO server match the maximum transfer size on the client logical partitions accessing the port? It is imperative that the maximum transfer size set in AIX on the client logical partition matches the maximum transfer size set on the VIO server’s fcs device that is being accessed.
Example 4-33 demonstrates how to increase the queue depth and maximum transfer size on a physical FC adapter on a VIO server.
|
Note: In the event that an AIX LPAR has its fcs port’s attribute max_xfer_size greater than that of the VIO server’s fcs port attribute max_xfer_size, it may cause the AIX LPAR to hang on reboot.
|
Example 4-33 Modify the VIO fcs device
$ chdev -dev fcs0 -attr num_cmd_elems=2048 max_xfer_size=0x200000 -perm
fcs0 changed
$
The settings dynamic tracking and FC error recovery discussed in Table 4-8 on page 153 are enabled by default on a virtual FC adapter in AIX. They are not, however, enabled by default on the VIO server. Example 4-34 demonstrates how to enable dynamic tracking and set the FC error recovery to fast fail on a VIO server.
Example 4-34 Modify the VIO fscsi device
$ chdev -dev fscsi0 -attr dyntrk=yes fc_err_recov=fast_fail -perm
fscsi0 changed
$
|
Note: If the adapter is in use, you have to make the change permanent with the -perm flag of chdev while in restricted shell. However, this change will only take effect next time the VIOS is rebooted.
|
Virtual SCSI
There are no tunable values related to performance for virtual SCSI adapters. However, there are two tunables that should be changed from their defaults in an MPIO environment with dual VIO servers. The virtual SCSI description in this section applies to both shared storage pools and traditional virtual SCSI implementations.
These settings are outlined in Table 4-9.
Table 4-9 vscsi device attributes
|
Attribute
|
Description
|
|
vscsi_err_recov
|
The vscsi_err_recov is used to determine how the vscsi driver will handle failed I/O requests. Possible values are set to delayed_fail and fast_fail. In scenarios where there are dual VIO servers and disk devices are multipathed, the recommended value is fast_fail so that in the event that an I/O request cannot be serviced by a path, that path is immediately failed. The vscsi_err_recov attribute is set to delayed_fail by default. Note that there is no load balancing supported across devices multipathed on multiple vscsi adapters.
|
|
vscsi_path_to
|
This is disabled by being set to 0 by default. The vscsi_path_to attribute allows the vscsi adapter to determine the health of its associated VIO server and in the event of a path failure, it is a polling interval in seconds where the failed path is polled and once it is able to resume I/O operations the path is automatically re-enabled.
|
Example 4-35 demonstrates how to enable vscsi_err_recov to fast fail, and set the vscsi_path_to to be set to 30 seconds.
Example 4-35 Modify the AIX vscsi device
root@aix1:/ # chdev -l vscsi0 -a vscsi_path_to=30 -a vscsi_err_recov=fast_fail -P
vscsi0 changed
root@aix1:/ # chdev -l vscsi1 -a vscsi_path_to=30 -a vscsi_err_recov=fast_fail -P
vscsi1 changed
|
Note: If the adapter is in use, you have to make the change permanent with the -P flag. This change will take effect next time AIX is rebooted.
|
In a virtual SCSI MPIO configuration, there is a path to each disk per virtual SCSI adapter. For instance, in Example 4-36, we have three virtual SCSI disks. One is the root volume group, the other two are in a volume group called data_vg.
Example 4-36 AIX virtual SCSI paths
root@aix1:/ # lspv
hdisk0 00f6600e0e9ee184 rootvg active
hdisk1 00f6600e2bc5b741 data_vg active
hdisk2 00f6600e2bc5b7b2 data_vg active
root@aix1:/ # lspath
Enabled hdisk0 vscsi0
Enabled hdisk0 vscsi1
Enabled hdisk1 vscsi0
Enabled hdisk2 vscsi0
Enabled hdisk1 vscsi1
Enabled hdisk2 vscsi1
root@aix1:/ #
By default, all virtual SCSI disks presented to a client logical partition use the first path by default. Figure 4-10 illustrates a workload running on the two virtual SCSI disks multipathed across with all of the disk traffic being transferred through vscsi0, and no traffic being transferred through vscsi1.

Figure 4-10 Unbalanced vscsi I/O
It is not possible to use a round robin or load balancing type policy on a disk device across two virtual SCSI adapters. A suggested way to get around this is to have your logical volume spread or striped across an even number of hdisk devices with half transferring its data through one vscsi adapter and the other half transferring its data through the other vscsi adapter. The logical volume and file system configuration is detailed in 4.4, “AIX LVM and file systems” on page 157.
Each path to an hdisk device has a path priority between 1 and 255. The path with the lowest priority is used as the primary path. To ensure that I/O traffic is transferred through one path primarily you can change the path priority of each path. In Example 4-37, hdisk2 has a path priority of 1 for each vscsi path. To balance the I/O, you can change vscsi1 to be the primary path by setting a higher path priority on the vscsi1 adapter.
Example 4-37 Modifying vscsi path priority
root@aix1:/ # lspath -AEl hdisk2 -p vscsi0
priority 1 Priority True
root@aix1:/ # lspath -AEl hdisk2 -p vscsi1
priority 1 Priority True
root@aix1:/ # chpath -l hdisk2 -a priority=2 -p vscsi0
path Changed
root@aix3:/ #
In Figure 4-11, the exact same test is performed again and we can see that I/O is evenly distributed between the two vscsi adapters.

Figure 4-11 Balanced vscsi I/O
Another performance implication is the default queue_depth of a VSCSI adapter of 512 per adapter. However, two command elements are reserved for the adapter itself and three command elements for each virtual disk.
The number of command elements (queue depth) of a virtual SCSI adapter cannot be changed, so it is important to work out how many virtual SCSI adapters you will need.
Initially, you need to understand two things to calculate how many virtual SCSI adapters are be required:
•How many virtual SCSI disks will be mapped to the LPAR?
•What will be the queue_depth of each virtual SCSI disk? Calculating the queue depth for a disk is covered in detail in “Disk device tuning” on page 143.
The formula for how many virtual drives can be mapped to a virtual SCSI adapter is:
virtual_drives = (512 - 2) / (queue_depth_per_disk + 3)
For example, each virtual SCSI disk has a queue_depth of 32. You can have a maximum of 14 virtual SCSI disks assigned to each virtual SCSI adapter:
(512 - 2) / (32 + 3) = 14.5
In the event that you require multiple virtual SCSI adapters, Figure 4-12 provides a diagram of how this can be done.

Figure 4-12 Example AIX LPAR with four vscsi adapters
|
Note: IBM PowerVM Virtualization Introduction and Configuration, SG24-7940-04, explains in detail how to configure virtual SCSI devices.
|
4.4 AIX LVM and file systems
In this chapter we focus on LVM and file systems performance, and best practices.
4.4.1 Data layout
Data layout is the most important part in I/O performance. The ultimate goal is to balance I/O across all paths including adapters, loops, disks, and to avoid I/O hotspot. Usually this contributes more to performance than any I/O tunables. In the following section, we introduce best practices on balancing I/O, and share some experiences on monitoring.
Random I/O best practice
For random I/O, the aim is to spread I/Os evenly across all physical disks. Here are some general guidelines:
•On disk subsystem, create arrays of equal size and type.
•Create VGs with one LUN per array.
•Spread all LVs across all PVs in the VG.
Sequential I/O best practice
For sequential I/O, the aim is to ensure full stripe write on the storage RAID. Here are some general guidelines:
1. Create RAID arrays with data spread across a power of two of disks.
a. RAID 5 arrays of 4+1 or 8+1 disks
b. RAID10 arrays of 4 or 8 disks
2. Create VGs with one LUN per array.
3. Create LVs that are spread across all PVs in the VG using a PP or LV strip size larger than or equal to the full stripe size on the RAID array
a. The number of data disks times the segment size is equal to the array (full) stripe size.
b. 8+1 RAID5 with a 256 KB segment size → 8 * 256 KB = 2048 KB stripe size
c. 4+4 RAID10 with a 256 KB segment size → 4 * 256 KB = 1024 KB stripe size
4. Application I/Os equal to or a multiple of a full stripe on the RAID array.
|
Note: Ensure full stripe write is critical for RAID5 to avoid write penalties. Also we suggest that you check with your storage vendor for any specific best practice related to your storage system.
|
How to determine the nature of I/O
We can have an empirical judgement on whether the I/O type is sequential or random. For example, database files are usually random, and log files are usually sequential. There are tools to observe this. Example 4-38 shows a filemon approach to identify whether the current I/O is sequential or random. For more details on the filemon utility, refer to 4.4.4, “The filemon utility” on page 176.
Example 4-38 filemon usage
# filemon -T 1000000 -u -O all,detailed -o fmon.out
# sleep 3
# trcstop
Example 4-39 shows output of the filemon with the options specified in Example 4-38. The percent of seeks indicates the nature of the I/O. If seek is near zero, it means the I/O is sequential. If seek is near 100%, most I/Os are random.
Example 4-39 filemon ouput
------------------------------------------------------------------------
Detailed Logical Volume Stats (512 byte blocks)
------------------------------------------------------------------------
...
VOLUME: /dev/sclvdst1 description: N/A
reads: 39 (0 errs)
read sizes (blks): avg 8.0 min 8 max 8 sdev 0.0
read times (msec):avg 30.485 min 3.057 max 136.050 sdev 31.600
read sequences: 39
read seq. lengths:avg 8.0 min 8 max 8 sdev 0.0
writes: 22890(0 errs)
write sizes (blks): avg 8.0 min 8 max 8 sdev 0.0
write times (msec):avg 15.943 min 0.498 max 86.673 sdev 10.456
write sequences: 22890
write seq. lengths:avg 8.0 min 8 max 8 sdev 0.0
seeks: 22929(100.0%)
seek dist (blks):init 1097872,
avg 693288.4 min 56 max 2088488 sdev 488635.9
time to next req(msec): avg 2.651 min 0.000 max 1551.894 sdev 53.977
throughput:1508.1 KB/sec
utilization:0.05
|
Note: Sequential I/O might degrade to random I/O if the data layout is not appropriate. If you get a filemon result that is contrary to empirical judgement, pay more attention to it. It might indicate a data layout problem.
|
RAID policy consideration
Table 4-10 explains the general performance comparison between RAID5 and RAID10. Here are some general guidelines:
•With enterprise class storage (large cache), RAID-5 performances are comparable to RAID-10 (for most customer workloads).
•Consider RAID-10 for workloads with a high percentage of random write activity (> 25%) and high I/O access densities (peak > 50%).
RAID5 is not a good choice for such situations due to write penalty in random write access. One random write might result in two read operations and two write operations.
Table 4-10 RAID5 and RAID10 performance comparison
|
I/O characteristics
|
RAID-5
|
RAID-10
|
|
Sequential read
|
Excellent
|
Excellent
|
|
Sequential write
|
Excellent
|
Good
|
|
Random read
|
Excellent
|
Excellent
|
|
Random write
|
Fair
|
Excellent
|
4.4.2 LVM best practice
Here are some general guidelines:
•Use scalable VGs for AIX 5.3 and later releases as it has no LVCB in the head of the LV which ensure better I/O alignment. Also scalable VG has larger maximum PV/LV/PP numbers per VG.
•Use RAID in preference to LVM mirroring
Using RAID reduces I/Os because there is no additional writes to ensure mirror write consistency (MWC) compared to LVM mirroring.
•LV striping best practice
– Create a logical volume with the striping option.
• mklv -S <strip-size> ...
• Specify the stripe width with the -C or the -u option, or specify two or more physical volumes.
• When using LV striping, the number of logical partitions should be a multiple of the stripe width. Example 4-40 on page 160 shows an example of creating logical volumes (LV) with 2 MB striping.
Example 4-40 create an LV using LV striping
#mklv -t jfs2 -C 4 -S2M -y lvdata01 datavg 32
– Valid LV strip sizes range from 4 KB to 128 MB in powers of 2 for striped LVs. The SMIT panels may not show all LV strip options, depending on your AIX version.
– Use an LV strip size larger than or equal to the stripe size on the storage side, to ensure full stripe write. Usually the LV strip size should be larger than 1 MB. Choose the strip size carefully, because you cannot change the strip size after you created the LV.
– Do not use LV striping for storage systems that already have the LUNs striped across multiple RAID/disk groups such as XIV, SVC, and V7000. We suggest PP striping for this kind of situation.
|
Note: We use the glossary strip here. The LV strip size multiplied by the LV stripe width (number of disks for the striping) equals the stripe size of the LV.
|
•PP striping best practice
– Create LV with the maximum range of physical volumes option to spread PP on different hdisks in a round robin fashion:
Example 4-41 create lv using PP striping
#mklv -t jfs2 -e x -y lvdata02 datavg 32
– Create a volume group with an 8 M,16 M or 32 M PP size. PP size is the strip size.
|
Note: LV striping can specify smaller strip sizes than PP striping, and this sometimes gets better performance in a random I/O scenario. However, it would be more difficult to add physical volumes to the LV and rebalance the I/O if using LV striping. We suggest to use PP striping unless you have a good reason for LV striping.
|
LVM commands
This section explains LVM commands.
1. lsvg can be used to view VG properties. As in Example 4-42, MAX PVs is equal to 1024, which means it is a scalable volume group.
Example 4-42 lsvg output
#lsvg datavg
VOLUME GROUP: datavg VG IDENTIFIER: 00f6601100004c000000013a32716c83
VG STATE: active PP SIZE: 32 megabyte(s)
VG PERMISSION: read/write TOTAL PPs: 25594 (819008 megabytes)
MAX LVs: 256 FREE PPs: 24571 (786272 megabytes)
LVs: 6 USED PPs: 1023 (32736 megabytes)
OPEN LVs: 4 QUORUM: 2 (Enabled)
TOTAL PVs: 2 VG DESCRIPTORS: 3
STALE PVs: 0 STALE PPs: 0
ACTIVE PVs: 2 AUTO ON: yes
MAX PPs per VG: 32768 MAX PVs: 1024
LTG size (Dynamic): 1024 kilobyte(s) AUTO SYNC: no
HOT SPARE: no BB POLICY: relocatable
MIRROR POOL STRICT: off
PV RESTRICTION: none INFINITE RETRY: no
– INTER-POLICY equal to “maximum” means the LV is using PP striping policy.
– UPPER BOUND specifies the maximum number of PVs the LV can be created on. 1024 means the volume group is scalable VG.
– DEVICESUBTYPE equals to DS_LVZ, which means there is no LVCB in the head of the LV.
– IN BAND value shows the percentage of partitions that met the intra-policy criteria of the LV.
Example 4-43 lslv command output
#lslv testlv
LOGICAL VOLUME: testlv VOLUME GROUP: datavg
LV IDENTIFIER: 00f6601100004c000000013a32716c83.5 PERMISSION: read/write
VG STATE: active/complete LV STATE: closed/syncd
TYPE: jfs WRITE VERIFY: off
MAX LPs: 512 PP SIZE: 32 megabyte(s)
COPIES: 1 SCHED POLICY: parallel
LPs: 20 PPs: 20
STALE PPs: 0 BB POLICY: relocatable
INTER-POLICY: maximum RELOCATABLE: yes
INTRA-POLICY: middle UPPER BOUND: 1024
MOUNT POINT: N/A LABEL: None
DEVICE UID: 0 DEVICE GID: 0
DEVICE PERMISSIONS: 432
MIRROR WRITE CONSISTENCY: on/ACTIVE
EACH LP COPY ON A SEPARATE PV ?: yes
Serialize IO ?: NO
INFINITE RETRY: no
DEVICESUBTYPE: DS_LVZ
COPY 1 MIRROR POOL: None
COPY 2 MIRROR POOL: None
COPY 3 MIRROR POOL: None
#lslv -l testlv
testlv:N/A
PV COPIES IN BAND DISTRIBUTION
hdisk2 010:000:000 100% 000:010:000:000:000
hdisk1 010:000:000 100% 000:010:000:000:000
•Use lslv -p hdisk# lvname to show the placement of LV on the specific hdisk, as shown in Example 4-44 on page 162. The state of the physical partition is as follows:
– USED means the physical partition is used by other LVs than the one specified in the command.
– Decimal number means the logical partition number of the LV lies on the physical partition.
– FREE means the physical partition is not used by any LV.
Example 4-44 lslv -p output
# lslv -p hdisk2 informixlv
hdisk2:informixlv:/informix
USED USED USED USED USED USED USED USED USED USED 1-10
…
USED USED USED USED 101-104
0001 0002 0003 0004 0005 0006 0007 0008 0009 0010 105-114
0011 0012 0013 0014 0015 0016 0017 0018 0019 0020 115-124
0021 0022 0023 0024 0025 0026 0027 0028 0029 0030 125-134
…
0228 0229 0230 0231 0232 0233 0234 0235 0236 0237 332-341
0238 0239 0240 USED USED USED USED USED USED USED 342-351
…
USED USED USED FREE 516-519
Example 4-45 lslv -m lvname
#lslv -m testlv
testlv:N/A
LP PP1 PV1 PP2 PV2 PP3 PV3
0001 2881 hdisk2
0002 2882 hdisk1
0003 2882 hdisk2
0004 2883 hdisk1
0005 2883 hdisk2
0006 2884 hdisk1
0007 2884 hdisk2
0008 2885 hdisk1
0009 2885 hdisk2
0010 2886 hdisk1
0011 2886 hdisk2
0012 2887 hdisk1
0013 2887 hdisk2
0014 2888 hdisk1
0015 2888 hdisk2
0016 2889 hdisk1
0017 2889 hdisk2
0018 2890 hdisk1
0019 2890 hdisk2
0020 2891 hdisk1
•Use lspv -p hdisk1 to get the distribution of LVs on the physical volume, as shown in Example 4-46.
Example 4-46 lspv -p hdisk#
#lspv -p hdisk1|pg
hdisk1:
PP RANGE STATE REGION LV NAME TYPE MOUNT POINT
1-2560 free outer edge
2561-2561 used outer middle loglv00 jfs2log N/A
2562-2721 used outer middle fslv00 jfs2 /iotest
2722-2881 used outer middle fslv02 jfs2 /ciotest512
2882-2891 used outer middle testlv jfs N/A
2892-5119 free outer middle
5120-7678 free center
7679-10237 free inner middle
10238-12797 free inner edge
Logical track group (LTG) size consideration
When the LVM layer receives an I/O request, it breaks the I/O down into multiple logical track group (LTG) sized I/O requests, and then submits them to the device driver of the underlying disks.
Thus LTG is actually the maximum transfer size of an LV, and it is common to all LVs in the same VG. LTG is similar to the MTU in network communications. Valid LTG sizes include 4 K, 8 K, 16 K, 32 K, 64 K, 128 K, 1 M, 2 M, 4 M, 8 M, 16 M, 32 M, and 128 M.
The LTG size should not be larger than the lowest maximum transfer size of the underlying disks in the same volume group. Table 4-11 shows the max transfer size attribute in different I/O layers.
Table 4-11 max transfer sizes in AIX I/O stack
|
LVM layer
|
logical track group (LTG)
|
|
Disk device drivers
|
max_transfer
|
|
Adapter device drivers
|
max_xfer_size
|
For performance considerations, the LTG size should match the I/O request size of the application. The default LTG value is set to the lowest maximum transfer size of all the underlying disks in the same VG. The default is good enough for most situations.
4.4.3 File system best practice
Journaled File System (JFS) is the default file system in AIX 5.2 and earlier AIX releases, while the Enhanced Journaled File System (JFS2) is the default file system for AIX 5.3 and later AIX releases. We can exploit JFS/JFS2 features according to application characteristics for better performance.
Conventional I/O
For read operations, the operating system needs to access the physical disk, read the data into file system cache, and then copy the cache data into the application buffer. The application is blocked until the cache data is copied into the application buffer.
For write operations, the operating system copies the data from the application buffer into file system cache, and flushes the cache to physical disk later at a proper time. The application returns after the data is copied to the file system cache, and thus there is no block of the physical disk write.
This kind of I/O is usually suitable for workloads that have a good file system cache hit ratio. Applications that can benefit from the read ahead and write behind mechanism are also good candidates for conventional I/O. The following section is a brief introduction of the read ahead and write behind mechanism.
•Read ahead mechanism
JFS2 read ahead is controlled by two ioo options, j2_minPageReadAhead and j2_maxPageReadAhead, specifying the minimum page read ahead and maximum page read ahead, respectively. The j2_minPageReadAhead option is 2 by default, and it is also the threshold value to trigger an I/O read ahead. You can disable the sequential I/O read ahead by setting j2_minPageReadAhead to 0, if the I/O pattern is purely random.
The corresponding options for JFS are minpgahead and maxpghead. The functionality is almost the same as the JFS2 options.
•Write behind mechanism
There are two types of write behind mechanisms for JFS/JFS2, as follows:
– Sequential write behind
JFS2 sequential write behind is controlled by the j2_nPagesPerWriteBehindCluster option, which is 32 by default. This means that if there are 32 consecutive dirty pages in the file, a physical I/O will be scheduled. This option is good for smoothing the I/O rate when you have an occasional I/O burst.
It is worthwhile to change j2_nPagesPerWriteBehindCluster to a larger value if you want to keep more pages in RAM before scheduling a physical I/O. However, this should be tried with caution because it might cause a heavy workload to syncd, which runs every 60 seconds by default.
The corresponding ioo option for JFS is numclust in units of 16 K.
|
Note: This is a significant difference of AIX JFS/JFS2 from other file sytems. If you are doing a small sized dd test less than the memory size, you will probably find the response time on AIX JFS2 to be much longer than on other operating systems. You can disable the sequential write behind by setting j2_nPagesPerWriteBehindCluster to 0 to get the same behavior. However, we suggest you keep the default value as it is, which is usually a better choice for most real workloads.
|
– Random write behind
JFS2 random write behind is used to control the number of random dirty pages to reduce the workload of syncd. This reduces the possible application pause when accessing files due to the inode locking when syncd is doing a flush. The random write behind is controlled by the j2_maxRandomWrite and j2_nRandomCluster ioo option, and is disabled by default on AIX.
The corresponding ioo option for JFS is maxrandwrt.
As just mentioned, the JFS/JFS2 file system will cache the data in read and write accesses for future I/O operations. If you do not want to reuse the AIX file system cache, there are release behind mount options to disable it. Usually these features are good for doing an archive or recovering from an achive. Table 4-12 on page 165 gives an explanation of these mount options. Note that these options only apply when doing sequential I/O.
Table 4-12 Release behind options
|
Mount options
|
Explanation
|
|
rbr
|
Release behind when reading; it only applies when sequential I/O is detected.
|
|
rbw
|
Release behind when writing; it only applies when sequential I/O is detected.
|
|
rbrw
|
The combination of rbr and rbw.
|
Direct I/O
Compared to conventional I/O, direct I/O bypasses the file system cache layer (VMM), and exchanges data directly with the disk. An application that already has its own cache buffer is likely to benefit from direct I/O. To enable direct I/O, mount the file system with the dio option, as shown in Example 4-47.
Example 4-47 mount with DIO option
#mount -o dio <file system name>
To make the option persistent across a boot, use the chfs command as shown in Example 4-48 because it adds the mount options to the stanza of the related file system in /etc/filesystems.
Example 4-48 Use chfs to set the direct I/O option
#chfs -a options=dio /diotest
The application can also open the file with O_DIRECT to enable direct I/O. You can refer to the manual of the open subroutine on the AIX infocenter for more details at:
http://pic.dhe.ibm.com/infocenter/aix/v6r1/topic/com.ibm.aix.basetechref/doc/basetrf1/open.htm
|
Note: For DIO and CIO, the read/write requests should be aligned on the file block size boundaries. Both the offset and the length of the I/O request should be aligned. Otherwise, it might cause severe performance degradation due to I/O demotion.
For a file system with a smaller file block size than 4096, the file must be allocated first to avoid I/O demotion. Otherwise I/O demotions still occur during the file block allocations.
|
Table 4-13 explains the alignment requirements for DIO mounted file systems.
Table 4-13 Alignment requirements for DIO and CIO file systems
|
Available file block sizes at file system creation
|
I/O request offset
|
I/O request length
|
|
agblksize='512', ‘1024’, 2048’, ‘4096’
|
Multiple of agblksize
|
Multiple of agblksize
|
Example 4-49 on page 166 shows the trace output of a successful DIO write when complying with the alignment requirements. For details on tracing facilities, refer to “Trace tools and PerfPMR” on page 316.
Example 4-49 successful DIO operations
#trace -aj 59B
#sleep 5; #trcstop
#trcrpt > io.out
#more io.out
...
59B 9.232345185 0.008076 JFS2 IO write: vp = F1000A0242B95420, sid = 800FC0, offset = 0000000000000000, length = 0200
59B 9.232349035 0.003850 JFS2 IO dio move: vp = F1000A0242B95420, sid = 800FC0, offset = 0000000000000000, length = 0200
//comments: “JFS2 IO dio move” means dio is attempted.
59B 9.232373074 0.024039 JFS2 IO dio devstrat: bplist = F1000005B01C0228, vp = F1000A0242B95420, sid = 800FC0, lv blk = 290A, bcount = 0200
//comments: “JFS2 IO dio devstrat” will be displayed if the alignment requirements are met. The offset is 0, and length is 0x200=512, whilst the DIO file system is created with agblksize=512.
59B 9.232727375 0.354301 JFS2 IO dio iodone: bp = F1000005B01C0228, vp = F1000A0242B95420, sid = 800FC0
//comments: “JFS2 IO dio iodone” will be displayed if DIO is finished successfully.
Example 4-50 shows an I/O demotion situation when failing to comply with the alignment requirements, and how to identify the root cause of the I/O demotion.
Example 4-50 DIO demotion
#trace -aj 59B
#sleep 5; trcstop
#trcrpt > io.out
#more io.out
...
59B 1.692596107 0.223762 JFS2 IO write: vp = F1000A0242B95420, sid = 800FC0, offset = 00000000000001FF, length = 01FF
59B 1.692596476 0.000369 JFS2 IO dio move: vp = F1000A0242B95420, sid = 800FC0, offset = 00000000000001FF, length = 01FF
//comments: a DIO attempt is made, however, the alignment requirements are not met. The offset and length is both 0x1FF, which is 511. While the file system is created with agblksize=512.
...
59B 1.692758767 0.018394 JFS2 IO dio demoted: vp = F1000A0242B95420, mode = 0001, bad = 0002, rc = 0000,
rc2 = 0000
//comments: “JFS2 IO dio demoted” means there is I/O demotion.
To locate the file involved in the DIO demotion, we can use the svmon command. As in the trcrpt output above, “sid = 800FC0” when the demoted I/O happens.
#svmon -S 800FC0 -O filename=on
Unit: page
Vsid Esid Type Description PSize Inuse Pin Pgsp Virtual
800fc0 - clnt /dev/fslv00:5 s 0 0 - -
/iotest/testw
Then we know that DIO demotion happened on file “/iotest/testw”.
AIX trace can also be used to find the process or thread that caused the I/O demotion. Refer to “Trace tools and PerfPMR” on page 316. There is also an easy tool provided to identify I/O demotion issues.
|
Note: CIO is implemented based on DIO; thus the I/O demotion detection approaches also apply for CIO mounted file systems.
|
Concurrent I/O
POSIX standard requires file systems to impose inode locking when accessing files to avoid data corruption. It is a kind of read write lock that is shared between reads, and exclusive between writes.
In certain cases, applications might already have a finer granularity lock on their data files, such as database applications. Inode locking is not necessary in these situations. AIX provides concurrent I/O for such requirements. Concurrent I/O is based on direct I/O, but enforces the inode locking in shared mode for both read and write accesses. Multiple threads can read and write the same file simultaneously using the locking mechanism of the application.
However, the inode would still be locked in exclusive mode in case the contents of the inode need to be changed. Usually this happens when extending or truncating a file, because the allocation map of the file in inode needs to be changed. So it is good practice to use a fixed-size file in case of CIO.
Figure 4-13 on page 168 gives an example of the inode locking in a JFS2 file system. Thread0 and thread1 can read data from a shared file simultaneously because a read lock is in shared mode. However, thread0 cannot write data to the shared file until thread1 finishes reading the shared file. When the read lock is released, thread0 is able to get a write lock. Thread1 is blocked on the following read or write attemps because thread0 is holding an exclusive write lock.

Figure 4-13 inode locking in a JFS2 file system
Figure 4-14 on page 169 gives an example of the inode locking in a CIO mounted JFS2 file system. Thread0 and thread1 can read and write the shared file simultaneously. However, when thread1 is extending or truncating the file, thread0 blocks read/write attempts. After the extending or truncating finishes, thread0 and thread1 can simultaneously access the shared file again.
. 
Figure 4-14 inode locking in CIO mounted JFS2 file system.
If the application does not have any kind of locking control for shared file access, it might result in data corruption. Thus CIO is usually only recommended for databases or applications that already have implemented fine level locking.
To enable concurrent I/O, mount the file system with the cio option as shown in Example 4-51.
Example 4-51 Mount with the cio option
#mount -o cio <file system name>
To make the option persistent across the boot, use the chfs command shown in Example 4-52.
Example 4-52 Use chfs to set the concurrent I/O option
#chfs -a options=cio /ciotest
The application can also open the file with O_CIO or O_CIOR to enable concurrent I/O. You can refer to the manual of the open subroutine on the AIX infocenter for more details.
|
Note: CIO inode locking still persists when extending or truncating files. So try to set a fixed size for files and reduce the chances of extending and truncating. Take an Oracle database as an example: set data files and redo log files to a fixed size and avoid using the auto extend feature.
|
Asynchronous I/O
If an application issues a synchronous I/O operation, it must wait until the I/O completes. Asynchronous I/O operations run in the background and will not block the application. This improves performance in certain cases, because you can overlap I/O processing and other computing tasks in the same thread.
AIO on raw logical volumes is handled by the kernel via the fast path, which will be queued into the LVM layer directly. Since AIX 5.3 TL5 and AIX 6.1, AIO on CIO mounted file systems can also submit I/O via the fast path, and AIX 6.1 enables this feature by default. In these cases, you do not need to tune the AIO subsystems. Example 4-53 shows how to enable the AIO fastpath for CIO mounted file systems on AIX 5.3, and also the related ioo options in AIX 6.1.
Example 4-53 AIO fastpath settings in AIX 5.3, AIX 6.1 and later releases
For AIX5.3, the fast path for CIO mounted file system is controlled by aioo option fsfastpath. Note it is not a persistent setting, so we suggest adding it to the inittab if you use it.
#aioo -o fsfastpath=1
For AIX6.1 and later release, the fast path for CIO mounted file system is on by default.
#ioo -L aio_fastpath -L aio_fsfastpath -L posix_aio_fastpath -L posix_aio_fsfastpath
NAME CUR DEF BOOT MIN MAX UNIT TYPE
DEPENDENCIES
--------------------------------------------------------------------------------
aio_fastpath 1 1 1 0 1 boolean D
--------------------------------------------------------------------------------
aio_fsfastpath 1 1 1 0 1 boolean D
--------------------------------------------------------------------------------
posix_aio_fastpath 1 1 1 0 1 boolean D
--------------------------------------------------------------------------------
posix_aio_fsfastpath 1 1 1 0 1 boolean D
--------------------------------------------------------------------------------
For other kinds of AIO operations, the I/O requests are handled by AIO servers. You might need to tune the maximum number of AIO servers and the service queue size in such cases. In AIX 5.3, you can change the minservers, maxservers, and maxrequests with smitty aio. AIX 6.1 has more intelligent control over the AIO subsystem, and the aio tunables are provided with the ioo command. For legacy AIO, the tunables are aio_maxservers, aio_minservers, and aio_maxreqs. For POSIX AIO, the tunables are posix_aio_maxservers, posix_aio_minservers, and posix_aio_maxreqs.
For I/O requests that are handled by AIO servers, you can use ps -kf|grep aio to get the number of aioserver kernel processes. In AIX6.1, the number of aioservers can be dynamically adjusted according to the AIO workload. You can use this as an indicator for tuning the AIO subsystem. If the number of aioservers reaches the maximum, and there is still lots of free processor and unused I/O bandwidth, you can increase the maximum number of AIO servers.
Tip
|
Note: Note: AIO is compatible with all kinds of mount options, including DIO and CIO. Databases are likely to benefit from AIO.
|
Tipcan use the iostat command to retrieve AIO statistics. Table 4-14 shows the iostat options for AIO, and Example 4-54 gives an example of using iostat for AIO statistics. Note that at the time of writing this book, iostat statistics are not implemented for file system fastpath AIO requests used with the CIO option.
Table 4-14 iTipstat options for AIO statistics
|
Options
|
Explanation
|
|
-A
|
Display AIO statistics for AIX Legacy AIO.
|
|
-P
|
Display AIO statistics for POSIX AIO.
|
|
-Q
|
Displays a list of all the mounted file systems and the associated queue numbers with their request counts.
|
|
-q
|
Specifies AIO queues and their request counts.
|
Example 4-54 Tip statistics from iostat
ostat -PQ 1 100
System configuration: lcpu=8 maxserver=240
aio: avgc avfc maxgc maxfc maxreqs avg-cpu: % user % sys % idle % iowait
845.0 0.0 897 0 131072 0.5 4.0 72.8 22.7
Queue# Count Filesystems
129 0 /
130 0 /usr
...
158 845 /iotest
The meanings of the metrics are shown in Table 4-15.
Table 4-15 iostat -A and iostat -P metrics
|
Column
|
Description
|
|
avgc
|
Average global AIO request count per second for the specified interval.
|
|
avfc
|
Average fastpath request count per second for the specified interval.
|
|
maxgc
|
Maximum global AIO request count since the last time this value was fetched.
|
|
maxfc
|
Maximum fastpath request count since the last time this value was fetched.
|
|
maxreqs
|
Specifies the maximum number of asynchronous I/O requests that can be outstanding at one time.
|
|
Note: If the AIO subsystem is not enabled on AIX 5.3, or has not been used on AIX 6.1, you get the error statement Asynchronous I/O not configured on the system.
|
Miscellaneous options
This section provides a few miscellaneous options.
noatime
According to the POSIX standard, every time you access a file, the operating system needs to update the “last access time” timestamp in the inode.
The noatime option is not necessary for most applications while it might deteriorate performance in case of heavy inode activities. To enable the noatime option, mount the file system with noatime:
mount -o noatime <file system name>
To make the option persistent, use the chfs command shown in Example 4-55.
Example 4-55 Use chfs to set the noatime option
#chfs -a options=noatime /ciotest
Use a comma to separate multiple options. To change the default mount options to CIO and noatime:
#chfs -a options=cio,noatime /datafile
To change to default mount options to rbrw and noatime:
#chfs -a options=rbrw,noatime /archive
Creating an additional JFS/JFS2 log device
The JFS/JFS2 log works as follows:
•AIX uses a special logical volume called the log device as a circular journal for recording modifications to the file system metadata.
•File system metadata includes the superblock, inodes, indirect data pointers, and directories.
•When metadata is modified, a duplicate transaction is made to the JFS/JFS2 log.
•When a sync or fsync occurs, commit records are written to the JFS/JFS2 log to indicate that modified pages in memory have been committed to disk.
By default, all the file systems belong to the same VG and share the same log device. You can use the lvmstat or filemon commands to monitor the status of the log device as shown in Example 4-56. You need to enable the statistics for the logical volumes you observe, and disable the statistics after you finish observing. Note that the first line of lvmstat ouput is a cumulative value since the recording is enabled.
Example 4-56 Using lvmstat to monitor log device activities
#lvmstat -l loglv00 -e
#lvmstat -l loglv00 5
...
Log_part mirror# iocnt Kb_read Kb_wrtn Kbps
1 1 2579 0 10316 2063.20
...
#lvmstat -l loglv00 -d
If the log device is busy, you can create a dedicated log device for critical file systems, as shown in Example 4-57 on page 173.
Example 4-57 Creating an additional JFS/JFS2 log device
Create new JFS or JFS2 log logical volume,
For JFS,
#mklv -t jfslog -y LVname VGname 1 PVname
For JFS2,
#mklv -t jfs2log -y LVname VGname 1 PVname
Unmount the filesystem and then format the log
#/usr/sbin/logform /dev/LVname
Modify /etc/filesystems and LVCB to use this log
#chfs -a log=/dev/LVname /filesystemname
mount filesystem
Using an INLINE log device
If the log device is the bottleneck, creating dedicated log devices is a viable solution. However, you might have large numbers of file systems that make the administration tedious. To circumvent this, AIX provides the INLINE log device for JFS2, and you can specify this option when creating the file system. Then each file system will have its own INLINE log device.
To create a file system with the INLINE log device:
#crfs -a logname=INLINE …
Or use smitty crfs and choose INLINE for the logical volume log. Note that JFS does not support INLINE log devices.
|
Note: We suggest using the INLINE log device with CIO mounted file systems.
|
Disabling JFS/JFS2 logging
JFS/JFS2 logging is critical for data integrity. However, there are some cases where you can disable it temporarily for performance. For example, if you are recovering the entire file system from backup, you can disable JFS/JFS2 logging for fast recovery. After the work is done, you can enable JFS/JFS2 logging again. Example 4-58 shows how to disable JFS/JFS2 logging.
Example 4-58 Disabling JFS/JFS2 logging
For JFS,
#mount -o nointegrity /jfs_fs
For JFS2(AIX6.1 and later releases),
#mount -o log=NULL /jfs2_fs
Another scenario for disabling a logging device is when using a RAM disk file system. Logging is not necessary because there is no persistent storage for RAM disk file systems. Example 4-59 shows how to create a RAM disk file system on AIX.
Example 4-59 Creating a RAM disk file system on AIX
# mkramdisk 1G
/dev/rramdisk0
# mkfs -V jfs2 /dev/ramdisk0
mkfs: destroy /dev/ramdisk0 (y)? y
File system created successfully.
1048340 kilobytes total disk space.
...
# mkdir /ramfs
# mount -V jfs2 -o log=NULL /dev/ramdisk0 /ramfs
# mount
node mounted mounted over vfs date options
-------- --------------- --------------- ------ ------------ ---------------
...
/dev/ramdisk0 /ramfs jfs2 Oct 08 22:05 rw,log=NULL
|
Note: AIX 5.3 does not support disabling JFS2 logging because AIX 6.1 and later AIX releases do. Use JFS if you need to disable logging.
|
Disk I/O pacing
Disk-I/O pacing is intended to prevent programs with heavy I/O demands from saturing system I/O resources, and causing other programs with less I/O demand to hang for a long time. When a process tries to write to a file that already has high-water mark pending writes, the process is put to sleep until enough I/Os have completed to make the number of pending writes less than or equal to the low-water mark. This mechanism is somewhat similar to processor scheduling. Batch jobs that have consumed lots of resources tend to have lower priority, which ensures that the interactive jobs will run in time.
Disabling I/O pacing usually improves backup jobs and I/O throughput, while enabling I/O pacing ensures better response time for other kinds of jobs that have less I/O demand.
In AIX 5.3, I/O pacing is disabled by default. In AIX 6.1, the value is set to 8193 for the high-water mark and 4096 for the low-water mark, respectively. AIX 5.3 and later releases also support I/O pacing per file system via the mount command, for example:
mount -o minpout=4096 -o maxpout=8193 /filesystem
To make the option persistent across boot, use the chfs command shown in Example 4-60.
Example 4-60 Using chfs to set the I/O pacing option
#chfs -a options=minpout=4096,maxpout=8193 /iotest
File system defragmentation
You might create, extend, modify, or delete the LVs and files during daily maintenance. Also, the applications might do similar tasks. Due to the dynamic allocation nature of LVM and JFS/JFS2 file systems, logically contiguous LVs and files can be fragmented.
In such cases, file blocks might be scattered physically. If this happens, sequential access is no longer sequential and performance is likely to deteriorate. Random access tends to be affected too, because the seek distance could be longer and take more time. If the files are all in the memory and the cache hit ratio is high, the performance might be acceptable. However, if this is not the case, you are likely to experience performance problems.
Example 4-61 on page 175 shows how to determine the fragmentation using the fileplace command. This is an example with a severe fragmentation problem.
Example 4-61 Determine fragmentation using the fileplace command
#fileplace -pv m.txt
File: m.txt Size: 33554432 bytes Vol: /dev/hd3
Blk Size: 4096 Frag Size: 4096 Nfrags: 7920
Inode: 166 Mode: -rw-r--r-- Owner: root Group: system
Physical Addresses (mirror copy 1) Logical Extent
---------------------------------- ----------------
07351336-07351337 hdisk0 2 frags 8192 Bytes, 0.0% 00010760-00010761
07351339 hdisk0 1 frags 4096 Bytes, 0.0% 00010763
07351344 hdisk0 1 frags 4096 Bytes, 0.0% 00010768
…
06989234 hdisk0 1 frags 4096 Bytes, 0.0% 00074642
06989239 hdisk0 1 frags 4096 Bytes, 0.0% 00074647
06989243 hdisk0 1 frags 4096 Bytes, 0.0% 00074651
06989278 hdisk0 1 frags 4096 Bytes, 0.0% 00074686
06989306 hdisk0 1 frags 4096 Bytes, 0.0% 00074714
06989310 hdisk0 1 frags 4096 Bytes, 0.0% 00074718
unallocated 272 frags 1114112 Bytes 0.0%
7920 frags over space of 64051 frags: space efficiency = 12.4%
7919 extents out of 7920 possible: sequentiality = 0.0%
A fast way to solve the problem is to back up the file, delete it, and then restore it as shown in Example 4-62.
Example 4-62 How to deal with file fragmentation
#cp m.txt m.txt.bak
#fileplace -pv m.txt.bak
File: m.txt.bak Size: 33554432 bytes Vol: /dev/hd3
Blk Size: 4096 Frag Size: 4096 Nfrags: 8192
Inode: 34 Mode: -rw-r--r-- Owner: root Group: system
Physical Addresses (mirror copy 1) Logical Extent
---------------------------------- ----------------
07218432-07226591 hdisk0 8160 frags 33423360 Bytes, 99.6% 00041696-00049855
07228224-07228255 hdisk0 32 frags 131072 Bytes, 0.4% 00051488-00051519
8192 frags over space of 9824 frags: space efficiency = 83.4%
2 extents out of 8192 possible: sequentiality = 100.0%
#cp m.txt.bak m.txt
Example 4-63 shows an example of how to defragment the file system.
Example 4-63 Defragmenting the file system
#defragfs -r /tmp
Total allocation groups : 64
Allocation groups skipped - entirely free : 52
Allocation groups skipped - too few free blocks : 3
Allocation groups that are candidates for defragmenting : 9
Average number of free runs in candidate allocation groups : 3
#defragfs /tmp
Defragmenting device /dev/hd3. Please wait.
Total allocation groups : 64
Allocation groups skipped - entirely free : 52
Allocation groups skipped - too few free blocks : 5
Allocation groups defragmented : 7
defragfs completed successfully.
#defragfs -r /tmp
Total allocation groups : 64
Allocation groups skipped - entirely free : 52
Allocation groups skipped - too few free blocks : 5
Allocation groups that are candidates for defragmenting : 7
Average number of free runs in candidate allocation groups : 4
4.4.4 The filemon utility
We now introduce the filemon utility.
Basic filemon utility
filemon is a tool based on the system trace facilities. You usually use filemon to find out the hotspot in the LVM and file system data layout. filemon can report the following major kinds of activities:
•Logical file system (lf)
•Virtual memory system (vm)
•Logical volumes (lv)
•Physical volumes (pv)
•All (short for lf, vm, lv, pv)
filemon runs in the background. Explicitly stop filemon at the end of data collection by executing trcstop. Example 4-64 shows the basic syntax of filemon. In the example, we start data collection for three seconds and then used trcstop. Also, we used the -T option to specify a larger trace buffer size (10 MB) than the default (64 KB per processor). The filemon report file is fmon.out.
Example 4-64 Basic filemon syntax
# filemon -T 10000000 -u -O lf,lv,pv,detailed -o fmon.out
# sleep 3
# trcstop
|
Note: Check for trace buffer wraparounds that may invalidate the filemon report. If you see “xxx events were lost”, run filemon with a smaller time interval or with a larger -T buffer value.
A larger trace buffer size results in pinned physical memory; refer to “Trace tools and PerfPMR” on page 316.
|
The filemon report contains two major parts, as follows. The report is generated using the command in Example 4-64.
Most active files, LVs, and PVs report
As shown in Example 4-65, this can be used to identify hotspots in the data layout.
Example 4-65 Most active LVs and PVs in filemon output
...
Most Active Logical Volumes
------------------------------------------------------------------------
util #rblk #wblk KB/s volume description
------------------------------------------------------------------------
1.00 181360 181392 90076.0 /dev/fslv02 /ciotest512b
0.85 28768 31640 15000.1 /dev/fslv01 /diotest4k
0.00 0 256 63.6 /dev/fslv00 /iotest512b
...
Most Active Physical Volumes
------------------------------------------------------------------------
util #rblk #wblk KB/s volume description
------------------------------------------------------------------------
1.00 181360 181640 90137.6 /dev/hdisk1 MPIO FC 2145
0.80 28768 31640 15000.1 /dev/hdisk2 MPIO FC 2145
...
Detailed statistics data
After you pinpoint the hotspot files or LVs or PVs from the most active reports, you can get the detailed statistics of these files or LVs or PVs in the “detailed stats” section as shown in Example 4-66.
The number of reads, writes, and seeks in the monitoring interval is displayed. You can also see the average I/O size at LV and PV layers in 512-byte blocks, and the min/avg/max response time in milliseconds.
Example 4-66 Detailed statistics section in the filemon output
...
------------------------------------------------------------------------
Detailed Logical Volume Stats (512 byte blocks)
------------------------------------------------------------------------
VOLUME: /dev/fslv02 description: /ciotest512
reads: 22670 (0 errs)
read sizes (blks): avg 8.0 min 8 max 8 sdev 0.0
read times (msec): avg 0.145 min 0.083 max 7.896 sdev 0.145
read sequences: 22670
read seq. lengths: avg 8.0 min 8 max 8 sdev 0.0
writes: 22674 (0 errs)
write sizes (blks): avg 8.0 min 8 max 8 sdev 0.0
write times (msec): avg 0.253 min 0.158 max 59.161 sdev 0.717
write sequences: 22674
write seq. lengths: avg 8.0 min 8 max 8 sdev 0.0
seeks: 45343 (100.0%) <=indicates random I/O
seek dist (blks): init 431352,
avg 697588.3 min 16 max 2083536 sdev 493801.4
time to next req(msec): avg 0.044 min 0.014 max 16.567 sdev 0.085
throughput: 90076.0 KB/sec
utilization: 1.00
...
Hot file detection enhancement
An enhancement to the filemon command was introduced in AIX 7.1, AIX 6.1 TL4, and AIX 5.3 TL11. A more detailed hot files, LVs, and PVs report is provided when using -O hot with the filemon command.
When -O hot is specified, the hotness of files, LVs, and PVs is sorted from diverse perspectives, including capacity accessed (CAP_ACC), number of I/O operations per unit of data accessed (IOP/#), total number of read operations (#ROP), total number of write operations (#WOP), time taken per read operation (RTIME), and time taken per write operation (WTIME). The aim of the report is to guide the administrator in determining which files, LVs, and PVs are the ideal candidates for migration to SSDs.
filemon -O hot is only supported in offline mode. Example 4-67 shows the syntax of using filemon for the hot file report. The “fmon.out” hotness report is similar to basic filemon output, but has more content.
Example 4-67 Generating a hot file report in offline mode
#filemon -o fmon.out -O hot -r myfmon -A -x "sleep 2"
The filemon command store the trace data in “myfmon.trc” and store the symbol information in “myfmon.syms”, as specified in the -r option. You can re-generate the hot file report from the trace data file and symbol file whenever you want, as follows:
#filemon -o fmon1.out -r myfmon -O hot
For more details about hot file detection, refer to AIX 7.1 Difference Guide, SG24-7910.
4.4.5 Scenario with SAP and DB2
Taking into practice the I/O device and file system tuning options discussed in this chapter, this section focuses on configuring storage for a DB2 database with SAP. This involves using a standard set of file systems and configuring them to deliver optimal performance.
The physical storage we were using was virtualized by an IBM SAN Volume Controller (SVC), making this scenario focused on a situation where the external storage is already striped, and how to configure AIX LVM appropriately.
To provide some background on the storage in this case, an SVC is a storage virtualization appliance where block storage can be presented to an SVC, and the SVC optimizes the external storage and manages the allocation to hosts.
The SVC has a concept of a managed disk group, which is LUNs from an external storage system from the same class of disks grouped together, forming a managed disk group.The SVC stripes the data across all of the mdisks in the managed disk group.
In our scenario, we have a managed disk group for our DB2 database and SAP binaries, and a managed disk group for SAP logs.
Figure 4-15 on page 179 provides a diagram of the environment used in this scenario.
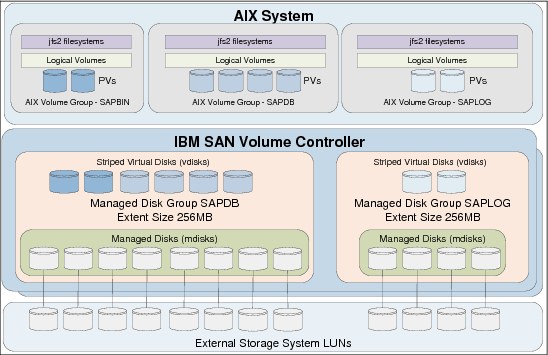
Figure 4-15 Storage overview
Table 4-16 provides a summary of the JFS2 file systems that are required for our SAP instance, their associated logical volumes, volume group, and mount options.
Table 4-16 File system summary for instance SID
|
Logical volume
|
Volume group
|
JFS2 file system
|
Mount options
|
|
usrsap_lv
|
sapbin_vg
|
/usr/sap
|
|
|
sapmnt_lv
|
sapbin_vg
|
/sapmnt
|
|
|
db2_lv
|
sapbin_vg
|
/db2
|
noatime
|
|
db2dump_lv
|
sapbin_vg
|
/db2/SID/db2dump
|
|
|
logarch_lv
|
saplog_vg
|
/db2/SID/log_archive
|
rbrw
|
|
logret_lv
|
saplog_vg
|
/db2/SID/log_retrieve
|
|
|
logdir_lv
|
saplog_vg
|
/db2/SID/log_dir
|
cio,noatime
|
|
db2sid_lv
|
sapdb_vg
|
/db2/SID/db2sid
|
|
|
saptemp_lv
|
sapdb_vg
|
/db2/SID/saptemp1
|
cio,noatime
|
|
sapdata1_lv
|
sapdb_vg
|
/db2/SID/sapdata1
|
cio,noatime
|
|
sapdata2_lv
|
sapdb_vg
|
/db2/SID/sapdata2
|
cio,noatime
|
|
sapdata3_lv
|
sapdb_vg
|
/db2/SID/sapdata3
|
cio,noatime
|
|
sapdata4_lv
|
sapdb_vg
|
/db2/SID/sapdata4
|
cio,noatime
|
As discussed in 4.3.5, “Adapter tuning” on page 150, the first step performed in this example is to apply the required settings to our fiber channel devices to deliver the maximum throughput on our AIX system based on our workload (Example 4-68 on page 180).
Example 4-68 Set FC adapter attributes
root@aix1:/ # chdev -l fcs0 -a num_cmd_elems=2048 -a max_xfer_size=0x200000 -P
fcs0 changed
root@aix1:/ # chdev -l fcs1 -a num_cmd_elems=2048 -a max_xfer_size=0x200000 -P
fcs1 changed
root@aix1:/ # chdev -l fscsi0 -a fc_err_recov=fast_fail -a dyntrk=yes -P
fscsi0 changed
root@aix1:/ # chdev -l fscsi1 -a fc_err_recov=fast_fail -a dyntrk=yes -P
fscsi1 changed
root@aix1:/ # shutdown -Fr
..... AIX system will reboot .....
Since we were using storage front-ended by SVC, we needed to ensure that we had the SDDPCM driver installed. Example 4-69 shows that the latest driver at the time of writing is installed, and we have nine disks assigned to our system. We have hdisk0, which is the rootvg presented via virtual SCSI, and the remaining eight disks are presented directly from SVC to our LPAR using NPIV.
Example 4-69 Confirming that the required drivers are installed
root@aix1:/ # lslpp -l devices.sddpcm*
Fileset Level State Description
----------------------------------------------------------------------------
Path: /usr/lib/objrepos
devices.sddpcm.71.rte 2.6.3.2 COMMITTED IBM SDD PCM for AIX V71
Path: /etc/objrepos
devices.sddpcm.71.rte 2.6.3.2 COMMITTED IBM SDD PCM for AIX V71
root@aix1:/ # lsdev -Cc disk
hdisk0 Available Virtual SCSI Disk Drive
hdisk1 Available 02-T1-01 MPIO FC 2145
hdisk2 Available 02-T1-01 MPIO FC 2145
hdisk3 Available 02-T1-01 MPIO FC 2145
hdisk4 Available 02-T1-01 MPIO FC 2145
hdisk5 Available 02-T1-01 MPIO FC 2145
hdisk6 Available 02-T1-01 MPIO FC 2145
hdisk7 Available 02-T1-01 MPIO FC 2145
hdisk8 Available 02-T1-01 MPIO FC 2145
root@aix1:/ #
4.3.2, “Disk device tuning” on page 143 explains what attributes should be considered for an hdisk device. Based on what we knew about our environment from testing in other parts of the book, we understood that our storage had the capability to easily handle a queue_depth of 64 and a max_transfer size of 1 MB, which is 0x100000.
The device driver we were using was SDDPCM for IBM storage, the recommended algorithm was load_balance, so we set this attribute on our hdisks. This is also the default.
Example 4-70 demonstrates how to set the attributes on our hdisk devices, which were new LUNs from our SVC and were not assigned to a volume group.
Example 4-70 Setting hdisk attributes on devices used for SAP file systems
root@aix1:/ # for DISK in `lspv |egrep "None|none" |awk '{print $1}'`
> do
> chdev -l $DISK -a queue_depth=64 -a max_transfer=0x100000 -a algorithm=load_balance
> done
hdisk1 changed
hdisk2 changed
hdisk3 changed
hdisk4 changed
hdisk5 changed
hdisk6 changed
hdisk7 changed
hdisk8 changed
root@aix1:/ #
Example 4-71 demonstrates how to create our volume groups. In this case, we had three volume groups, one for SAP binaries, one for the database and one for the logs. We were using a PP size of 128 MB and creating a scalable type volume group.
Example 4-71 Volume group creation
root@aix1:/ # mkvg -S -y sapbin_vg -s 128 hdisk1 hdisk2
0516-1254 mkvg: Changing the PVID in the ODM.
0516-1254 mkvg: Changing the PVID in the ODM.
sapbin_vg
root@aix1:/ # mkvg -S -y sapdb_vg -s 128 hdisk3 hdisk4 hdisk5 hdisk6
0516-1254 mkvg: Changing the PVID in the ODM.
0516-1254 mkvg: Changing the PVID in the ODM.
0516-1254 mkvg: Changing the PVID in the ODM.
0516-1254 mkvg: Changing the PVID in the ODM.
sapdb_vg
root@aix1:/ # mkvg -S -y saplog_vg -s 128 hdisk7 hdisk8
0516-1254 mkvg: Changing the PVID in the ODM.
0516-1254 mkvg: Changing the PVID in the ODM.
saplog_vg
root@aix1:/ #
4.3.3, “Pbuf on AIX disk devices” on page 148 explains that each hdisk device in a volume group has a number of pbuf buffers associated with it. For the database and log volume groups that have most disk I/O activity, we increased the number of buffers from the default of 512 to 1024 buffers. A small amount of additional memory was required, while the status of the volume group’s blocked I/O count should be monitored with lvmo -av. This is shown in Example 4-72.
Example 4-72 Increasing the pv buffers on the busiest volume groups
root@aix1:/ # lvmo -v sapdb_vg -o pv_pbuf_count=1024
root@aix1:/ # lvmo -v saplog_vg -o pv_pbuf_count=1024
root@aix1:/ # lvmo -av sapdb_vg
vgname = sapdb_vg
pv_pbuf_count = 1024
total_vg_pbufs = 4096
max_vg_pbufs = 524288
pervg_blocked_io_count = 0
pv_min_pbuf = 512
max_vg_pbuf_count = 0
global_blocked_io_count = 1
root@aix1:/ # lvmo -av saplog_vg
vgname = saplog_vg
pv_pbuf_count = 512
total_vg_pbufs = 1024
max_vg_pbufs = 524288
pervg_blocked_io_count = 1
pv_min_pbuf = 512
max_vg_pbuf_count = 0
global_blocked_io_count = 1
root@aix1:/ #
When creating our logical volumes, we were using the 4.4.2, “LVM best practice” on page 159, and using the maximum range of physical volumes (-e x). This method of spreading the logical volumes over the four disks in the volume group has the following effect:
•128 MB (the PP size) will be written to the first disk.
•128 MB (the PP size) will be written to the second disk.
•128 MB (the PP size) will be written to the third disk.
•128 MB (the PP size) will be written to the fourth disk.
•Repeat.
To ensure that we did not have a situation where each of the disks in the volume group is busy one at a time, the order of disks specified on creation of the logical volume dictates the order of writes.
If you rotate the order of disks when each logical volume is created, you can balance the writes across all of the disks in the volume group.
Figure 4-16 demonstrates this concept for the four sapdata file systems, which are typically the most I/O intensive in an SAP system. Ensure that their write order is rotated.
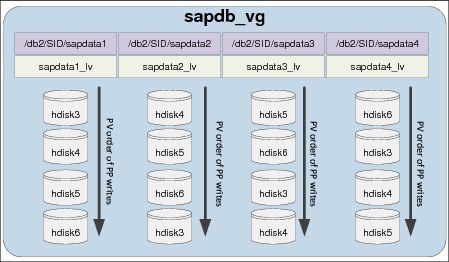
Figure 4-16 Rotating PV order per LV for sapdata file systems
Example 4-73 on page 183 shows our logical volume creation. The following options were set as part of the logical volume creation:
•The logical volume will be used for a file system type of JFS2 (-t jfs2).
•The logical volume has the range of physical volumes = maximum (-e x).
•The initial size of the file system is equal to the number of PVs in the VG.
•The order of hdisks that the logical volume is created on is rotated.
Example 4-73 Logical volume creation
root@aix1:/ # mklv -y usrsap_lv -t jfs2 -e x sapbin_vg 2 hdisk1 hdisk2
usrsap_lv
root@aix1:/ # mklv -y sapmnt_lv -t jfs2 -e x sapbin_vg 2 hdisk2 hdisk1
sapmnt_lv
root@aix1:/ # mklv -y db2_lv -t jfs2 -e x sapbin_vg 2 hdisk1 hdisk2
db2_lv
root@aix1:/ # mklv -y db2dump_lv -t jfs2 -e x sapbin_vg 2 hdisk2 hdisk1
db2dump_lv
root@aix1:/ # mklv -y logdir_lv -t jfs2 -e x saplog_vg 2 hdisk7 hdisk8
logdir_lv
root@aix1:/ # mklv -y logarch_lv -t jfs2 -e x saplog_vg 2 hdisk8 hdisk7
logarch_lv
root@aix1:/ # mklv -y logret_lv -t jfs2 -e x saplog_vg 2 hdisk7 hdisk8
logret_lv
root@aix1:/ # mklv -y sapdata1_lv -t jfs2 -e x sapdb_vg 4 hdisk3 hdisk4 hdisk5 hdisk6
sapdata1_lv
root@aix1:/ # mklv -y sapdata2_lv -t jfs2 -e x sapdb_vg 4 hdisk4 hdisk5 hdisk6 hdisk3
sapdata2_lv
root@aix1:/ # mklv -y sapdata3_lv -t jfs2 -e x sapdb_vg 4 hdisk5 hdisk6 hdisk3 hdisk4
sapdata3_lv
root@aix1:/ # mklv -y sapdata4_lv -t jfs2 -e x sapdb_vg 4 hdisk6 hdisk3 hdisk4 hdisk5
sapdata4_lv
root@aix1:/ # mklv -y db2sid_lv -t jfs2 -e x sapdb_vg 4 hdisk3 hdisk4 hdisk5 hdisk6
db2sid_lv
root@aix1:/ # mklv -y saptemp_lv -t jfs2 -e x sapdb_vg 4 hdisk4 hdisk5 hdisk6 hdisk3
saptemp_lv
root@aix1:/ #
4.4.3, “File system best practice” on page 163 explains the options available for JFS2 file systems. Example 4-74 shows our file system creation with the following options:
•The file systems are JFS2 (-v jfs2).
•The JFS2 log is inline rather than using a JFS2 log logical volume (-a logname=INLINE).
•The file systems will mount automatically on system reboot (-A yes).
•The file systems are enabled for JFS2 snapshots (-isnapshot=yes).
Example 4-74 File system creation
root@aix1:/ # crfs -v jfs2 -d usrsap_lv -m /usr/sap -a logname=INLINE -A yes -a -isnapshot=yes
File system created successfully.
259884 kilobytes total disk space.
New File System size is 524288
root@aix1:/ # crfs -v jfs2 -d sapmnt_lv -m /sapmnt -a logname=INLINE -A yes -a -isnapshot=yes
File system created successfully.
259884 kilobytes total disk space.
New File System size is 524288
root@aix1:/ # crfs -v jfs2 -d db2_lv -m /db2 -a logname=INLINE -A yes -a -isnapshot=yes
File system created successfully.
259884 kilobytes total disk space.
New File System size is 524288
root@aix1:/ # crfs -v jfs2 -d db2dump_lv -m /db2/SID/db2dump -a logname=INLINE -A yes -a -isnapshot=yes
File system created successfully.
259884 kilobytes total disk space.
New File System size is 524288
root@aix1:/ # crfs -v jfs2 -d logarch_lv -m /db2/SID/log_archive -a logname=INLINE -A yes -a -isnapshot=yes
File system created successfully.
259884 kilobytes total disk space.
New File System size is 524288
root@aix1:/ # crfs -v jfs2 -d logret_lv -m /db2/SID/log_retrieve -a logname=INLINE -A yes -a -isnapshot=yes
File system created successfully.
259884 kilobytes total disk space.
New File System size is 524288
root@aix1:/ # crfs -v jfs2 -d logdir_lv -m /db2/SID/log_dir -a logname=INLINE -A yes -a -isnapshot=yes -a options=cio,rw
File system created successfully.
259884 kilobytes total disk space.
New File System size is 524288
root@aix1:/ # crfs -v jfs2 -d db2sid_lv -m /db2/SID/db2sid -a logname=INLINE -A yes -a -isnapshot=yes
File system created successfully.
519972 kilobytes total disk space.
New File System size is 1048576
root@aix1:/ # crfs -v jfs2 -d saptemp_lv -m /db2/SID/saptemp1 -a logname=INLINE -A yes -a -isnapshot=yes -a options=cio,noatime,rw
File system created successfully.
519972 kilobytes total disk space.
New File System size is 1048576
root@aix1:/ # crfs -v jfs2 -d sapdata1_lv -m /db2/SID/sapdata1 -a logname=INLINE -A yes -a -isnapshot=yes -a options=cio,noatime,rw
File system created successfully.
519972 kilobytes total disk space.
New File System size is 1048576
root@aix1:/ # crfs -v jfs2 -d sapdata2_lv -m /db2/SID/sapdata2 -a logname=INLINE -A yes -a -isnapshot=yes -a options=cio,noatime,rw
File system created successfully.
519972 kilobytes total disk space.
New File System size is 1048576
root@aix1:/ # crfs -v jfs2 -d sapdata3_lv -m /db2/SID/sapdata3 -a logname=INLINE -A yes -a -isnapshot=yes -a options=cio,noatime,rw
File system created successfully.
519972 kilobytes total disk space.
New File System size is 1048576
root@aix1:/ # crfs -v jfs2 -d sapdata4_lv -m /db2/SID/sapdata4 -a logname=INLINE -A yes -a -isnapshot=yes -a options=cio,noatime,rw
File system created successfully.
519972 kilobytes total disk space.
New File System size is 1048576
root@aix1:/ #
The next step was to set the size of our file systems and mount them. Due to the order of mounting, we needed to create some directories for file systems mounted on top of /db2. It is also important to note that the sizes used here were purely for demonstration purposes only, and the inline log expands automatically as the file systems are extended. This is shown in Example 4-75.
Example 4-75 File system sizing and mounting
root@aix1:/ # chfs -a size=16G /usr/sap ; mount /usr/sap
Filesystem size changed to 33554432
Inlinelog size changed to 64 MB.
root@aix1:/ # chfs -a size=8G /sapmnt ; mount /sapmnt
Filesystem size changed to 16777216
Inlinelog size changed to 32 MB.
root@aix1:/ # chfs -a size=16G /db2 ; mount /db2
Filesystem size changed to 33554432
Inlinelog size changed to 64 MB.
root@aix1:/ # mkdir /db2/SID
root@aix1:/ # mkdir /db2/SID/db2dump
root@aix1:/ # mkdir /db2/SID/log_archive
root@aix1:/ # mkdir /db2/SID/log_retrieve
root@aix1:/ # mkdir /db2/SID/log_dir
root@aix1:/ # mkdir /db2/SID/db2sid
root@aix1:/ # mkdir /db2/SID/saptemp1
root@aix1:/ # mkdir /db2/SID/sapdata1
root@aix1:/ # mkdir /db2/SID/sapdata2
root@aix1:/ # mkdir /db2/SID/sapdata3
root@aix1:/ # mkdir /db2/SID/sapdata4
root@aix1:/ # chfs -a size=4G /db2/SID/db2dump ; mount /db2/SID/db2dump
Filesystem size changed to 8388608
Inlinelog size changed to 16 MB.
root@aix1:/ # chfs -a size=32G /db2/SID/log_archive ; mount /db2/SID/log_archive
Filesystem size changed to 67108864
Inlinelog size changed to 128 MB.
root@aix1:/ # chfs -a size=32G /db2/SID/log_retrieve ; mount /db2/SID/log_retrieve
Filesystem size changed to 67108864
Inlinelog size changed to 128 MB.
root@aix1:/ # chfs -a size=48G /db2/SID/log_dir ; mount /db2/SID/log_dir
Filesystem size changed to 100663296
Inlinelog size changed to 192 MB.
root@aix1:/ # chfs -a size=16G /db2/SID/db2sid ; mount /db2/SID/db2sid
Filesystem size changed to 33554432
Inlinelog size changed to 64 MB.
root@aix1:/ # chfs -a size=8G /db2/SID/saptemp1 ; mount /db2/SID/saptemp1
Filesystem size changed to 16777216
Inlinelog size changed to 32 MB.
root@aix1:/ # chfs -a size=60G /db2/SID/sapdata1 ; mount /db2/SID/sapdata1
Filesystem size changed to 125829120
Inlinelog size changed to 240 MB.
root@aix1:/ # chfs -a size=60G /db2/SID/sapdata2 ; mount /db2/SID/sapdata2
Filesystem size changed to 125829120
Inlinelog size changed to 240 MB.
root@aix1:/ # chfs -a size=60G /db2/SID/sapdata3 ; mount /db2/SID/sapdata3
Filesystem size changed to 125829120
Inlinelog size changed to 240 MB.
root@aix1:/ # chfs -a size=60G /db2/SID/sapdata4 ; mount /db2/SID/sapdata4
Filesystem size changed to 125829120
Inlinelog size changed to 240 MB.
root@aix1:/ #
To ensure that the file systems are mounted with the correct mount options, run the mount command. This is shown in Example 4-76.
Example 4-76 Verify that file systems are mounted correctly
root@aix1:/ # mount
node mounted mounted over vfs date options
-------- --------------- --------------- ------ ------------ ---------------
/dev/hd4 / jfs2 Oct 08 12:43 rw,log=/dev/hd8
/dev/hd2 /usr jfs2 Oct 08 12:43 rw,log=/dev/hd8
/dev/hd9var /var jfs2 Oct 08 12:43 rw,log=/dev/hd8
/dev/hd3 /tmp jfs2 Oct 08 12:43 rw,log=/dev/hd8
/dev/hd1 /home jfs2 Oct 08 12:43 rw,log=/dev/hd8
/dev/hd11admin /admin jfs2 Oct 08 12:43 rw,log=/dev/hd8
/proc /proc procfs Oct 08 12:43 rw
/dev/hd10opt /opt jfs2 Oct 08 12:43 rw,log=/dev/hd8
/dev/livedump /var/adm/ras/livedump jfs2 Oct 08 12:43 rw,log=/dev/hd8
/dev/usrsap_lv /usr/sap jfs2 Oct 10 14:59 rw,log=INLINE
/dev/sapmnt_lv /sapmnt jfs2 Oct 10 14:59 rw,log=INLINE
/dev/db2_lv /db2 jfs2 Oct 10 15:00 rw,log=INLINE
/dev/db2dump_lv /db2/SID/db2dump jfs2 Oct 10 15:00 rw,log=INLINE
/dev/logarch_lv /db2/SID/log_archive jfs2 Oct 10 15:01 rw,log=INLINE
/dev/logret_lv /db2/SID/log_retrieve jfs2 Oct 10 15:01 rw,log=INLINE
/dev/logdir_lv /db2/SID/log_dir jfs2 Oct 10 15:02 rw,cio,noatime,log=INLINE
/dev/db2sid_lv /db2/SID/db2sid jfs2 Oct 10 15:03 rw,log=INLINE
/dev/saptemp_lv /db2/SID/saptemp1 jfs2 Oct 10 15:03 rw,cio,noatime,log=INLINE
/dev/sapdata1_lv /db2/SID/sapdata1 jfs2 Oct 10 15:03 rw,cio,noatime,log=INLINE
/dev/sapdata2_lv /db2/SID/sapdata2 jfs2 Oct 10 15:03 rw,cio,noatime,log=INLINE
/dev/sapdata3_lv /db2/SID/sapdata3 jfs2 Oct 10 15:03 rw,cio,noatime,log=INLINE
/dev/sapdata4_lv /db2/SID/sapdata4 jfs2 Oct 10 15:03 rw,cio,noatime,log=INLINE
root@aix1:/ #
|
Note: It is important to consult your storage administrator and SAP basis administrator during the configuration of storage for a new SAP system. This section simply demonstrates the concepts discussed in this chapter.
|
4.5 Network
When configuring an AIX system’s networking devices, there are a number of performance options to consider in the AIX operating system to improve network performance.
This section focuses on these settings in the AIX operating system and the potential gains from tuning them. 3.7, “Optimal Shared Ethernet Adapter configuration” on page 82 provides details on PowerVM shared Ethernet tuning.
|
Important: Ensure that your LAN switch is configured appropriately to match how AIX is configured. Consult your network administrator to ensure that both AIX and the LAN switch configuration match.
|
4.5.1 Network tuning on 10 G-E
10-Gigabit Ethernet adapters provide a higher bandwidth and lower latency than 1-Gigabit Ethernet adapters. However, it is important to understand that additional processor resources are required for 10-Gigabit Ethernet, and there are some tuning steps that can be taken to get good throughput from the adapter.
For optimum performance ensure adapter placement according to Adapter Placement Guide and size partitions, and optionally VIOS, to fit the expected workload. From the 5803 Adapter Placement Guide:
•No more than one 10 Gigabit Ethernet adapter per I/O chip.
•No more than one 10 Gigabit Ethernet port per two processors in a system.
•If one 10 Gigabit Ethernet port is present per two processors in a system, no other 10 Gb or 1 Gb ports should be used.
|
Note: Refer to Adapter Placement Guides for further guidance, such as:
•IBM Power 780 Adapter Placement Guide:
•IBM Power 795 Adapter Placement:
|
To ensure that the connected network switch is not overloaded by one or more 10 Gbit ports, verify that the switch ports have flow control enabled (which is the default for the adapter device driver).
If the 10 Gbit adapter is dedicated to a partition, enable Large Send offload (LS) and Large Receive Offload (LRO) for the adapter device driver. The LS will also have to be enabled on the network interface device level (enX) using the mtu_bypass attribute or by manually enabling every time after IPL (boot).
For streaming larger data packets over the physical network, consider enabling Jumbo Frames. However, it requires both endpoint and network switch support to work and will not have any throughput improvement for packets that can fit in a default MTU size of 1500 bytes.
The entstat command physical adapter (port) statistic No Resource Errors are the number of incoming packets dropped by the hardware due to lack of resources. This usually occurs because the receive buffers on the adapter were exhausted; to mitigate, increase the adapter size of the receive buffers, for example by adjusting “receive descriptor queue size” (rxdesc_que_sz) and “receive buffer pool size” (rxbuf_pool_sz), which, however, require deactivating and activating the adapter.
Consider doubling rxdesc_que_sz and set rxbuf_pool_sz to two (2) times the value of rxdesc_que_sz, with the chdev command, for example:
chdev -Pl ent# -a rxdesc_que_sz=4096 -a rxbuf_pool_sz=8192
Refer to:
http://pic.dhe.ibm.com/infocenter/aix/v7r1/topic/com.ibm.aix.prftungd/doc/prftungd/adapter_stats.htm
The entstat command physical 10 Gbit Ethernet adapter (port) statistic Lifetime Number of Transmit Packets/Bytes Overflowed occurs in the case that the adapter has a full transmit queue and the system is still sending data; the packets chain will be put to an overflow queue.
This overflow queue will be sent when the transmit queue has free entries again. This behaviour is reflected in the statistics above and these values do not indicate packet loss.
Frequently occurring overflows indicate that the adapter does not have enough resources allocated for transmit to handle the traffic load. In such a situation, it is suggested that the number of transmit elements be increased (transmit_q_elem), for example:
chdev -Pl ent# -a transmit_q_elem=2048
Etherchannel link aggregation spreads of outgoing packets are governed by the hash_mode attribute of the Etherchannel device, and how effective this algorithm is for the actual workload can be monitored by the entstat command or netstat -v.
In the following example, the 8023ad link aggregation Etherchannel consists of four adapter ports with the hash_mode load balancing option set to default, in which the adapter selection algorithm uses the last byte of the destination IP address (for TCP/IP traffic) or MAC address (for ARP and other non-IP traffic).
The lsattr command:
adapter_names ent0,ent1,ent4,ent6 EtherChannel Adapters
hash_mode default Determines how outgoing adapter is chosen
mode 8023ad EtherChannel mode of operation
Using the entstat command to display the statistics for ent0, ent1, ent4 and ent6, reveals that the current network workload is not spreading the outgoing traffic balanced over the adapters in the Etherchannel, as can be seen in Table 4-17. The majority of the outgoing traffic is over ent6, followed by ent4, but ent0 and ent1 have almost no outgoing traffic.
Changing the hash_mode from default to src_dst_port might improve the balance in this case, since the outgoing adapter is selected by an algorithm using the combined source and destination TCP or UDP port values.
Table 4-17 using entstat command to monitor Etherchannel hash_mode spread of outgoing traffic
|
Device
|
Transmit packets
|
% of total
|
Receive packets
|
% of total
|
|
ent0
|
811028335
|
3%
|
1239805118
|
12%
|
|
ent1
|
1127872165
|
4%
|
2184361773
|
21%
|
|
ent4
|
8604105240
|
28%
|
2203568387
|
21%
|
|
ent6
|
19992956659
|
65%
|
4671940746
|
45%
|
|
Total
|
30535962399
|
100%
|
10299676024
|
100%
|
|
Note: The receive traffic is dependent on load balancing and speading from the network and sending node, and the switch tables of MAC and IP addresses.
|
Refer to:
Table 4-18 provides details and some guidance relating to some of the attributes that can be tuned on the adapter to improve performance.
Table 4-18 10 gigabit adapter settings
|
Attribute
|
Description
|
Suggested Value
|
|
chksum_offload
|
This enables the adapter to compute the checksum on transmit and receive saving processor utilization in AIX because AIX does not have to compute the checksum. This is enabled by default in AIX.
|
Enabled
|
|
flow_ctrl
|
This specifies whether the adapter should enable transmit and receive flow control. This should be enabled in AIX and on the network switch. This is enabled in AIX by default.
|
Enabled
|
|
jumbo_frames
|
This setting indicates that frames up to 9018 bytes can be transmitted with the adapter. In networks where jumbo frames are supported and enabled on the network switches, this should be enabled in AIX.
|
Enabled
|
|
large_receive
|
This enables AIX to coalesce receive packets into larger packets before passing them up the TCP stack.
|
Enabled
|
|
large_send
|
This option enables AIX to build a TCP message up to 64 KB long and send it in one call to the Ethernet device driver.
|
Enabled
|
Table 4-19 provides details and some guidance on the attributes that can be tuned on the interface to improve performance.
Table 4-19 Interface attributes
|
Attribute
|
Description
|
Suggested Value
|
|
mtu
|
The Media Transmission Unit (MTU) size is the maximum size of a frame that can be transmitted by the adapter.
|
9000 if using jumbo frames
|
|
mtu_bypass
|
This allows the interface to have largesend enabled.
|
On
|
|
rfc1323
|
This enables TCP window scaling. Enabling this may improve TCP streaming performance.
|
Set by “no” tunable to 1
|
|
tcp_recvspace
|
This parameter controls how much buffer space can be consumed by receive buffers, and to inform the sender how big its transmit window size can be.
|
16 k default, 64 k optional
|
|
tcp_sendspace
|
This attribute controls how much buffer space will be used to buffer the data that is transmitted by the adapter.
|
16 k default, 64 k optional
|
|
thread
|
Known as the dog threads feature, the driver will queue incoming packets to the thread.
|
On
|
4.5.2 Interrupt coalescing
Interrupt coalescing is introduced to avoid flooding the host with too many interrupts. Consider a typical situation for a 1-Gbps Ethernet: if the average package size is 1000 bytes, to achieve the full receiving bandwidth, there will be 1250 packets in each processor tick (10 ms). Thus, if there is no interrupt coalescing, there will be 1250 interrupts in each processor tick, wasting processor time with all the interrupts.
Interrupt coalescing is aimed at reducing the interrupt overhead with minimum latency. There are two typical types of interrupt coalescing in AIX network adapters.
Most 1-Gbps Ethernet adapters, except the HEA adapter, use the interrupt throttling rate method, which generates interrupts at fixed frequencies, allowing the bunching of packets based on time. Such adapters include FC5701, FC5717, FC5767, and so on. The default interrupt rate is controlled by the intr_rate parameter, which is 10000 times per second. The intr_rate can be changed by the following command:
#chdev -l entX -a intr_rate=<value>
Before you change the value of intr_rate, you might want to check the range of possible values for it (Example 4-77).
Example 4-77 Value range of intr_rate
#lsattr -Rl entX -a intr_rate
0...65535 (+1)
For lower interrupt overhead and less processor consumption, you can set the interrupt rate to a lower value. For faster response time, you can set the interrupt rate to a larger value, or even disable it by setting the value to 0.
Most 10-Gb Ethernet adapters and HEA adapters use a more advanced interrupt coalescing feature. A timer starts when the first packet arrives, and then the interrupt is delayed for n microseconds or until m packets arrive.
Refer to Example 4-78 for the HEA adapter where the n value corresponds to rx_clsc_usec, which equals 95 microseconds by default. The m value corresponds to rx_coalesce, which equals 16 packets. You can change the n and m values, or disable the interrupt coalescing by setting rx_clsc=none.
Example 4-78 HEA attributes for interrupt coalescing
lsattr -El ent0
alt_addr 0x000000000000 Alternate Ethernet address True
flow_ctrl no Request Transmit and Receive Flow Control True
jumbo_frames no Request Transmit and Receive Jumbo Frames True
large_receive yes Enable receive TCP segment aggregation True
large_send yes Enable hardware Transmit TCP segmentation True
media_speed Auto_Negotiation Requested media speed True
multicore yes Enable Multi-Core Scaling True
rx_cksum yes Enable hardware Receive checksum True
rx_cksum_errd yes Discard RX packets with checksum errors True
rx_clsc 1G Enable Receive interrupt coalescing True
rx_clsc_usec 95 Receive interrupt coalescing window True
rx_coalesce 16 Receive packet coalescing True
rx_q1_num 8192 Number of Receive queue 1 WQEs True
rx_q2_num 4096 Number of Receive queue 2 WQEs True
rx_q3_num 2048 Number of Receive queue 3 WQEs True
tx_cksum yes Enable hardware Transmit checksum True
tx_isb yes Use Transmit Interface Specific Buffers True
tx_q_num 512 Number of Transmit WQEs True
tx_que_sz 8192 Software transmit queue size True
use_alt_addr no Enable alternate Ethernet address True
Refer to Example 4-79 for the 10-Gb Ethernet adapter where the n value corresponds to intr_coalesce, which is 5 microseconds by default. The m value corresponds to receive_chain, which is 16 packets by default. Note the attribute name for earlier adapters might be different.
Example 4-79 10-Gb Ethernet adapter attributes for interrupt coalescing
# lsattr -El ent1
alt_addr 0x000000000000 Alternate ethernet address True
chksum_offload yes Enable transmit and receive checksum True
delay_open no Enable delay of open until link state is known True
flow_ctrl yes Enable transmit and receive flow control True
intr_coalesce 5 Receive interrupt delay in microseconds True
jumbo_frames no Transmit/receive jumbo frames True
large_receive yes Enable receive TCP segment aggregation True
large_send yes Enable transmit TCP segmentation offload True
rdma_enabled no Enable RDMA support True
receive_chain 16 Receive packet coalesce(chain) count True
receive_q_elem 2048 Number of elements per receive queue True
transmit_chain 8 Transmit packet coalesce(chain) count True
transmit_q_elem 1024 Number of elements per transmit queue True
tx_timeout yes N/A True
use_alt_addr no Enable alternate ethernet address True
You can see the effect of turning off interrupt coalescing in 4.5.5, “Network latency scenario” on page 196.
Note that interrupt coalescing only applies to network receiving interrupts. TCP/IP implementation in AIX eliminates the need for network transmit interrupts. The transmit status is only checked at the next transmit. You can get this from the network statistics (netstat -v), the interrupt for transmit statistics is always 0.
4.5.3 10-G adapter throughput scenario
Using some of the tunables discussed in 4.5.1, “Network tuning on 10 G-E” on page 186, we performed some throughput tests between two AIX systems with a dedicated 10-G Ethernet adapter assigned to each system, with a single network switch in between the two LPARs, each one in different POWER 750 frames.
A baseline test, and three subsequent tests with different values applied, were performed. These tests were aimed at maximizing the throughput between two AIX systems.
The baseline test was run with a throughput of 370 MBps.
The first set of changes was to modify the rfc1323, tcp_sendspace and tcp_recvspace options and to perform another test. Example 4-80 demonstrates how the tunables were changed on each of the AIX systems.
Example 4-80 Configuration changes for test 1
root@aix1:/ # no -p -o rfc1323=1
Setting rfc1323 to 1
Setting rfc1323 to 1 in nextboot file
Change to tunable rfc1323, will only be effective for future connections
root@aix1:/ # no -p -o tcp_sendspace=1048576
Setting tcp_sendspace to 1048576
Setting tcp_sendspace to 1048576 in nextboot file
Change to tunable tcp_sendspace, will only be effective for future connections
root@aix1:/ # no -p -o tcp_recvspace=1048576
Setting tcp_recvspace to 1048576
Setting tcp_recvspace to 1048576 in nextboot file
Change to tunable tcp_recvspace, will only be effective for future connections
root@aix2:/ # no -p -o rfc1323=1
Setting rfc1323 to 1
Setting rfc1323 to 1 in nextboot file
Change to tunable rfc1323, will only be effective for future connections
root@aix2:/ # no -p -o tcp_sendspace=1048576
Setting tcp_sendspace to 1048576
Setting tcp_sendspace to 1048576 in nextboot file
Change to tunable tcp_sendspace, will only be effective for future connections
root@aix2:/ # no -p -o tcp_recvspace=1048576
Setting tcp_recvspace to 1048576
Setting tcp_recvspace to 1048576 in nextboot file
Change to tunable tcp_recvspace, will only be effective for future connection
The result of the changes was a throughput of 450 MBps in Test 1.
The next test consisted of enabling jumbo frames in AIX, and ensuring that our switch was capable of jumbo frames, and had jumbo frame support enabled. Example 4-81 demonstrates how the changes were made. It is important to note that the interface had to be detached and attached for the change to be applied, so we ran the commands on the HMC from a console window to each LPAR.
Example 4-81 Configuration changes for Test 2
root@aix1:/ # chdev -l en0 -a state=detach
en0 changed
root@aix1:/ # chdev -l ent0 -a jumbo_frames=yes
ent0 changed
root@aix1:/ # chdev -l en0 -a state=up
en0 changed
root@aix2:/ # chdev -l en0 -a state=detach
en0 changed
root@aix2:/ # chdev -l ent0 -a jumbo_frames=yes
ent0 changed
root@aix2:/ # chdev -l en0 -a state=up
en0 changed
The result of the changes was a throughput of 965 MBps in Test 2.
The final test consisted of turning on the mtu_bypass and thread attributes. Example 4-82 shows how these attributes where set on each of the AIX systems.
Example 4-82 Configuration changes for test 3
root@aix1:/ # chdev -l en0 -a mtu_bypass=on
en0 changed
root@aix1:/ # chdev -l en0 -a thread=on
en0 changed
root@aix2:/ # chdev -l en0 -a mtu_bypass=on
en0 changed
root@aix2:/ # chdev -l en0 -a thread=on
en0 changed
The result of the changes in the final test throughput was 1020 MBps.
Table 4-20 provides a summary of the test results, and the processor consumption. The more packets and bandwidth were handled by the 10-G adapter, the more processing power was required.
Table 4-20 Throughput results summary
|
Test
|
Throughput
|
Processor usage
|
|
Baseline
|
370 MBps
|
1.8 POWER7 Processors
|
|
Test 1
|
450 MBps
|
2.1 POWER7 Processors
|
|
Test 2
|
965 MBps
|
1.6 POWER7 Processors
|
|
Test 3
|
1020 MBps
|
1.87 POWER7 Processors
|
4.5.4 Link aggregation
In the case where multiple adapters are allocated to an AIX LPAR, a link aggregation (also referred to as an EtherChannel device) should be configured to make best use of the two adapters. The link aggregation can provide redundancy if one adapter fails, and the combined throughput of the adapters can be made available as a single entity. There are also cases where due to a large number of packets per second, the latency increases. Having multiple adapters can counteract this problem.
When configuring any link aggregation configuration, it is important that the network infrastructure supports the configuration, and is configured appropriately. Unlike in the NIB mode, all the link aggregation ports should be on the same switch.
Table 4-21 provides a description of some of the attributes to consider, and some guidance on suggested values.
Table 4-21 Link aggregation attributes
|
Attribute
|
Description
|
Suggested value
|
|
mode
|
This attribute dictates the type of port channel that is configured. The mode 8023ad is available, which enables the adapter’s EtherChannel to negotiate with a Link Aggregation Control Protocol (LCAP) enabled switch.
|
8023ad
|
|
hash_mode
|
If the EtherChannel is configured using standard or 8023ad mode, the hash_mode attribute determines how the outbound adapter for each packet is chosen. In src_dst_port both the source and destination TCP or UDP ports are used to determine the outgoing adapter.
|
src_dst_port
|
|
use_jumbo_frame
|
Setting this attribute to yes enables EtherChannel to use jumbo frames. This allows the Ethernet MTU to increase to 9000 bytes per frame instead of the default 1500 bytes.
|
yes
|
Example 4-83 on page 194 demonstrates how to configure a link aggregation of ports ent0 and ent1 with the attributes suggested in Table 4-21. This can also be performed using smitty addethch1.
Example 4-83 Configuring the EtherChannel device
root@aix1:/ # mkdev -c adapter -s pseudo -t ibm_ech -a adapter_names=ent0,ent1 -a mode=8023ad -a hash_mode=src_dst_port -a use_jumbo_frame=yes
ent2 Available
When 8023.ad link aggregation is configured, you can use entstat -d <etherchannel_adapter> to check the negotiation status of the EtherChannel, as shown in Example 4-84.
The aggregation status of the EtherChannel adapter should be Aggregated. And all the related ports, including AIX side port (Actor) and switch port (Partner), should be in IN_SYNC status. All other values, such as Negotiating or OUT_OF_SYNC, means that link aggregation is not successfully established.
Example 4-84 Check the link aggregation status using entstat
#entstat -d ent2
-------------------------------------------------------------
ETHERNET STATISTICS (ent2) :
Device Type: IEEE 802.3ad Link Aggregation
Hardware Address: 00:14:5e:99:52:c0
...
=============================================================
Statistics for every adapter in the IEEE 802.3ad Link Aggregation:
------------------------------------------------------------------
Number of adapters: 2
Operating mode: Standard mode (IEEE 802.3ad)
IEEE 802.3ad Link Aggregation Statistics:
Aggregation status: Aggregated
LACPDU Interval: Long Received LACPDUs: 94
Transmitted LACPDUs: 121
Received marker PDUs: 0
Transmitted marker PDUs: 0
Received marker response PDUs: 0
Transmitted marker response PDUs: 0
Received unknown PDUs: 0
Received illegal PDUs: 0
Hash mode: Source and destination TCP/UDP ports
-------------------------------------------------------------
...
ETHERNET STATISTICS (ent0) :
...
IEEE 802.3ad Port Statistics:
-----------------------------
Actor System Priority: 0x8000
Actor System: 00-14-5E-99-52-C0
Actor Operational Key: 0xBEEF
Actor Port Priority: 0x0080
Actor Port: 0x0001
Actor State:
LACP activity: Active
LACP timeout: Long
Aggregation: Aggregatable
Synchronization: IN_SYNC
Collecting: Enabled
Distributing: Enabled
Defaulted: False
Expired: False
Partner System Priority: 0x007F
Partner System: 00-24-DC-8F-57-F0
Partner Operational Key: 0x0002
Partner Port Priority: 0x007F
Partner Port: 0x0003
Partner State:
LACP activity: Active
LACP timeout: Short
Aggregation: Aggregatable
Synchronization: IN_SYNC
Collecting: Enabled
Distributing: Enabled
Defaulted: False
Expired: False
Received LACPDUs: 47
Transmitted LACPDUs: 60
Received marker PDUs: 0
Transmitted marker PDUs: 0
Received marker response PDUs: 0
Transmitted marker response PDUs: 0
Received unknown PDUs: 0
Received illegal PDUs: 0
-------------------------------------------------------------
...
ETHERNET STATISTICS (ent1) :
...
IEEE 802.3ad Port Statistics:
-----------------------------
Actor System Priority: 0x8000
Actor System: 00-14-5E-99-52-C0
Actor Operational Key: 0xBEEF
Actor Port Priority: 0x0080
Actor Port: 0x0002
Actor State:
LACP activity: Active
LACP timeout: Long
Aggregation: Aggregatable
Synchronization: IN_SYNC
Collecting: Enabled
Distributing: Enabled
Defaulted: False
Expired: False
Partner System Priority: 0x007F
Partner System: 00-24-DC-8F-57-F0
Partner Operational Key: 0x0002
Partner Port Priority: 0x007F
Partner Port: 0x0004
Partner State:
LACP activity: Active
LACP timeout: Short
Aggregation: Aggregatable
Synchronization: IN_SYNC
Collecting: Enabled
Distributing: Enabled
Defaulted: False
Expired: False
Received LACPDUs: 47
Transmitted LACPDUs: 61
Received marker PDUs: 0
Transmitted marker PDUs: 0
Received marker response PDUs: 0
Transmitted marker response PDUs: 0
Received unknown PDUs: 0
Received illegal PDUs: 0
4.5.5 Network latency scenario
In cases where applications are sensitive to latency in the network, there can be significant performance issues if the network latency is high. 3.7.9, “Measuring latency” on page 90 provides some details on how network latency can be measured.
Figure 4-17 on page 197 provides an overview of a test environment we prepared to measure the latency between different devices, and virtualization layers.
We had two POWER 750 systems, each with a VIO server sharing Ethernet, and two LPARs on each system. Each LPAR has a dedicated Ethernet adapter to test the hardware isolated to an AIX LPAR.
These tests were performed with no load on the POWER 750 systems to establish a baseline of the expected latency per device.

Figure 4-17 Sample scenario our network latency test results were based on
Table 4-22 provides a summary of our test results. The objective of the test was to compare the latency between the following components:
•Latency between two 10 G adapters
•Latency between two 1G adapters
•Latency between two virtual adapters on the same machine
•Latency between two LPARs on different machines communicating via shared Ethernet adapters
Table 4-22 Network latency test results
|
Source
|
Destination
|
Latency in milliseconds
|
|
AIX1 via 10 G Physical Ethernet
|
AIX3 via 10 G Physical Ethernet
|
0.062 ms
|
|
AIX1 via 10 G Physical Ethernet
Interrupt Coalescing Disabled
|
AIX3 via 10 G Physical Ethernet
Interrupt Coalescing Disabled
|
0.052 ms
|
|
AIX2 via 1 G Physical Ethernet
|
AIX4 via 1 G Physical Ethernet
|
0.144 ms
|
|
AIX2 via 1 G Physical Ethernet
Interrupt Throttling Disabled
|
AIX4 via 1 G Physical Ethernet
Interrupt Throttling Disabled
|
0.053 ms
|
|
AIX1 via Hyp Virtual Ethernet
|
AIX2 via Hyp Virtual Ethernet
|
0.038 ms
|
|
AIX1 via Shared Ethernet
|
AIX3 via Shared Ethernet
|
0.274 ms
|
Conclusion
After the tests we found that the latency for 10 G Ethernet was significantly less than that of a 1 G adapter under the default setting, which was expected. What was also expected was that there is low latency across the hypervisor LAN, and some small latency added by using a shared Ethernet adapter rather than a dedicated adapter.
Also, some transaction type of workload might benefit from disabling interrupt coalescing, as the response time might be slightly improved. In our tests, you can see that in a 1-Gb Ethernet scenario, the latency is greatly improved after disabling interrupt coalescing. This was expected because the 1-Gb adapter waits 100 microseconds on average to generate an interrupt by default. However, change this value with caution, because it uses more processor time for faster response.
While this test was completed with no load on the network, AIX LPARs or VIO servers, it is important to recognize that as workload is added, latency may increase. The more packets that are being processed by the network, if there is a bottleneck, the more the latency will increase.
In the case that there are bottlenecks, there are some actions that might be considered:
•If the latency goes up, it is worthwhile measuring the latency between different components to try to identify a bottleneck.
•If there are a large number of LPARs accessing the same SEA, it may be worthwhile having multiple SEAs on different Vswitches and grouping a portion of the LPARs on one Vswitch/SEA and another portion of the LPARs on another Vswitch/SEA.
If there is a single LPAR producing the majority of the network traffic, it may be worthwhile to dedicate an adapter to that LPAR.
4.5.6 DNS and IPv4 settings
AIX name resolution by default tries to resolve both IPv4 and IPv6 addresses. The first attempt is to resolve the name locally and then request the DNS server. Some software that has IPv6 support, such as Oracle 11g, IBM Tivoli Directory Server, may suffer some delay. In the case of such software, even if hostname is resolved by IPv4, a second attempt takes place for IPv6 resolution. If the IPv6 resolution is unsuccessful by trying /etc/hosts, the request goes to the DNS server. If you use only IPv4 and your DNS server is not able to answer this request, your application waits until the DNS time-out occurs.
If you are not using IPv6, disable IPv6 lookups on AIX adding the following line to /etc/netsvc.conf:
hosts=local4,bind4
|
Note: If your NSORDER environment variable is set, it overrides the /etc/netsvc.conf file.
|
4.5.7 Performance impact due to DNS lookups
DNS lookups are often used by commercial applications as well as network daemons to resolve a given hostname to an IP address. Any delay in lookup due to a firewall, network congestion, or unreachable network can cause the host network to either retry the lookups or error out. This might impact some applications that are network sensitive. It is important that such delays are identified and addressed quickly to avoid any degradation in application performance.
Identify a lookup failure
In this section, we examine a DNS lookup response delay. The first DNS server is in close proximity to the requesting server, while the second DNS server is located at another geographical location (Example 4-85 and Example 4-86).
Example 4-85 DNS server lookup round trip time - Scenario 1: DNS lookup time 26 ms
# startsrc -s iptrace -a "-a -b -s 9.184.192.240 /tmp/iptrace_local_dns"
[4587574]
0513-059 The iptrace Subsystem has been started. Subsystem PID is 4587574.
# nslookup host.sample.com
Server: 9.184.192.240
Address: 9.184.192.240#53
Non-authoritative answer:
Name: host.sample.com
Address: 9.182.76.38
# stopsrc -s iptrace
0513-044 The iptrace Subsystem was requested to stop.
iptrace: unload success!

Example 4-86 DNS server lookup round trip time - Scenario 2: DNS lookup time 247 ms
# startsrc -s iptrace -a "-a -b -s 9.3.36.243 /tmp/iptrace_remote_dns"
[4587576]
0513-059 The iptrace Subsystem has been started. Subsystem PID is 4587576.
# nslookup remote_host.sample.com 9.3.36.243
Server: 9.3.36.243
Address: 9.3.36.243#53
Name: remote_host.sample.com
Address: 9.3.36.37
# stopsrc -s iptrace
0513-044 The iptrace Subsystem was requested to stop.
iptrace: unload success!

To overcome a delayed lookup, it is advised to configure the netcd daemon on the requesting host that would cache the response retrieved from resolvers.
4.5.8 TCP retransmissions
TCP retransmissions can occur due to a faulty network, the destination server not able to receive packets, the destination server not able to send the acknowledgement before the retransmission timer expires, or the acknowledgement getting lost somewhere in the middle, to name a few. This leads to the sender retransmitting the packets again, which could degrade the application performance. High retransmission rates between an application and database server, for example, need to be identified and corrected. We illustrate some details on TCP retransmission, the algorithm, and the timer wheel algorithm for retransmission in the following sections.
Identifying TCP retransmissions
The most common commands or tools to identify TCP retransmissions are netstat and iptrace. The first step is to use iptrace to identify whether there are TCP retransmissions in your environment, as shown in Example 4-87.
Example 4-87 Identifying TCP retransmission using iptrace
# startsrc -s iptrace -a "-a /tmp/iptrace_retransmission"
# stopsrc -s iptrace
# ipreport iptrace_retransmission > retransmission.out
# cat retransmission.out
====( 692 bytes transmitted on interface en0 )==== 22:25:50.661774216
ETHERNET packet : [ 3e:73:a0:00:80:02 -> 00:00:0c:07:ac:12 ] type 800 (IP)
IP header breakdown:
< SRC = 9.184.66.46 > (stglbs9.in.ibm.com)
< DST = 9.122.161.39 > (aiwa.in.ibm.com)
ip_v=4, ip_hl=20, ip_tos=0, ip_len=678, ip_id=25397, ip_off=0
ip_ttl=60, ip_sum=2296, ip_p = 6 (TCP)
TCP header breakdown:
<source port=23(telnet), destination port=32943 >
th_seq=2129818250, th_ack=2766657268
th_off=8, flags<PUSH | ACK>
th_win=65322, th_sum=0, th_urp=0
====( 692 bytes transmitted on interface en0 )==== 22:25:51.719416953
ETHERNET packet : [ 3e:73:a0:00:80:02 -> 00:00:0c:07:ac:12 ] type 800 (IP)
IP header breakdown:
< SRC = 9.184.66.46 > (stglbs9.in.ibm.com)
< DST = 9.122.161.39 > (aiwa.in.ibm.com)
ip_v=4, ip_hl=20, ip_tos=0, ip_len=678, ip_id=25399, ip_off=0
ip_ttl=60, ip_sum=2294, ip_p = 6 (TCP)
TCP header breakdown:
<source port=23(telnet), destination port=32943 >
th_seq=2129818250, th_ack=2766657268
th_off=8, flags<PUSH | ACK>
th_win=65322, th_sum=0, th_urp=0
====( 692 bytes transmitted on interface en0 )==== 22:25:54.719558660
ETHERNET packet : [ 3e:73:a0:00:80:02 -> 00:00:0c:07:ac:12 ] type 800 (IP)
IP header breakdown:
< SRC = 9.184.66.46 > (stglbs9.in.ibm.com)
< DST = 9.122.161.39 > (aiwa.in.ibm.com)
ip_v=4, ip_hl=20, ip_tos=0, ip_len=678, ip_id=25404, ip_off=0
ip_ttl=60, ip_sum=228f, ip_p = 6 (TCP)
TCP header breakdown:
<source port=23(telnet), destination port=32943 >
th_seq=2129818250, th_ack=2766657268
th_off=8, flags<PUSH | ACK>
th_win=65322, th_sum=0, th_urp=0
====( 692 bytes transmitted on interface en0 )==== 22:26:00.719770238
ETHERNET packet : [ 3e:73:a0:00:80:02 -> 00:00:0c:07:ac:12 ] type 800 (IP)
IP header breakdown:
< SRC = 9.184.66.46 > (stglbs9.in.ibm.com)
< DST = 9.122.161.39 > (aiwa.in.ibm.com)
ip_v=4, ip_hl=20, ip_tos=0, ip_len=678, ip_id=25418, ip_off=0
ip_ttl=60, ip_sum=2281, ip_p = 6 (TCP)
TCP header breakdown:
<source port=23(telnet), destination port=32943 >
th_seq=2129818250, th_ack=2766657268
th_off=8, flags<PUSH | ACK>
th_win=65322, th_sum=0, th_urp=0
====( 692 bytes transmitted on interface en0 )==== 22:26:12.720165401
ETHERNET packet : [ 3e:73:a0:00:80:02 -> 00:00:0c:07:ac:12 ] type 800 (IP)
IP header breakdown:
< SRC = 9.184.66.46 > (stglbs9.in.ibm.com)
< DST = 9.122.161.39 > (aiwa.in.ibm.com)
ip_v=4, ip_hl=20, ip_tos=0, ip_len=678, ip_id=25436, ip_off=0
ip_ttl=60, ip_sum=226f, ip_p = 6 (TCP)
TCP header breakdown:
<source port=23(telnet), destination port=32943 >
th_seq=2129818250, th_ack=2766657268
th_off=8, flags<PUSH | ACK>
th_win=65322, th_sum=955e, th_urp=0
The sequence number (th_seq) uniquely identifies a packet, and if you observe multiple packets with the same sequence number in the ipreport output, then the particular packet is retransmitted. In the above output, the same packet with 692 bytes is retransmitted four times, which leads to a delay of 22 seconds.
Besides the ipreport command, you can use the Wireshark tool to analyze the iptrace output file. Wireshark is an open source network protocol analyzer. It has a GUI interface and can be used on your laptop. Wireshark can be downloaded at:
http://www.wireshark.org/
Figure 4-18 shows a TCP retransmission example using Wireshark. Note that data is collected when the timer wheel algorithm is enabled, which will be introduced later.
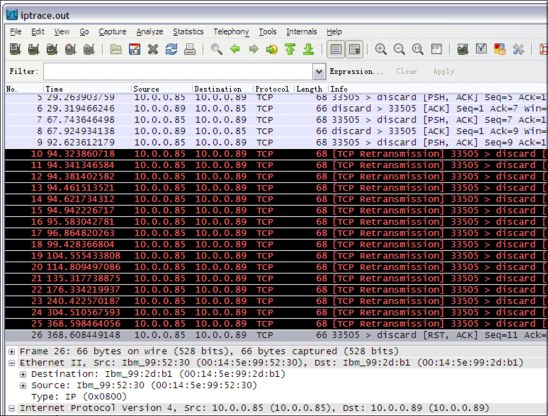
Figure 4-18 TCP retransmission example using the Wireshark tool
Conventional TCP retransmission
Conventional TCP retransmission happens in the following conditions:
•Retransmission timer (RTO) expires
This depends on the RTO calculation. RTO is calculated by smoothed Round Trip Time (RTT). The initial value of RTO is 3 seconds. Because the RTO timer is implemented using the slower timer, the precision is 500 ms. Considering the variance introduced by the smoothed RTT algorithm, the normal RTO for intranet is 1.5 seconds or so.
•The connection goes into fast retransmit phase
This is controlled by the no option tcprexmtthresh, which is 3 by default. This means when three consecutive duplicate ACKs are received, the TCP connection will go to fast retransmit phase, and the retransmit will happen right away.
If ACK is not received, it doubles the previous RTO for each consecutive retransmission of the same segment. The RTO will constantly be rto_high (64 seconds by default) if it exceeds rto_high. The maximum retransmission attempt is set by rto_length, which is 13 by default. This is called the exponential backoff algorithm.
Example 4-88 gives the tcpdump output in a typical TCP retransmission timeout scenario.
Example 4-88 tcpdump output in typical TCP retransmission scenario
09:14:50.731583 IP p750s1aix1.38894 > 10.0.0.89.discard: P 9:11(2) ack 1 win 32761 <nop,nop,timestamp 1351499394 1350655514>
09:14:52.046243 IP p750s1aix1.38894 > 10.0.0.89.discard: P 9:11(2) ack 1 win 32761 <nop,nop,timestamp 1351499396 1350655514> //this is the first retransmission, happens at 1.31 seconds (RTO = 1.5 seconds).
09:14:55.046567 IP p750s1aix1.38894 > 10.0.0.89.discard: P 9:11(2) ack 1 win 32844 <nop,nop,timestamp 1351499402 1350655514> //2nd retransmission, RTO = 3 seconds, doubled.
09:15:01.047152 IP p750s1aix1.38894 > 10.0.0.89.discard: P 9:11(2) ack 1 win 32844 <nop,nop,timestamp 1351499414 1350655514> //3rd retransmission, RTO = 6 seconds, doubled.
09:15:13.048261 IP p750s1aix1.38894 > 10.0.0.89.discard: P 9:11(2) ack 1 win 32844 <nop,nop,timestamp 1351499438 1350655514> //4th retransmission, RTO = 12 seconds, doubled.
09:15:37.050750 IP p750s1aix1.38894 > 10.0.0.89.discard: P 9:11(2) ack 1 win 32844 <nop,nop,timestamp 1351499486 1350655514> //5th retransmission, RTO = 24 seconds, doubled.
09:16:25.060729 IP p750s1aix1.38894 > 10.0.0.89.discard: P 9:11(2) ack 1 win 32844 <nop,nop,timestamp 1351499582 1350655514> //6th retransmission, RTO = 48 seconds, doubled.
09:17:29.067259 IP p750s1aix1.38894 > 10.0.0.89.discard: P 9:11(2) ack 1 win 32844 <nop,nop,timestamp 1351499710 1350655514> //7th retransmission, RTO = 64 seconds, which is equal to rto_high.
09:18:33.074418 IP p750s1aix1.38894 > 10.0.0.89.discard: P 9:11(2) ack 1 win 32844 <nop,nop,timestamp 1351499838 1350655514> //8th retransmission, RTO = 64 seconds.
09:19:37.082240 IP p750s1aix1.38894 > 10.0.0.89.discard: P 9:11(2) ack 1 win 32844 <nop,nop,timestamp 1351499966 1350655514>
09:20:41.088737 IP p750s1aix1.38894 > 10.0.0.89.discard: P 9:11(2) ack 1 win 32844 <nop,nop,timestamp 1351500094 1350655514>
09:21:45.094912 IP p750s1aix1.38894 > 10.0.0.89.discard: P 9:11(2) ack 1 win 32844 <nop,nop,timestamp 1351500222 1350655514>
09:22:49.110835 IP p750s1aix1.38894 > 10.0.0.89.discard: P 9:11(2) ack 1 win 32844 <nop,nop,timestamp 1351500350 1350655514>
09:23:53.116833 IP p750s1aix1.38894 > 10.0.0.89.discard: R 11:11(0) ack 1 win 32844 <nop,nop,timestamp 1351500478 1350655514> //reach the maximum retransmission attempts, rto_length = 13, reset the connection.
|
Note: The tcpdump output in Example 4-88 and Example 4-89 on page 203 illustrates the cases when the maximum retransmission attempts are reached, and the connections are reset. In normal cases, if there is ACK to any of the retransmission packet, the TCP connection becomes normal again, as shown in Example 4-90 on page 204. When there are ACKs to the retransmitted packets, the retransmission ends.
|
Timer wheel algorithm for fine granularity retransmission
The timer wheel algorithm can be enabled by setting the no option timer_wheel_tick=1 or larger value. When the timer wheel algorithm is enabled in AIX, TCP uses a fine granularity retransmission timer with precision equal to timer_wheel_tick * 10ms. When the timer wheel algorithm is in effect, the RTO is initially set by the no option tcp_low_rto, and is adjusted based on real RTT values.
|
Note: The timer wheel algorithm only takes effect after the connection experiences the first segment lost, that is, the two conditions mentioned in the “conventional TCP retransmission” section. Otherwise the conventional retransmission algorithm still prevails.
|
When the timer wheel algorithm is in effect, you can observe faster retransmission. Example 4-89 shows a TCP retransmission scenario when timer_wheel_tick=1 and tcp_low_rto=20. You can see that after the first conventional retransmission timeout (RTO=1.5 seconds), the RTO is set to 20 ms and the timer wheel algorithm is enabled, and the retransmission still uses the "exponential backoff" algorithm.
Example 4-89 tcpdump output for TCP retransmission when the timer wheel algorithm is in effect
10:16:58.014781 IP p750s1aix1.32859 > 10.0.0.89.discard: P 18:20(2) ack 1 win 32761 <nop,nop,timestamp 1350657966 1350657589>
10:16:59.543853 IP p750s1aix1.32859 > 10.0.0.89.discard: P 18:20(2) ack 1 win 32761 <nop,nop,timestamp 1350657969 1350657589>//1st retransmission timer expiry, RTO=1.5s, which is using conventional algorithm
10:16:59.556742 IP p750s1aix1.32859 > 10.0.0.89.discard: P 18:20(2) ack 1 win 32761 <nop,nop,timestamp 1350657970 1350657589>//2nd retransmission, RTO = 13ms(~20ms), that is the tcp_low_rto. timer wheel algorithm is in effect.
10:16:59.601225 IP p750s1aix1.32859 > 10.0.0.89.discard: P 18:20(2) ack 1 win 32844 <nop,nop,timestamp 1350657970 1350657589>//3rd retransmission, RTO = 45ms(~40ms)
10:16:59.681372 IP p750s1aix1.32859 > 10.0.0.89.discard: P 18:20(2) ack 1 win 32844 <nop,nop,timestamp 1350657970 1350657589>//4th retransmission, RTO = 80ms
10:16:59.841581 IP p750s1aix1.32859 > 10.0.0.89.discard: P 18:20(2) ack 1 win 32844 <nop,nop,timestamp 1350657970 1350657589>//5th retransmission, RTO = 160ms
10:17:00.162023 IP p750s1aix1.32859 > 10.0.0.89.discard: P 18:20(2) ack 1 win 32844 <nop,nop,timestamp 1350657971 1350657589>
10:17:00.802936 IP p750s1aix1.32859 > 10.0.0.89.discard: P 18:20(2) ack 1 win 32844 <nop,nop,timestamp 1350657972 1350657589>
10:17:02.084883 IP p750s1aix1.32859 > 10.0.0.89.discard: P 18:20(2) ack 1 win 32844 <nop,nop,timestamp 1350657975 1350657589>
10:17:04.648699 IP p750s1aix1.32859 > 10.0.0.89.discard: P 18:20(2) ack 1 win 32844 <nop,nop,timestamp 1350657980 1350657589>
10:17:09.776109 IP p750s1aix1.32859 > 10.0.0.89.discard: P 18:20(2) ack 1 win 32844 <nop,nop,timestamp 1350657990 1350657589>
10:17:20.030824 IP p750s1aix1.32859 > 10.0.0.89.discard: P 18:20(2) ack 1 win 32844 <nop,nop,timestamp 1350658010 1350657589>
10:17:40.550530 IP p750s1aix1.32859 > 10.0.0.89.discard: P 18:20(2) ack 1 win 32844 <nop,nop,timestamp 1350658052 1350657589>
10:18:21.569311 IP p750s1aix1.32859 > 10.0.0.89.discard: P 18:20(2) ack 1 win 32844 <nop,nop,timestamp 1350658134 1350657589>
10:19:25.657746 IP p750s1aix1.32859 > 10.0.0.89.discard: P 18:20(2) ack 1 win 32844 <nop,nop,timestamp 1350658262 1350657589>
10:20:29.746815 IP p750s1aix1.32859 > 10.0.0.89.discard: P 18:20(2) ack 1 win 32844 <nop,nop,timestamp 1350658390 1350657589>
10:21:33.836267 IP p750s1aix1.32859 > 10.0.0.89.discard: P 18:20(2) ack 1 win 32844 <nop,nop,timestamp 1350658518 1350657589>
10:21:33.846253 IP p750s1aix1.32859 > 10.0.0.89.discard: R 20:20(0) ack 1 win 32844 <nop,nop,timestamp 1350658518 1350657589>//reach the maximum retransmission attempts, TCP_LOW_RTO_LENGTH=15, reset the connection.
The tcp_low_rto is only used once for each TCP connection when the timer wheel algorithm starts to function. Afterward RTO is calculated based on RTT, and the value is dynamic, depending on the network conditions. Example 4-90 gives an example on future retransmission timeouts when the timer wheel algorithm has already been enabled.
Example 4-90 Following retransmission timeout when timer wheel algorithm is already enabled
10:52:07.343305 IP p750s1aix1.32907 > 10.0.0.89.discard: P 152:154(2) ack 1 win 32844 <nop,nop,timestamp 1350662185 1350661918>
10:52:07.482464 IP 10.0.0.89.discard > p750s1aix1.32907: . ack 154 win 65522 <nop,nop,timestamp 1350661918 1350662185>
10:52:22.351340 IP p750s1aix1.32907 > 10.0.0.89.discard: P 154:156(2) ack 1 win 32844 <nop,nop,timestamp 1350662215 1350661918>
10:52:22.583407 IP p750s1aix1.32907 > 10.0.0.89.discard: P 154:156(2) ack 1 win 32844 <nop,nop,timestamp 1350662215 1350661918> //This time the 1st retransmission happens at 230ms. This is based on the real RTO, not tcp_low_rto=20ms anymore.
10:52:23.064068 IP p750s1aix1.32907 > 10.0.0.89.discard: P 154:156(2) ack 1 win 32844 <nop,nop,timestamp 1350662216 1350661918>
10:52:24.025950 IP p750s1aix1.32907 > 10.0.0.89.discard: P 154:156(2) ack 1 win 32844 <nop,nop,timestamp 1350662218 1350661918>
10:52:25.948219 IP p750s1aix1.32907 > 10.0.0.89.discard: P 154:156(2) ack 1 win 32844 <nop,nop,timestamp 1350662222 1350661918>
10:52:29.793564 IP p750s1aix1.32907 > 10.0.0.89.discard: P 154:156(2) ack 1 win 32844 <nop,nop,timestamp 1350662230 1350661918>
10:52:37.484235 IP p750s1aix1.32907 > 10.0.0.89.discard: P 154:156(2) ack 1 win 32844 <nop,nop,timestamp 1350662245 1350661918>
10:52:52.865914 IP p750s1aix1.32907 > 10.0.0.89.discard: P 154:156(2) ack 1 win 32844 <nop,nop,timestamp 1350662276 1350661918>
10:52:52.885960 IP 10.0.0.89.discard > p750s1aix1.32907: . ack 156 win 65522 <nop,nop,timestamp 1350662009 1350662276> //ACK received for the 7th retransmission, and then the retransmission ends.
|
Note: For a high-speed network such as 10 Gb, if there is occasional data loss, it should help to enable the timer wheel algorithm by setting the timer_wheel_tick and tcp_low_rto no options. Then the TCP retransmission will be much faster than the default.
Due to the default delayed acknowledgment feature of AIX, the real RTT is usually larger than the value of the no option fastimo. Thus the tcp_low_rto should be larger than the value of fastimo, unless the no option tcp_nodelayack is set to 1.
|
We used the inet discard service to generate the data flow and tcpdump to dump information of the network packets for the samples in this section. You can duplicate the tests in your own environment.
For more details, refer to the “Implement lower timer granularity for retransmission of TCP” at:
http://www.ibm.com/developerworks/aix/library/au-lowertime/index.html
4.5.9 tcp_fastlo
Different applications that run on the same partition and communicate to each other via the loopback interface may gain some performance improvement by enabling the tcp_fastlo parameter. It will simplify the TCP stack loopback communication.
The tcp_fastlo parameter enables the Fastpath Loopback on AIX. With this option enabled, systems that make use of local communication can benefit from improved throughput and processor saving.
Traffic accounting for loopback traffic is not seen on the loopback interface when Fastpath Loopback is enabled. Instead that traffic is reported by specific counters. The TCP traffic though is still accounted as usual.
Example 4-91 illustrates the use of the netstat command to get the statistics when Fastpath Loopback is enabled.
Example 4-91 netstat output showing Fastpath LOOPBACK traffic
# netstat -p tcp | grep fastpath
34 fastpath loopback connections
14648280 fastpath loopback sent packets (14999698287 bytes)
14648280 fastpath loopback received packets (14999698287 bytes
The parameter tcp_fastlo_crosswpar is also available to enable the same functionality for Workload Partition environments.
4.5.10 MTU size, jumbo frames, and performance
Maximum transmit unit (MTU) represents the maximum size that a frame being transmitted to the network can have. The MTU is a standard value that ideally must be set equally across all network devices. For Ethernet networks this size is 1500 bytes. Each piece of data transmitted among the hosts is done in small chunks of MTU size, representing some I/O system calls for each of them.
Jumbo frames enable systems for an MTU size of 9000 bytes, meaning that large transmission of data can be performed with fewer system calls.
Theoretically, since fewer system calls are required to transmit large data, some performance gain would be observed in some environments. We say theoretically, because to have jumbo frames enabled on a server, you must ensure that all the other network components, including other servers, are enabled as well. Devices that do not support jumbo frames would simply drop the frames and return some ICMP notification message to the sender, causing retransmission and implying some network performance problems.
Workloads such as web servers, which usually transmit small pieces of data, would usually not benefit from large MTU sizes.
|
Note: Before changing the MTU size of the server, ensure that your network supports that setting.
|
|
Important: Some environments block ICMP on firewalls to avoid network attacks. This means that an ICMP notification message may never reach the sender in these environments.
|
..................Content has been hidden....................
You can't read the all page of ebook, please click here login for view all page.