

IBM Storage Insights
This chapter describes IBM Storage Insights integration with VMware.
IBM Storage Insights is an IBM Cloud® software as a service (SaaS) offering that can help you monitor and optimize the storage resources in the system and across your data center.
IBM Storage Insights provides cognitive support capabilities, monitoring, and reporting for storage systems, switches and fabrics, and VMware Elastic Sky X integrated (ESXi) hosts in a single dashboard.
IBM Storage Insights provides the following features:
•Enterprise monitoring dashboard
•Device event alerting
•Performance checking
•Capacity checking
•Service ticket processing
•Streamlined uploading of diagnostic data
This chapter includes the following sections:
7.1 IBM Storage Insights editions
Two versions of IBM Storage Insights are available: IBM Storage Insights and IBM Storage Insights Pro (Table 7-1).
•IBM Storage Insights is available at no additional charge to owners of IBM block storage systems who sign up. IBM Storage Insights provides an environment overview, integration into support processes, and shows you IBM analysis results.
•The IBM Storage Insights Pro capacity-based subscription version includes all
IBM Storage Insights no-charge functions, plus more information, a longer history, and more capabilities through a monthly subscription.
IBM Storage Insights no-charge functions, plus more information, a longer history, and more capabilities through a monthly subscription.
Table 7-1 Different features of both versions
|
Resource management
|
Functions
|
IBM Storage Insights
|
IBM Storage Insights Pro (subscription)
|
|
Monitoring
|
Inventory management
|
IBM block storage, switches, fabrics, and VMware ESXi hosts
|
IBM and non IBM block storage, file storage, object storage, switches, fabrics, and VMware ESXi hosts
|
|
Logical configuration
|
Basic
|
Advanced
| |
|
Health
|
Call Home events
|
Call Home events
| |
|
Performance
|
Basic:
•3 storage system metrics: I/O rate, data rate, and response times aggregated for storage systems
•4 switch metrics: port saturation, port congestion, port hardware errors, and port logical errors
•3 host metrics: host I/O rate, host data rate, and host response time
•3 virtual machine (VM) metrics: VM I/O rate, VM data rate, and VM response time
|
Advanced:
•100+ metrics for storage systems and their components
•40+ metrics for switches and related components
•10+ metrics for hosts and related components
•10+ metrics for VMs and related components
| |
|
Monitoring (cont.)
|
Capacity
|
Basic:
•4 metrics: used capacity, available capacity, total capacity, and compression savings aggregated for storage systems
•2 host metrics: storage area network (SAN) capacity and used SAN capacity
•2 VM metrics: SAN capacity and used SAN capacity
|
Advanced:
•25+ metrics for storage systems and their components
•10+ metrics for hosts and related components
•10+ metrics for VMs and related components
|
|
Drill-down performance workflows to enable deep troubleshooting
|
|
| |
|
Explore virtualization relationships.
|
|
| |
|
Explore replication relationships.
|
|
| |
|
Retention of configuration and capacity data
|
Only the last 24 hours are shown.
|
2 years
| |
|
Retention of performance data
|
Only the last 24 hours are shown.
|
1 year
| |
|
Exporting performance data to a file
|
|
| |
|
Service
|
Filter events to quickly isolate trouble spots.
|
|
|
|
Hassle-free log collection
|
|
| |
|
Simplified ticketing
|
|
| |
|
Show active Problem Management Reports (PMRs) and ticket history.
|
|
| |
|
Reporting
|
Inventory, capacity, performance, and storage consumption reports
|
•Capacity reports for block storage systems and pools
•Inventory reports for block storage systems, switches, chassis, and switch ports
|
All reports
|
|
Alerting and Analytics
|
Predictive alerts
|
|
|
|
Customizable, multi-conditional alerting, including alert policies
|
|
| |
|
Performance planning
|
|
| |
|
Capacity planning
|
|
| |
|
Business impact analysis (applications, departments, and groups)
|
|
| |
|
Optimize data placement with tiering.
|
|
| |
|
Optimize capacity with reclamation.
|
|
| |
|
Security
|
ISO/IEC 27001 Information Security Management standards certified
|
|
|
|
Entitlements
|
|
No additional charge
|
Capacity-based subscription
|
|
Restriction: You must have a current warranty or maintenance agreement for an IBM block storage system to open tickets and send log packages.
|
IBM Storage Insights for IBM Spectrum Control
IBM Storage Insights for IBM Spectrum Control is an IBM Cloud service that can help you predict and prevent storage problems before they impact your business. It is complementary to IBM Spectrum Control.
As an on-premises application, IBM Spectrum Control does not send the metadata about monitored devices off-site, which is ideal for dark shops and sites that do not want to open ports to the cloud. However, if your organization allows for communication between its network and the cloud, you can use IBM Storage Insights for IBM Spectrum Control to transform your support experience for IBM block storage.
IBM Storage Insights for IBM Spectrum Control is like IBM Storage Insights Pro in capability, and it is available for no additional cost if you have an active license with a current subscription and support agreement for IBM Virtual Storage Center, IBM Spectrum Storage Suite, or any edition of IBM Spectrum Control.
7.2 IBM Storage Insights architecture
IBM Storage Insights provides a lightweight data collector that is deployed on a Linux, Windows, or IBM AIX server, or a guest in a VM (for example, a VMware guest).
The data collector streams performance, capacity, asset, and configuration metadata to your IBM Cloud instance.
The metadata flows in one direction, that is, from your data center to IBM Cloud over HTTPS. In the IBM Cloud, your metadata is protected by physical, organizational, access, and security controls. IBM Storage Insights is ISO/IEC 27001 Information Security Management certified.
Figure 7-1 shows the architecture of the IBM Storage Insights application, the supported products, and the three main teams who can benefit from using the tool.

Figure 7-1 IBM Storage Insights architecture
For more information about IBM Storage Insights and to sign up and register for the no-charge service, see the following resources:
7.3 IBM Storage Insights Monitoring
With IBM Storage Insights, you get the information that you need to monitor the health of your block storage environment and fabrics on the Operations dashboard, as shown in Figure 7-2.

Figure 7-2 IBM Storage Insights System overview for block storage
The block storage dashboard is a default one that is shown when you go to the Operations dashboard. To take a close look at the storage systems that are being monitored, select Dashboards → Operations. Then, click the storage system in which you are interested in the list at the left of the dashboard. For example, you can see the health, capacity, and performance information for a block storage system in the Operations dashboard. The storage system is colored red because there are problems with nodes and logical components.
IBM Storage Insights supports Brocade and Cisco switches and fabrics so that you can detect and investigate performance issues throughout your storage environment. You can follow the trail of storage requests through the components in the SAN fabric to the target storage systems.
For more information about IBM Storage Insights, see Key features on IBM Storage Insights Documentation.
7.4 IBM Storage Insights VMware integration
You can add VMware ESXi hosts and their VMs for monitoring with IBM Storage Insights by specifying connection information for a vCenter Server. When you add VMware ESXi hosts, then you can collect data, generate reports, and manage storage that is related to hosts and VMs.
Identify the IP addresses and user credentials of the vCenter Servers that manage the VMware ESXi hosts and VMs that you want to monitor by completing the following steps.
IBM Storage Insights uses this information to connect to the vCenter Servers and discover their managed VMware ESXi hosts and VMs. You can add multiple vCenter Servers concurrently if they share the same user credentials.
IBM Storage Insights uses this information to connect to the vCenter Servers and discover their managed VMware ESXi hosts and VMs. You can add multiple vCenter Servers concurrently if they share the same user credentials.
1. In the menu bar, select Resources → Hosts.
2. Click Add vCenter Server.
3. Enter the IP addresses or hostnames that you use to connect to the vCenter Server, and then enter the authentication credentials such as username and password that are shared by all the vCenter Servers that you are adding, as shown in Figure 7-3.

Figure 7-3 Adding vCenter Server
|
Note: When you add vCenter Servers for monitoring, you must specify the connection credentials of users that are used to collect metadata. The users must meet the following requirements:
•Role: Read Only (minimum). For example, the Administrator role or Virtual Machine Power User role.
•Privilege: Browse data store.
|
After the VCenter server initial discovery starts, all ESXi hosts and VMs that are managed by VCenter are discovered by IBM Storage Insights. You can see details of each ESXi host on the IBM Storage Insights Pro edition, as shown in Figure 7-4.

Figure 7-4 ESXi host details with daily response time, IO rate, and most active volumes on IBM Storage Insights
End-to-end SAN connectivity is visible when IBM Storage systems, SAN switches, and VMware ESXi servers are added to IBM Storage Insights.
Most of the time, it is a complex process to find which VM creates heavy I/O on a data store volume. IBM Storage Insights Pro can monitor virtual machine disk (VMDK) level I/O performance, and you can find the heavy loaded VM, as shown in Figure 7-5.
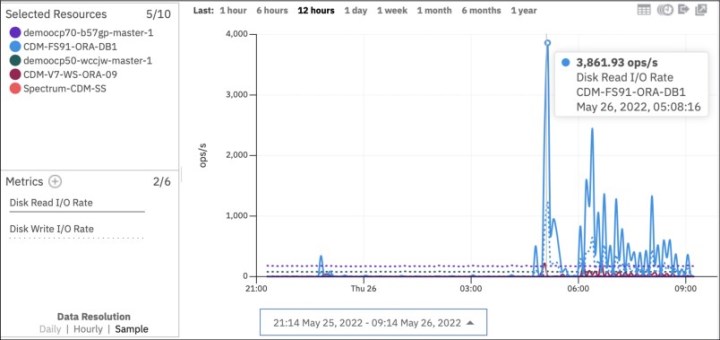
Figure 7-5 VMDK level performance monitoring on IBM Storage Insights Pro
..................Content has been hidden....................
You can't read the all page of ebook, please click here login for view all page.