
Now that we have created a report on the on-premise data warehouse, we'll add some data from the cloud to it. We'll add the table we created using Databricks. To extract data from there, the cluster must be an interactive one and must also be running. To connect to Spark from Power BI, we need to use a connector that is in preview but works quite well for now.
To connect to SQL Server on-premise, we used the direct query mode. Direct query is very convenient because it does not require importing the data into the model, but it has some limitations. The one that affects us the most is that we cannot use it when the model is connected to more than one database. We're going to connect the model to the Spark cluster, so we'll lose the direct query capability of SQL Server, but our Power BI model will contain data from multiple sources.
To connect to the Spark cluster, we'll use the JDBC connection available with the premium version of our Databricks cluster. As shown in the following screenshot, click on Get Data in the Power BI toolbar and select the Spark (Beta) connector:

We may receive a message saying that the connector is still under development. Click on Continue to dismiss that window.
The next screen will ask us to select the server and the protocol. We'll use HTTP for the protocol. For the server name, it's a bit tricky with this connector.

First, we go to the cluster in Databricks and, as shown in the following screenshot, click on JDBC/ODBC:

Now, the way to construct the server string is as follows—we replace jdbc:hive2 with https and keep the substring up until :443/, as shown in the following screenshot:
Becomes https://eastus.azuredatabricks.net:443/. Then, we use the second part by using the last part of the string:
So, the server becomes: https://eastus.azuredatabricks.net:443/sql/protocolv1/o/5935092853513601/0519-233033-mimes124.
Next, we use the same token as we used in ADF as our password and token as our username to complete the connection, as shown in the following screenshot:

The navigator appears, and we can select the sales table. Click on Load to add the table to the model.
Now, this is where we face the limit of the Power BI direct query. As shown in the following screenshot, we're asked to switch to import mode. Click on Switch to proceed. The model will then import all tables' data, SQL Server, and Spark:

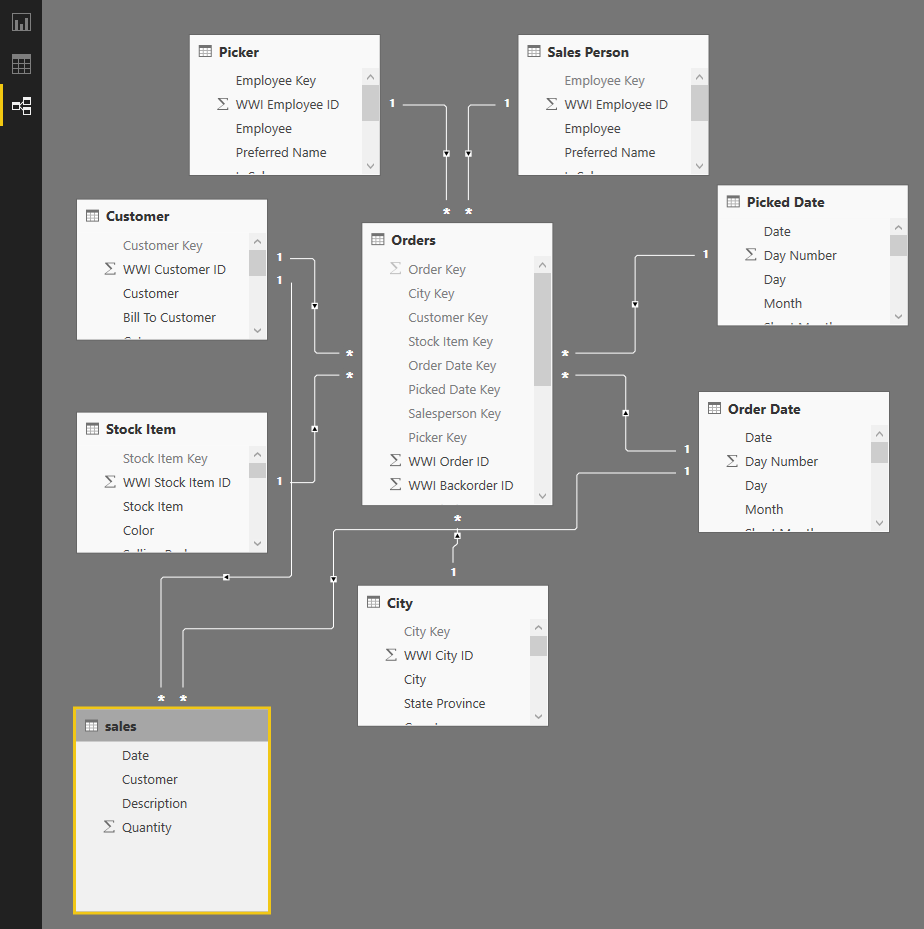
Switch to relationships mode and link the Order Date dimension to the Date column of the sales table. Do the same for the Customer dimension, as shown in this screenshot:
Now that we have linked the Spark table to the data warehouse tables, we go to the report view and add a new page to Power BI by clicking on the + sign at the bottom of the first page, as shown in the following screenshot:
We're now going to produce the following page:
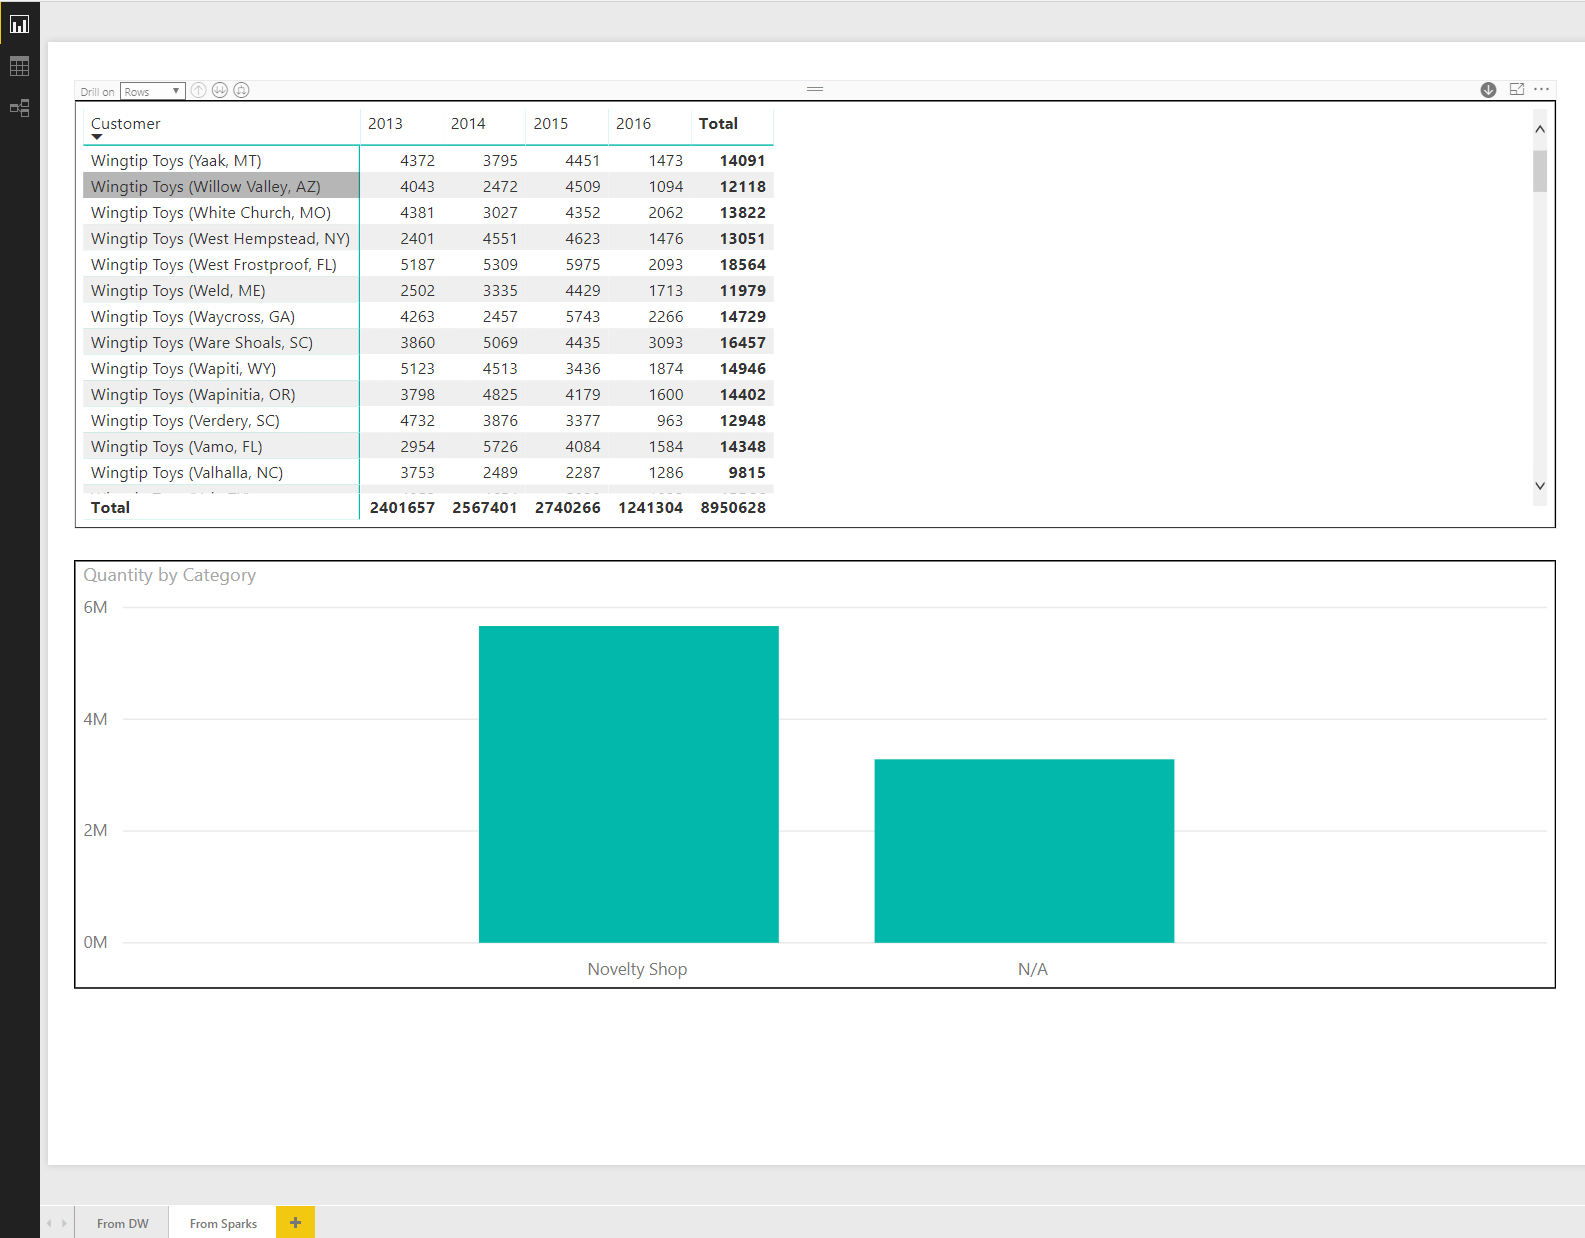
At the top of the page, we insert a matrix visualization and set its fields as shown in the following screenshot:
Rows:
- Customer
- Bill To Customer
- Primary Contact
Columns:
- Calendar Year
- Calendar Month Label
- Date
Values: Quantity

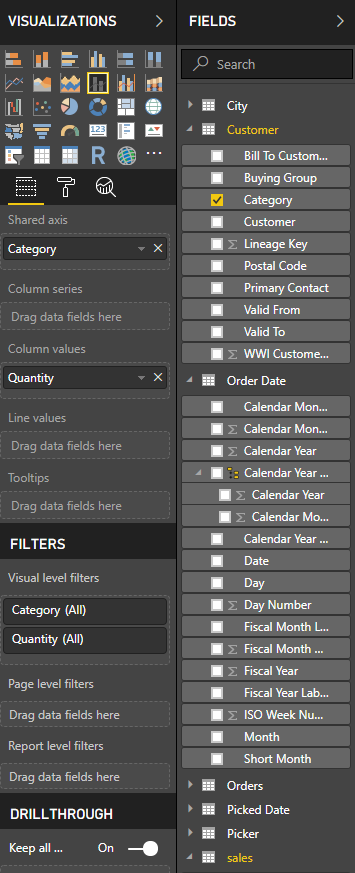
The lower visualization is a stacked column chart. Here is the fields usage of the chart:
- Shared axis: Category
- Column values: Quantity
And here is a screenshot of the fields usage:
That's it! We now have a report based on both on-premise and cloud data. We'll publish it to the Power BI service on the cloud. As we did earlier in this chapter, we click on the Publish button in the Power BI toolbar. The following window appears:
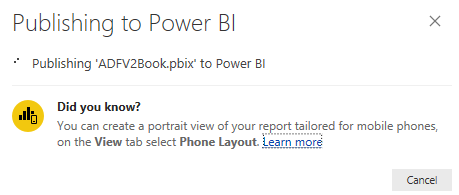
It might take some time as the data is also uploaded on the cloud. Once completed, the following window appears:

Click on Open 'ADFV2Book.pbix' in Power BI to go the report on the cloud, as shown in the following screenshot:
