
Our first Power BI report will use the on-premise World Wide Importers we talked about earlier in this book. We will first connect to the World Wide Importers relational database using Power BI for desktop.
If you haven't created an account yet, create one now; it's free. If you already have a Power BI account, select the link as highlighted in the following screenshot:

Once connected, uncheck Show this screen on startup and click on the Get data.
In the Get Data window, select SQL Server database and click on Connect:

As shown in the following screenshot, enter the local on-premise server name and choose DirectQuery in the Data Connectivity mode. This mode doesn't import the data into the model; it only establishes a connection to our data warehouse database. This is the recommended mode to use when you are using a data warehouse as a data source. It allows access to live data and doesn't use space on the user's PC or in the Power BI service. Click on OK to proceed to the next step:

We're going to connect to the on-premise SQL Server instance where the WWImportersDW database is located. We'll use our current credentials for it. Select Use my current credentials and click on Connect:

Click on OK if you see a message like the one in the following screenshot. It simply tells us that the data source we're using is not encrypted. In a real-world situation, we would like to have it encrypted to make it more secure. An SQL Server DBA would be securing the connection then.

The navigator appears; we select some dimensions:
- Dimension.City
- Dimension.Customer
- Dimension.Date
- Dimension.StockItem
We also select a fact table:
- Fact.Orders
Click on the Load button (when done) at the bottom-right corner of the navigator. You should get a screen showing you the connections created. Once done, you're back to the Power BI Desktop. As shown in the following screenshot, select the data view at the upper-left section of the Power BI for desktop window. The table you selected appears.

Two dimensions, Employee and Date, have two relationships. They are role-playing dimensions. In Power BI, only one relationship can be active at a time. We're going to create two other dimensions. They won't be copies of the originals but rather pointers to them.
Select Dimension.Date in Power BI and click on Edit Queries in the top toolbar in the External Data group. The table definition appears.
Right-click on Order.Date and select Reference from the menu that appears:

A new dimension appears in the Queries window: Dimension.Order2. As shown in the following screenshot, right-click on it to rename it as Picked Date:

Click on the button Close & Apply in the toolbar to apply the changes.
Repeat the same exercise for the Employee dimension. Rename the referenced table as Picker and the original one as Sales Person. As you can see in the following screenshot, when a relationship is selected, the related columns are highlighted. As stated before, a table can only have one active relationship at a time. A solid line represents the active relationship and a dashed one represents an inactive relationship. Select the Picked Date table to delete the relationship. Right-click on the line to the Order Date Key in Fact Orders to delete it:

Now, double-click on the inactive relationship; the Edit relationship windows opens. As shown in the following screenshot, check the Make this relationship active checkbox at the bottom-left of the window and click on OK to complete the operation:

Repeat the same operation for Order Date, Sales Person, and Picker tables. Keep only one active relationship.
Now, we'll hide the surrogate keys and other unnecessary columns. To do that, we simply right-click on such a column and select Hide in report view, as shown here:

Your Power BI window should look like the following screenshot when completed:

Now, let's go to the report view. As shown in this screenshot, click on the graph icon at the top-left of the Power BI window to switch to the report view:

You should see in the rightmost part of your screen something like the following screenshot—the VISUALIZATIONS and FIELDS panes:

We'll drag three visualizations on the screen: a slicer, a stacked bar chart, and a table. The final report will look like this:

We first add a title to the report. From the insert section of the toolbar, select a textbox and drag it to the top-left of the report. Change the title to World Wide Importers and set the font to 28 pts. Press Enter on your keyboard to insert a new line and type Orders by year, as shown in the following screenshot. Set the font to 14 pts. Select the two lines, select the bold icon, and align them to the center of the textbox.

Next, we'll add a slicer for the years. Click on the slicer from the VISUALIZATIONS panel and drag it near the textbox you just added in the previous step. From the field list, drag the column Calendar Year in the Order Date dimension, as shown in the following screenshot:

Next, click on the roller brush and adjust the formatting parameter, as shown in this screenshot:

We'll now set the Order Date.Calendar Month Label sort property to make sure that months are sorted by month number (1-12) and not month name. If we don't do that, the visualizations using the calendar month field would show December as the first month of the year. Select the Calendar Month Label column and go to the modeling tab in the toolbar; click on Sort by Column and select Calendar Month Number.
This will make sure that the months will appear in a natural order from January to December. Now, we'll click on the stacked bar chart in the VISUALIZATIONS pane. We drag the Calendar Month Label and the Date fields from the Order Date dimension to the Axis property of the chart. We also drag the Buying Group field from the Customer dimension to the Legend property, and then the Quantity field from the Fact Orders fact table to the Value property, as shown in the following screenshot:

Finally, we'll add a table from the VISUALIZATIONS pane, and set the value using the fields Quantity from the Fact Orders and Stock Item from the dimension Stock Item.
For all the visualizations except the textbox, set the Border property in the format pane to On.
We have now finished our first Power BI report! Now, we'll publish it to the cloud. Click on Publish in the far right part of the toolbar. The Publish to Power BI window opens, as shown in the following screenshot. Leave the destination as My workspace, the default, and click on the Select button in the lower right of the window:

The report will be published to the Power BI service on the cloud. You may get a warning that the report cannot run since your data warehouse source is not available. This is normal since we're missing an important part of our deployment: the data gateway.
Click on Open ADFBook.pbix in Power BI as shown in the earlier screenshot to open the Power BI portal. Once in there, click on the Download icon at the top right and select Data gateway.
The On-premises data gateway installer opens once downloaded. As shown in the following screenshot, ensure that the recommended data gateway option is selected and click on Next:

Enter a name and password for the recovery key and click on Configure, as shown in this screenshot:

A screen like the following is displayed once the data gateway is configured. Click on Close to get rid of it:

Having a data gateway configured is the first step. Now, we'll add a connection to our on-premise data warehouse to it. Click on the settings gear at the top right of the toolbar and select Manage gateways from the menu that appears.
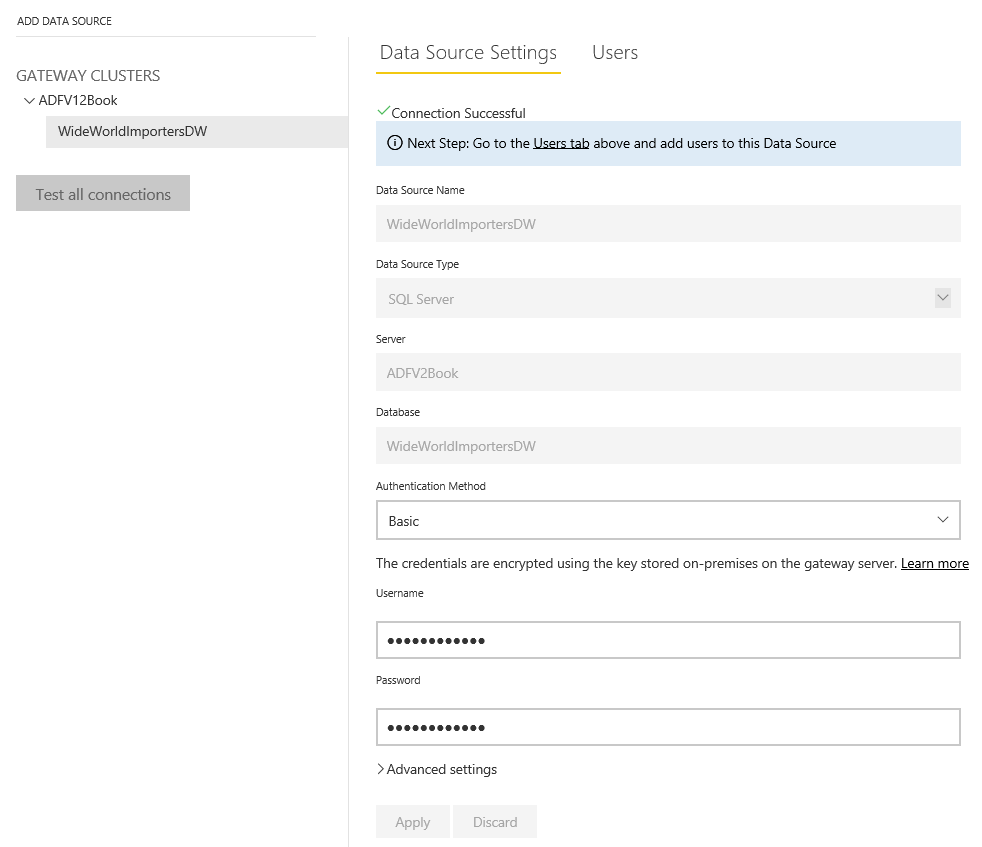
Select ADFV2Cookboox data gateway and click on New data source. Set the data source settings as shown in the following screenshot. Set the Authentication Method to Windows; use your Windows username and password as the credentials. Once done, click on the Add button:

You should get to a screen like this:
Power BI service can now connect to our on-premise data warehouse. We can now go back to the report and see that it works properly, as shown in the following screenshot:
