
In this section, we reintroduce kernel density estimation (KDE). When using kernel density estimation, we are attempting to reveal the shape of a dataset with a limited amount of information. Also, in this section, we're going to investigate which movies in the dataset have the highest rating; we're going to compute the KDE of a select group of movies using their rating; and, finally, compute the KDE overlap of two movies.
Let's go back to our MovieLens dataset notebook and import Data.Maybe, as shown in the following example:

If you recall, this library is used in our KDE function. So, we are going to use the KDE function, which is almost identical to what we saw in the last section. The one addition is that we have added a normal line to the bottom of the function, as demonstrated in the following example:

This is a normal kernel KDE with a standard deviation of 1. What we would like to do next is run a query that tells us which movies in our dataset have the highest ratings. Not only that, we would like to get the title of those movies based on the items dataset, as shown in the following code:
quickQuery db "SELECT data.itemid, items.title FROM data, items WHERE data.itemid=items.movieid GROUP BY data.itemid ORDER BY count(data.rating) DESC LIMIT 10" []
As this is going to produce a lot of data, we have limited our response to 10 records, as shown in the following example:

So, what you see printed out on the screen are two pieces of information per record. If you recall, the two pieces of information are the data.itemid and the title. So, the data listed will be in order of what has the highest count in our dataset based on the data.itemid. So, data ID 50 has the most entries in our dataset, followed by 258, 100, and so on. The movies in order are Star Wars, Contact, Fargo, Return of the Jedi, and so on. So, next, we are going to compute the KDE of the top movie in our dataset, the one that has been reviewed the most often, in this case, Star Wars. So, let's pull the data out of the Star Wars, and we'll call this starwarsRaw, as shown in the following example:
![]()
So, we have done a quickQuery on our database and we are going to just select the rating from data where the itemid is equal to 50, and that will represent Star Wars. Now, let's convert the starwarsRaw dataset into a list of Doubles. We will name this as starwars, as shown in the following example:
![]()
We are reading from the column in starwarsRaw. If you recall, this is a single-column dataset, but it's not easy to access that one column. So, we are going to grab the first row after our transpose. Now, let's look at the length of starwars, as shown in the following example:

There are 583 ratings for Star Wars in this dataset. Let's try these three steps again with a different movie, and the one I picked out is Liar Liar, as shown in the following example:
![]()
We have changed the itemid from 50 to 294 as it's the ID of Liar Liar, and we have named it as liarliarRaw. Next we convert liarliarRaw into a list of Doubles, and name this liarliar, as shown in the following example:
![]()
Finally, let's look at the length of liarliar, as shown in the following example:

We got 485. So, these are two different datasets, not only in the values represented by the list but also the number of elements in that list. Next, we should compute the KDE. So, we're going to compute the KDE of Star Wars, followed by the KDE of the movie Liar Liar, as shown in the following example:
![]()
It is straightforward, we have already seen this in the Chapter 5, Kernel Density Estimation. We'll do the same thing again for Liar Liar, as shown in the following example:
![]()
Next, we want to display the dataset. If you recall, the first dataset is always in red and the second dataset is always in green unless you override it, as shown in the following example:

So, we'll just be plotting these two lines, as shown on the following graph:

So, as you can see, the red line represents Star Wars. It appears to be a well-received, well-reviewed movie. Notice that the curve produced by the kernel density estimator is slanted towards the high numbers such as 4 and 5. In fact, you can make the case that it extends well past 5 on into 6, and even 8, whereas, the movie Liar Liar has a lagging curve behind Star Wars. Now, here we see two kernel density estimators for two different movies, representing two different datasets of different lengths. What we would like to do is see if we can draw a comparison between these two curves. How similar are these two curves? You can clearly see that there's some distance between the two. What we will try to do next is to measure the area formed by the triangular shape on our plot. Do you see the point where the red and green lines cross and the red line extends down to the left, while the green line extends down the right? It forms a triangular shape area, we're going to call that the overlap, and we want to find the area of that overlap. Let's close the plot and go back to our Notebook.
In order to find the area of that triangular portion in our two kernel density estimators, we first need to align the datasets. So, let's look at the domain of the two datasets. So, the domainSW for Star Wars is as follows:
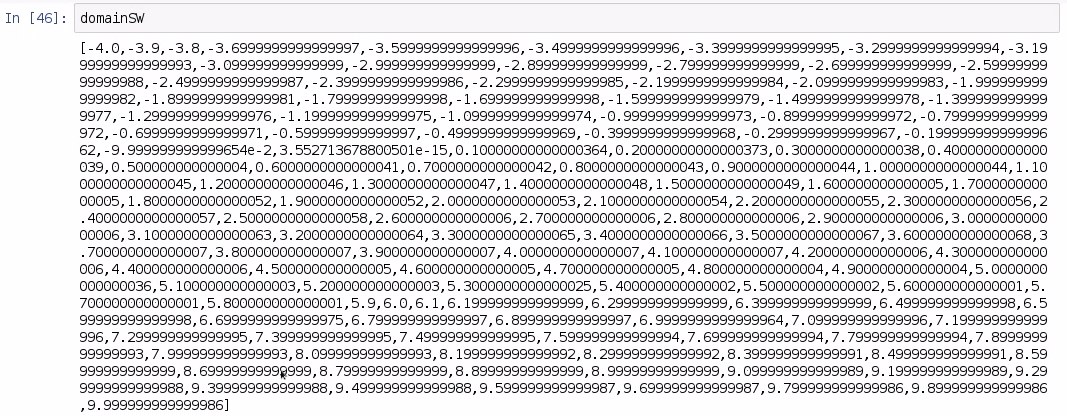
As you can see it begins at -4 and extends almost to 10. Now let's look at the domain for Liar Liar in the following example:

This also begins at -4 and it extends almost to 10. These are identical lists. There's an easy explanation as to why these are identical: both movies had at least one 5 and at least one 1, and, because of that, the ranges are identical. The convenience of having identical ranges means that the KDEs also line up naturally; and, in order to compute the overlap of these two KDEs, we simply look for any point in which one line overlaps another line, and then we take whichever one is at the bottom. And then, after we have accumulated all of the lengths of lines that are lower than another line, we compute the sum of those. The following example shows what we're going to do:

We have passed in two values, and we have called them sw and ll. If Liar Liar is less than or equal to Star Wars, then we want Liar Liar to be the representative line, otherwise we want Star Wars to be the representative one. We then have passed in our two datasets, and zipped them. So, mykdeSW is our first one, and mykdeLL is our second one. We are basically adding up all of the lines and picking out whichever one exists at the bottom, and we see that we have an overlap score of 0.65. Now, you may be asking yourself: what does this demonstrate? What is 0.65? Well, this is known as a similarity score. A similarity score judges how similar two datasets are, whereas a different score measures how different two sets are. Typically with a similarity score, a score of 1 represents that two datasets are identical. We can demonstrate this by taking our previous line, and changing the second dataset to be Star Wars as well, as shown in the following example:

We can see that we're passing in two Star Wars datasets to the rest of our line, and we get, with the forgiving rounding error of Haskell, identical lines, as the result is 1. Now if we were to pass in two completely non-overlapping lines, we should get a score of 0. So, 1 means that we have lines which are perfectly similar, and 0 means we have lines which are dissimilar in every respect. Now, while there's not a lot of application here, there are many applications in math and science in which the opportunity comes to look for the similarity between two datasets; and the datasets, for whatever reason, don't have the same number of elements. But, with a little bit of work, you should be able to compute the KDEs of those two datasets, line them up along their domain (in our case, conveniently, they're already lined up on the domain), and then simply sum up all of the values that are on the bottom. If you get a value 1, or at least close to 1, then you know these two datasets are going to be very similar. So, in our case we had 65 % similarity, but I wouldn't go around saying that these are almost identical.