
Chapter 16
Accounting Ratios
LEARNING OBJECTIVES
After studying this chapter, you would be able to understand
Meaning of Ratio and Ratio Analysis
Objective of Ratio Analysis
Advantages and Uses of Ratio Analysis
Limitations of Ratio Analysis
Classification of Ratios
Liquidity Ratios – Computations
Solvency Ratios – Computations
Profitability Ratios – Computations
Activity Ratios – Computations
Ratios
INTRODUCTION
Usually the accounting goal in preparing financial statements is to provide valuable information to its different types of users. They mainly concentrate on collecting financial data and preparing financial statements — Balance Sheet and Income Statement. These statements provide only certain figures for its components. In order to make the information more useful, these financial statements are analysed by applying different techniques. One such technique or tool employed for analysing financial statements is “Ratio Analysis”, the corner stone of financial analysis is the use of ratios. As ratios capture critical dimension of the economic performance of business entities, the study of ratio analysis has gained much importance now-a-days. Numbers depicted in financial statements are hard to understand out of context. For example, “Profit Rs 2,50,000” — shown in income statement cannot reveal the exact real meaning unless it is analysed with other items (components), that is, how much capital is employed to achieve this profit. Likewise, this may be analysed by comparing with other components — sales, total assets, selling expenses, administration expenses and so on. Role of ratio analysis is vital, in such scenario. A financial ratio is computed by dividing one number (component/item) by another number. For a set of financial statements, a number of ratios can be computed. Only such ratio analysis can help give true meaning to the numbers in the Balance Sheet as well as income statements. The basic financial ratios help us to put numbers in perspective. By relating one part of the financial statements to another, they facilitate to answer a number of questions. In this chapter, important ratios, namely Liquidity Ratios, Solvency Ratios, Activity Ratios and Profitability Ratios are dealt with in analysis of financial statements.
OBJECTIVE 1: MEANING OF RATIO ANALYSIS–A SYSTEMATIC USE OF RATIOS TO INTERPRET THE PERFORMANCE OF ENTITIES
1.1 Meaning of Ratio and Ratio Analysis
A “Ratio” is described as arithmetical expression of relationship between two related items. Here, items represent the various components that constitute the financial statements. As these components have cause and effect relationship, arithmetical relationship between such components attains much significance. Accounting Ratios are nothing but ratios that are compared on the basis of accounting information provided by financial statements.
Ratio Analysis is a tool or technique employed to analyse the financial statements. Ratio Analysis is a process of interpreting relationship between the components (item) of financial statements thereby extending a meaningful information about business entities. Ratio Analysis is an accounting tool utilised in analysis, interpreting the various items in financial statements and reporting in understandable terms to its users. Myers explained it as, “Ratio Analysis is a study of relationship among various financial factors in a business”.
Ratio Analysis is a systematic use of ratios to interpret the financial statements in order to determine the performance and financial condition of the business enterprises. The term Accounting Ratios refers to the numerical relationship between two components/items/variables of the financial statements. This relationship can be expressed as
- Proportion say, for example the relationship between two variables – current assets and current liabilities (assuming current assets of Rs 1,50,000 and current liabilities of Rs 50,000). Current assets/Current liabilities
= Rs 1,50,000/Rs 50,000 = 3:1.
The relationship between two variables is expressed in the ratio form as 3:1 (proportion of numbers).
- The relationship can be expressed in terms of percentage say, net profits are 20 percent of sales (assuming net profit of Rs 20,000 and sales of Rs 1,00,000).
Net Profit/Sale× 100 = Rs 20,000/Rs 1,00,000×100 = 20%
(or)
- The same relationship can be expressed in fraction:
Net Profit is 1/5th of Sale = 20,000/1,00,000 =1/5 (or) 0.2
(or)
- The relationship can be expressed in “a number of times” – say the relationship between two items, net sales and current assets (assuming net sales of current assets turnover ratio) = Net Sales/Current Assets = 1,00,000/20,000 is expressed in “a number of times” as 5.
These alternative methods of expressing variables which are related to each other (interdependent) are referred to as Ratio Analysis. Such analysis facilitates to make better decisions on the overall performance of business organisations.
1.2 Ratio Analysis
The main objectives are:
- To judge the earning capacity of enterprises
- To ascertain the financial position (liquidity and solvency) and
- To determine the operating efficiency of business entities.
One would be able to understand broad objectives from the advantages of Ratio Analysis.
OBJECTIVE 2: ADVANTAGES AND USES OF RATIO ANALYSIS
1. Effective Tool in Analysis of Financial Statements: Final accounts of any enterprise is analysed by means of ratios, thereby all of them – bankers, investors, creditors etc.,are in a position to understand the financial position of such enterprises.
2. Easy and Simple in Application: These ratios summarise briefly the results of detailed and complicated accounting computation.
3. Liquidity Position: Ratios are an effective tool in assessing the firm‘s ability to meet its short-term obligations. Liquidity Ratios play an important role.
4. Long-term Solvency: Ratio Analysis is useful in analysing the long-term financial strengthness of a business entity. Profitability Ratio‘s role is significant in determining such capacity of a firm.
5. Judging Operating Efficiency: Activity Ratios are very useful in assessing the operating efficiency of a business concern. Sales revenue mobilised by effective utilisation of assets –is best ascertained by using Activity Ratios.
6. Tools for Forecasting: Ratios are very much useful in planning, execution and forecasting of any business related activities. Trend Ratios facilitate these tasks.
7. Overall Profitability: The management of any business enterprise is interested in the overall capability, i.e. (i) ability to meet its short-term and long-term needs to its creditors (ii) to ensure a reasonable return to its owners and (iii) to secure optimum and effective utilisation of the assets of the firm. All the ratios play an effective role in assessing the overall profitability of a concern.
8. Diagnosis and Remedial Measures: Even though the overall profitability is said to be normal, these ratios act effectively in spotting out the weak spots in the business components and suggesting measures to be taken to plug the loop-holes.
9. Intra-firm Comparison: The performance of different units belonging to the same business firm can be easily compared with Ratio Analysis. In an unit of the same firm, progress can be motivated and slackness can be averted by such intra-firm comparisons.
10. Inter-firm Comparison: Comparison of a firm‘s performance with other business firms is called inter-firm comparison. Such comparison exposes a firm‘s position against its competitors. Adverse results will help to rectify and modify its planning to achieve the desired results in the industry.
11. Trend Analysis: To sail among the other industries, to know the direction of movement, this trend analysis can render the necessary assistance.
OBJECTIVE 3: LIMITATIONS OF RATIO ANALYSIS
1. Results not Reliable: Reliability of ratio and its analysis depends on the correctness of financial statements. So the results obtained on the basis of any defective financial statements may also be not reliable.
2. Difficulty in Comparison: Various firms may adopt different procedures for the various activities of the enterprise. Differences may be due to
- Method of inventory valuation (First-In-First-Out (FIFO), Last-In-First-Out (LIFO) etc.)
- Method of computing depreciation (WDV, Straight Line)
- Working life of assets estimation
- Amortisation of intangible assets (goodwill, patents)
- Capitalisation of certain items
- Treatment of extraordinary items etc.
- Different accounting period, procedures
Due to such variations among the industries, comparisons may not be easy, reliable and accurate.
3. Price Level Changes: Frequent changes in price level will affect the compatibility of ratios. At times of inflation, such comparison will not yield the desired results.
4. Different Concepts: There are always different opinions about accounting concepts and computation techniques of various ratios. This conceptual diversity affects the effectiveness of Ratio Analysis. Different meanings and different approaches affect comparison.
5. Not Qualitative Analysis: As Accounting Ratios are tools of quantitative analysis, qualitative factors are ignored or over-rided.
6. Window Dressing: Manipulation of values are always in practice by concealing the real facts. Ratios are affected by window dressing of figures.
7. Not a Standard Yardstick: There is no standard ratio in practice to compare any of the components of business enterprise. It is difficult to evolve a common standard ratio, which is acceptable by all and at all times.
8. Insignificant Factors: Even if the figures of a business entity are not really significant, Accounting Ratios are computed. Such ratios may not be of much use for any financial analyst.
9. Personal Bias: While preparing financial statements, personal judgment plays a crucial role and as such these ratios are also not free from this limitation. So, such conclusions based on personal bias will be a standard one.
OBJECTIVE 4: CLASSIFICATION OF RATIOS OR TYPES OF RATIOS
Ratios may be classified as:
- Liquidity Ratios (Short-term solvency)
- Solvency Ratios
- Profitability Ratios
- Activity Ratios

OBJECTIVE 5: LIQUIDITY RATIOS
These ratios measure the short-term solvency of a concern. These ratios measure the firm‘s ability to pay off current dues (i.e., repayable in a year). In other words, liquidity means the ability to meet short-term obligations. (A liquid asset is one that can very easily be converted in to assets.) Liquidity Ratios may further be classified as:
- Current Ratio
- Liquid Ratio
- Absolute Liquid Ratio
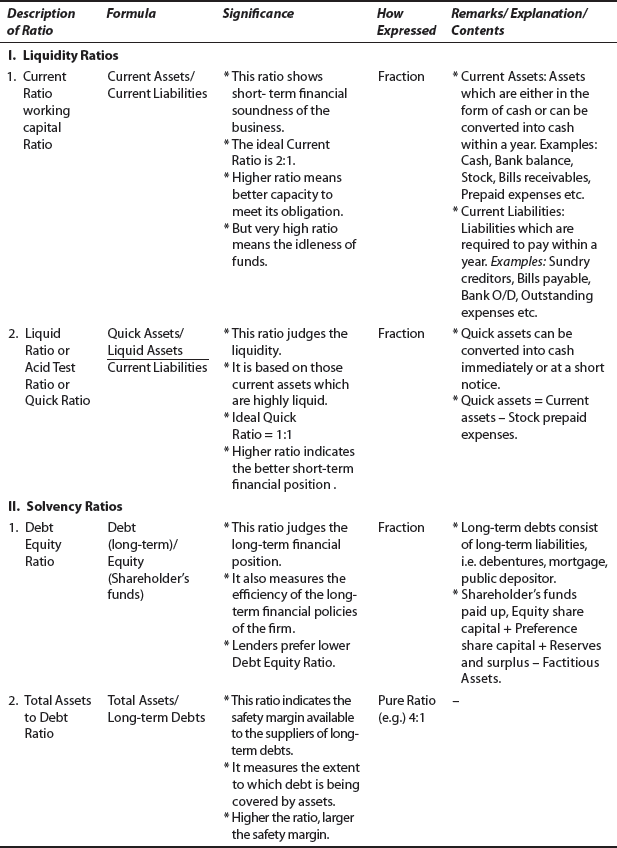
5.1 Current Ratio – Relationship of Current Assets to Current Liabilities
- The relationship of current assets to current liabilities is termed as “Current Ratio”.
- Short-term financial position is assessed by computing this ratio.
- Current Ratio serves also as an indicator to assess short-term obligations of a concern.
- This is calculated at a particular date and NOT for a particular PERIOD.
- The ratio is computed as: Current Ratio = Current Assets/Current Liabilities.
- Current Assets: The assets, which are in the form of cash or cash equivalents or can be converted into cash in a short time are current assets. These are
- Current Liabilities: Liabilities, which are repayable in short time. These are:
- Sundry creditors
- Bills payable
- Overdraft (Bank/Bills)
- Short-term loans
- Outstanding expenses
- Provision for Tax
- Unclaimed Dividend
- Any enterprise should have a reasonable Current Ratio, satisfactory level is 2:1. A higher ratio indicates poor investment policy, and a lower ratio reveals lack of liquidity and shortage of working capital.
- The excess of current assets over current liabilities is known as working capital.
Computation of Current Ratio
Illustration: 1
From the following, compute Current Ratio.
|
|
Rs |
|
Stock |
36,500 |
|
Sundry Debtors |
63,500 |
|
Cash-in-hand and Cash in Bank |
10,000 |
|
Bills Receivable |
9,000 |
|
Short-term Investments |
30,000 |
|
Prepaid Expenses |
1,000 |
|
Bank Overdraft |
20,000 |
|
Sundry Creditors |
25,000 |
|
Bills Payable |
16,000 |
|
Outstanding Expenses |
14,000 |
Solution
Step 1: |
Students have to classify and list out the Current Assets. They are: Stock, Sundry Debtors, Cash-in-hand/Bank, Bills Receivable, Short-term Investments, Prepaid Expenses. |
Step 2: |
Value of all these Current Assets have to be added and total value of Current Assets is calculated. |
Step 3: |
Now, Current Liabilities have to be sorted out. They are: Bank Overdraft, Sundry Creditors, Bills Payable and Outstanding Expenses. |
Step 4: |
Value of all these Current Liabilities have to be added together and total value of Current Liabilities is arrived at. |
Step 5: |
Current Assets/Current Liabilities = Current Ratio |
(a)Total value computed as in Step 2 and Step 4 to be taken into account.
|
Here, value of Current Assets |
= |
Rs 1,50,000 |
|
Current Liabilities |
= |
Rs 75,000 |
|
Current Ratio |
= |
Rs 1,50,000/Rs 75,000 |
|
|
= |
2:1 |
Step 6: |
Conclusion: Current Ratio is at normal level. |
Computation of Current Ratio from Balance Sheet
Illustration: 2
From this Balance Sheet of Prasadh and Co. Ltd, compute the Current Ratio.
Balance Sheet as on Mar 31, 2006

Solution
Step 1: |
Total value of all Current Assets have to be calculated first. |
Step 2: |
Here, if Balance Sheet is given, students have to pick up from the assets side, items belonging to current assets. |
Step 3: |
Here, except Fixed Assets, all the other items, that is, Stock, Debtors and Cash are Current Assets. Its total value = Rs 12,000 + Rs 7,500 + Rs 10,500 = Rs 30,000/- |
Step 4: |
Next step is to pick up the Current Liabilities alone from the Liabilities side of the Balance Sheet. Here Bank Overdraft and Creditors are Current Liabilities. Its total value = Rs 7000 +Rs 8000 = Rs 15,000 |
Step 5: |
Current Ratio: Current Assets/Current Liabilities |
Step 6: |
Conclusion: The Current Ratio is at normal level. |
Current Ratio from Working Capital
Illustration: 3
From the following, calculate the Current Ratio.
|
|
|
Rs |
|
Liquid Assets |
: |
40,000 |
|
Stock |
: |
30,000 |
|
Prepaid Expenses |
: |
10,000 |
|
Debtors |
: |
20,000 |
|
Working Capital |
: |
75,000 |
Solution
Here, working capital is given.
Step 1: So, students have to find out the value of Current Liabilities by using the formula:
(As Working Capital |
= |
Current Assets – Current Liabilities) |
Current Liabilities |
= |
Current Assets – Working Capital |
Value of Current Assets |
= |
Liquid Assets × Stock Debtors × Prepaid Expenses |
|
= |
Rs 40,000 × Rs 30,000 × Rs 20,000 × Rs 10,000 = Rs 1,00,000 |
= |
Current Assets — Working Capital |
|
|
= |
Rs 1,00,000−Rs 75,000 (given) |
|
= |
Rs 25,000 |
Step 3: Current Ratio |
= |
Current Assets/Current Liabilities |
|
= |
1,00,000/25,000 |
|
= |
4:1 |
Step 4: |
Conclusion: Current Ratio is at a higher level. It indicates poor investment policy of the concern, as huge amount of assets lie idle. |
Current Ratio from Capital Employed
Illustration: 4
A company has Total Assets of Rs 3,00,000, Fixed Assets: Rs 1,50,000, Capital Employed: Rs 2,70,000. Calculate the Current Ratio.
Solution
Step 1: Total assets and fixed assets are given. So Current Assets have to be worked out.
Current Assets |
= |
Total Assets − Fixed Assets |
|
= |
Rs 3,00,000 − Rs 1,50,000 |
|
= |
Rs 1,50,000 |
Step 2: From the value of capital employed and total assets, Current Liabilities have to be computed.
Current Liabilities |
= |
Total Assets − Capital Employed |
|
= |
Rs 3,00,000 − Rs 2,70,000 |
|
= |
Rs 30,000 |
Step 3: Current Ratio |
= |
Current Assets/Current Liabilities |
|
= |
1,50,000/30,000 |
|
= |
5:1 |
Step 4: Conclusion: Current Ratio is 5:1. It is above normal level.
Current Ratio from Debts
Illustration: 5
Calculate Current Ratio from the following:
|
|
Rs |
Working Capital |
: |
80,000 |
Total Debt |
: |
60,000 |
Long-term Debt |
: |
40,000 |
Solution
Step 1: Value of current liabilities is to be calculated first, if these datas alone are given.
Current Liabilities |
= |
Total Debt − Long-term Debt |
(i.e., Short-term Debt) |
||
|
= |
Rs 60,000 − Rs 40,000 |
|
= |
Rs 20,000 |
Step 2: Next step is to find the value of Current Assets.
Current Assets |
= |
Working Capital + Current Liabilities |
|
= |
Rs 80,000 + Rs 20,000 |
|
= |
Rs 1,00,000 |
= |
Current Assets/Current Liabilities |
|
|
= |
1,00,000/20,000 |
|
= |
5:1 |
Step 4: Current Ratio is at a higher level.
Treatment of Value of Goods Purchased
Illustration: 6
A company has Current Assets of Rs 2,50,000 and Current Liabilities Rs 1,50,000. Afterwards it purchased goods for Rs 50,000 on credit. Calculate Current Ratio after the purchase.
Solution
Note: Value of Current Assets and Current Liabilities, value of goods purchased are given.
* Value of goods purchased is on credit.
Important: So, it comes under both Current Assets and Current Liabilities.
* So, this value has to be added with liabilities and assets.
So Current Assets |
= |
Rs 2,50,000 + Rs 50,000 |
Current Liabilities |
= |
Rs 1,50,000 + Rs 50,000 |
Current Ratio |
= |
3,00,000/2,00,000 |
|
= |
3:2 |
Treatment of Creditors
Illustration: 7
Current Liabilities of a company are Rs 2,00,000/-, Current Ratio = 2.5:1. After this, it paid to X, a creditor of Rs 50,000. Calculate Current Ratio after payment to the creditor.
Solution
Step 1: |
Current Ratio and Current Liabilities are given. From this, Current Assets have to be calculated. |
Current Ratio |
= |
Current Assets/Current Liabilities |
Current Assets |
= |
Current Ratio × Current Liabilities |
|
= |
2.5 × Rs 2,00,000 |
|
= |
Rs 5,00,000 |
Step 2: |
Payment of Rs 50,000 is given to the creditor. This has to be adjusted on both Current Assets and Current Liabilities. |
So, after payment
Current Assets = Rs 5,00,000 − Rs 50,000 = Rs 4,50,000
Current Liabilities = Rs 2,00,000 − Rs 50,000 = Rs 1,50,000
Step 3: Current Ratio |
= |
4,50,000/1,50,000 |
|
= |
3:1 |
Treatment of Value of Current Assets
Illustration: 8
The ratio of Current Assets to Current Liabilities is 3:1, value being Rs 3,00,000 and Rs 1,00,000 respectively. The accountant of that firm is firm to maintain Current Ratio at 2:1 by acquiring Current Assets on credit being standard levels. You are required to assist him by suggesting the amount of Current Assets to be bought.
Step 1: Let the value of Current Assets to be required be = X (assumed)
Step 2: Current Ratio |
= |
Current Assets /Current Liabilities |
|
|
|
|
= |
(1,00,000 + X) 2 = (3,00,000 + X) 1 |
|
= |
2,00,000 + 2X = 3,00,000 + X |
2X − X |
= |
3,00,000 − 2,00,000 |
X |
= |
1,00,000 |
Current Assets to be acquired to maintain 2:1 Current Ratio = Rs 1,00,000.
5.2 Liquid Ratio or Quick Ratio or Acid Test Ratio
- Liquid Ratio is a relationship of liquid assets with current liabilities.
- This ratio is used to assess the firm‘s short-term liquidity. (Solvency)
- Liquid Assets = Current Assets – (Stock + Prepaid Expenses)
- This ratio is an indicator to assess the short-term debt paying capacity of a concern.
- This ratio is of high importance for Banks and other financial institutions.
- Liquid Ratio is computed as:
- Liquid Ratio = Liquid Assets/Current Liabilities
- Liquid Ratio of 1:1 is generally taken as a favourable one.
- A high Liquid Ratio indicates understocking.
- A low Liquid Ratio indicates overstocking.
Treatment of Liquid Assets
Illustration: 9
Calculate “Liquid Ratio” from the following:
|
|
Rs |
|
Current Liabilities |
80,000 |
|
Current Assets |
1,20,000 |
|
Stock |
30,000 |
|
Prepaid Expenses |
10,000 |
|
Sundry Debtors |
50,000 |
Solution
Step 1: First, Liquid Assets have to be calculated
-
Liquid Assets
=
Current Assets − (Stock + Prepaid Expenses)
=
Current Assets − (Stock + Prepaid Expenses)
=
Rs 1,20,000 − (Rs 30,000 + Rs 10,000)
=
Rs 1,20,000 − Rs 40,000
=
Rs 80,000
or
- It may also be deducted one by one from current assets, as
Current Assets – Stock – Prepaid Expenses. [Students may choose whichever is easier for them, either (i) or (ii).]
Step 2: Liquid Ratio |
= |
Liquid Assets/Current Liabilities |
|
= |
Rs 80,000/Rs 80,000 |
|
= |
1:1 |
Conclusion: Liquid Ratio is said to be at a normal and satisfactory level.
Computation of Current Ratio and Liquid Ratio
Illustration: 10
Sonali Ltd furnished the following information regarding its Current Assets and Current Liabilities:
|
Current Assets |
Rs |
|
Cash |
5,000 |
|
Sundry Debtors |
35,000 |
|
Bills Receivable |
10,000 |
|
Marketable Securities |
20,000 |
|
Prepaid Expenses |
8,000 |
|
Stock |
62,000 |
|
Total |
1,40,000 |
|
Current Liabilities |
|
|
Sundry Creditors |
40,000 |
|
Bills Payable |
25,000 |
|
Outstanding Expenses |
5,000 |
|
Total |
70,000 |
You are required to compute
- Current Ratio,
- Liquid Ratio,
- And as an accountant, pass your opinion on the result of these ratios.
Solution
Step 1: First Current Ratio is to be calculated.
Current Ratio |
= |
Current Assets/Current Liabilities |
|
= |
Rs l,40,000/Rs 70,000 = 2:1 |
Step 2: Liquid Ratio is to be calculated.
So, Liquid Assets have to be computed.
Liquid Assets |
= |
Current Assets − Stock − Prepaid Expenses |
|
= |
Rs 1,40,000 − Rs 62,000 − Rs 8,000 = Rs 70,000 |
Liquid Ratio |
= |
Liquid Assets/Current Liabilities |
|
= |
1:1 |
Opinion
- Current Ratio is 2:1 which is ideal one.
- Liquid Ratio is 1:1 which is also ideal.
So, the position of Sonali Ltd is said to be satisfactory and ideal, based on liquidity point of view.
Treatment of Value of Stock
Illustration: 11
Current Liabilities of a company: Rs 2,50,000
Current Ratio: 2:1
Liquid Ratio: 1:1
Compute the value of stock assuming there are no other current assets.
Step 1: First, value of Liquid Assets has to be calculated, as Liquid Ratio is given.
Liquid Ratio: 1:1 |
|
|
|
= |
Liquid Assets/Current Liabilities = 1/1 |
|
= |
Liquid Assets/Rs 2,50,000 = 1/1 |
| ∴ Liquid Assets | = |
Rs 2,50,000 |
Step 2: Value of Current Assets to be calculated, as Current Ratio is given.
Current Ratio |
= |
Current Assets/Current Liabilities = 2/1 |
|
= |
Current Assets/2,50,000 = 2/1 |
(Current Assets × 1) |
= |
(2 × 2,50,000) |
|
= |
Rs 5,00,000 |
Step 3: Value of stock is to be found out.
Value of Stock = Current Assets − Liquid Assets (Stock-in-trade)
Because, stock is the only current asset, as per the assumption given in the problem.
= Rs 5,00,000 – Rs 2,50,000
= Rs 2,50,000
Computation of Current Liabilities from Ratios
Illustration: 12
The Current Ratio of a company is 3:1 and Liquid Ratio is 1:1. Stock is Rs 5,00,000. Compute Current Liabilities.
Solution
Step 1: Since two various ratios are given, from that ratio, Current Liabilities is to be calculated.
Current Ratio |
= |
Current Assets/Current Liabilities |
|
= |
3/1 |
Liquid Ratio |
= |
Liquid Assets/Current Liabilities = 1/1 |
Current Assets − Liquid Assets |
= |
Stock |
3 − 1 |
= |
Stock |
2 |
= |
Stock |
Current Liabilities = 5,00,000/2 |
= |
Rs 2,50,000 |
Computation of Current Assets and Current Ratio
Illustration: 13
Total Current Liabilities of a company is Rs 3,00,000, Liquid Ratio is 4:1, Stock is Rs 3,00,000. Find the Current Assets and Current Ratio.
Solution
Step 1: Current Liabilities = Rs 3,00,000 (Given)
Liquid Ratio = 4:1 (Given)
Step 2: Liquid Ratio = Liquid Assets/Current Liabilities
= 4:1
That means Liquid Assets are 4 times as that of Current Liabilities
∴ Liquid Assets |
= |
4 × Rs 3,00,000 |
|
= |
Rs 12,00,000 |
= |
Liquid Assets + Stock |
|
|
= |
Rs 12,00,000 + Rs 3,00,000 |
|
= |
Rs 15,00,000 |
Step 4: Current Ratio |
= |
Current Assets/Current Liabilities |
|
= |
Rs l5,00,000/Rs 3,00,000 |
|
= |
5:1 |
Illustration: 14
Sharma Ltd has Liquid Ratio 2:1, stock is Rs 50,000. Total Current Liabilities is Rs 1,00,000. Compute Current Ratio.
Solution
Step 1: Liquid Ratio = 2:1 (Given)
Liquid Ratio = Liquid Assets/Current Liabilities = 2/1
This means that the value of Liquid Assets is twice as that of Current Liabilities.
Liquid Assets |
= |
2 – Rs 1,00,000 |
|
= |
Rs 2,00,000 |
Step 2: Value of Current Assets has to be calculated.
Current Assets |
= |
Liquid Assets + Stock |
|
= |
Rs 2,00,000 + Rs 50,000 |
|
= |
Rs 2,50,000 |
Step 3: Current Ratio |
= |
Current Assets/Current Liabilities |
|
= |
Rs 2,50,000/Rs 1,00,000 |
|
= |
2.5:1 |
Computation of Value of Stock
Illustration: 15
Liquid Ratio: 2:1; Current Assets: Rs 2,50,000; Current Liabilities: Rs 60,000. Compute the value of stock.
Solution
Step 1: Liquid Ratio = 2:1 (Given)
Liquid Ratio |
= |
Liquid Assets/Current Liabilities = 2/1 |
Liquid Assets |
= |
Current Liabilities × 2 |
|
= |
Rs 60,000 × 2 |
|
= |
Rs 1,20,000 |
Step 2: Value of stock |
= |
Current Assets − Liquid Assets |
|
= |
Rs 2,50,000 − Rs 1,20,000 |
|
= |
Rs 1,30,000 |
Relationship of Working Capital with Current Ratio and Liquid Ratio
Illustration: 16
Working capital of a limited company is Rs 1,20,000. Current Ratio is 3:1, Stock is Rs 60,000. Compute (a) Current Liabilities (b) Current Assets (c) Liquid Ratio
Solution
From Working Capital and Current Ratio, other values are computed as follows:
Step 1: Working Capital = Current Assets – Current Liabilities
Rs 1,20,000 = Current Assets − Current Liabilities
Step 2: Current Ratio = Current Assets/Current Liabilities = 3/1
Step 3: Assume Current Liabilities = X
Then, Current Assets = 3 × X (as ratio is = 3:1)
Step 4: Go to first step,
i.e., Current Assets – Current Liabilities |
= |
1,20,000 |
3X – X |
= |
1,20,000 |
2X |
= |
1,20,000 |
X |
= |
Rs 60,000 (Current Liabilities) |
Step 5: Current Assets |
= |
Rs 60,000 × 3 |
|
= |
Rs 1,80,000 |
Step 6: Liquid Assets |
= |
Current Assets − Stock |
|
= |
Rs 1,80,000 − Rs 60,000 |
|
= |
Rs 1,20,000 |
Step 7: Liquid Ratio |
= |
Liquid Assets/Current Liabilities |
|
= |
1,20,000/60,000 = 2/1 |
|
= |
2:1 |
5.3 Absolute Liquid Ratio – Relationship of Absolute Liquid Assets to Liquid Liabilities
The relationship of absolute liquid assets to liquid liabilities is termed as “Absolute Liquid Ratio”. It is calculated as:
Absolute Liquid Ratio = Absolute Liquid Assets/Liquid Liabilities
Absolute Liquid Assets = Cash, Bank and Short-term Investments.
Liquid Liabilities = Current Liabilities – Bank overdraft. Satisfactory level of ratio is 1:1.
Computation of Absolute Liquid Ratio
Illustration: 17
A limited company has Current Liabilities of Rs 1,00,000. It has Cash-in- hand Rs 5,000, Cash at Bank Rs 45,000, Short-term Investments Rs 50,000. Further Bank Overdraft is Rs 25,000. Compute Absolute Liquid Ratio.
Solution
Step 1: First, value of absolute Liquid Assets has to be calculated.
Absolute Liquid Assets |
= |
Cash + Bank + Short-term Investment |
|
= |
Rs 5,000 + Rs 45,000 + Rs 50,000 |
|
= |
Rs 1,00,000 |
Step 2: Value of Liquid Liabilities has to be calculated, now.
Liquid Liabilities |
= |
Current Liabilities − Bank Overdraft |
|
= |
Rs 1,00,000 − Rs 25,000 |
|
= |
Rs 75,000 |
Step 3: Absolute Liquid Ratio |
= |
Absolute Liquid Assets/Liquid Liabilities |
|
= |
Rs 1,00,000/Rs 75,000 |
|
= |
1 : 0.75 |
OBJECTIVE 6: SOLVENCY RATIOS (LONG-TERM SOLVENCY)
- Solvency Ratios deals with entity’s ability to meet its long-term obligations.
- Solvency refers to the firm’s ability to meet its long-term indebtedness.
- The following are important Solvency Ratios:
- Debt Equity Ratio
- Total Assets to Debt Ratio
- Proprietary Ratio
6.1 Debt Equity Ratio
6.1.1 Debt Equity Ratio – Relationship between Debt and Equity
- This ratio is computed to ascertain the soundness of the long-term financial position of the concern.
- This ratio indicates the proportion between debt (external equities) and the equity (internal equities).
- Debt Long-term loans: Debentures, long-term loans from Banks and financial institutions. Equity: Shareholder’s funds: Equity Share capital, Preference share capital, Reserves and surplus loss, Losses and fictitious assets (e.g.: Preliminary expenses).
- This ratio is calculated as:
Debt Equity Ratio = Debt (Long-term Loans)/Equity (Shareholder’s Funds)
- If it is 2:1, then the concern is said to be at a satisfactory level.
- A higher ratio than this normal level, i.e. 2:1 then the concern is facing a risky financial position, where as a lower ratio indicates safer financial position.
- It also indicates the extent to which the concern depends upon outsiders for its existence.
Computation of Debt Equity Ratio
Illustration: 18
From the following, compute Debt Equity Ratio:
|
Equity Share Capital |
1,00,000 |
|
General Reserve |
80,000 |
|
6¼% Debentures |
75,000 |
|
Current Liabilities |
90,000 |
|
Preliminary Expenses |
30,000 |
Solution
Debt Equity Ratio = Debt/Equity
Step 1: Debt = Rs 75,000
(∴ Debentures only here)
Step 2: Equity |
= |
Equity Share Capital + General Reserve − Preliminary Expenses |
|
= |
Rs 1,00,000 + 80,000 − Rs 30,000 |
|
= |
Rs 1,50,000 |
Step 3: Debt Equity Ratio |
= |
Rs 75,000/Rs 1,50,000 |
|
= |
1:2 |
6.2 Total Assets to Debt Ratio
6.2.1 Total Assets to Debts Ratio – Relationship between Total Assets and Debt
The components of this ratio:
(i) Total Assets and (ii) Debt
- Total Assets: This include both Fixed and Current Assets. But this does not include fictitious assets as preliminary expenses, underwriting commission discount on issue of shares/debentures etc. and debit balance of Profit and Loss A/c.
- Debts: Long-term debts, which usually gets matured after 1 year. This includes bonds, debentures and other loans from financial institution.
- Total Assets to Debt Ratio = Total Assets/Long-term Debts
- Normal level is said to be at 2:1 ratio.
- A higher ratio indicates higher security to lenders.
- A low ratio indicates a risky financial position.
Computation of Total Assets to Debt Ratio
Illustration 19
Following is the Balance Sheet of a company as on Mar 31, 2006:

You are required to compute Total Assets to Debt Ratio.
Solution
Step 1: Total Assets = Rs 5,00,000
Step 2: Debt (Long term) = Rs 2,00,000 (Debentures only)
Step 3: Total Assets to Debt Ratio |
= |
Total Assets/Long-term Debt |
|
= |
Rs 5,00,000/Rs 2,00,000 |
|
= |
5:2 |
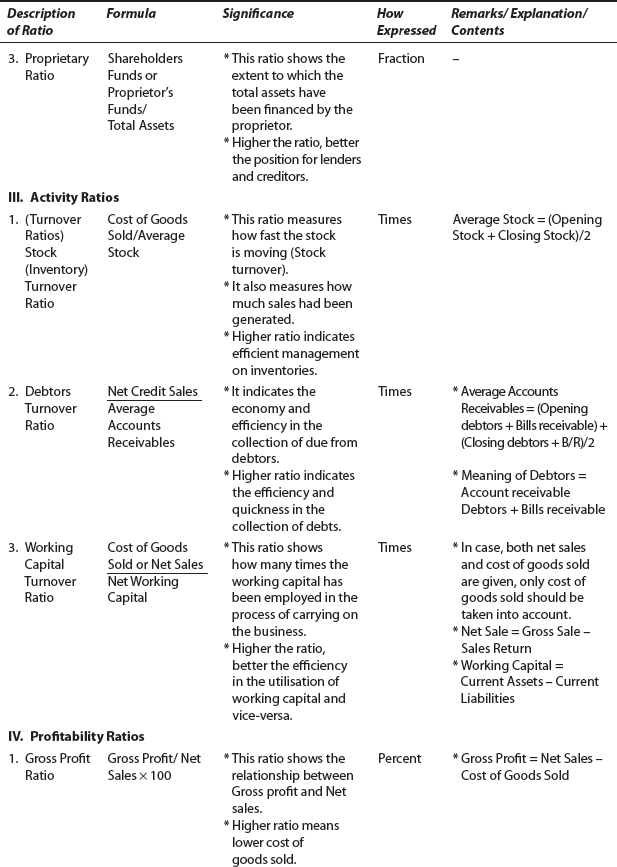
6.3 Proprietary Ratio
6.3.1 Proprietary Ratio – Relationship between Proprietor’s Funds and Total Assets
- This ratio establishes the relationship between Proprietor’s funds and total tangible assets.
- This ratio reflects the general financial position of a concern.
- This is computed as:
Proprietor’s Funds Proprietary Ratio = (Shareholder’s Fund)/Total Assets
- Proprietor’s Funds: Share capital, Reserves and surplus (loss to be deducted, payment to others not included)
- Tangible Assets: Good will, Preliminary expenses etc.
- Normal level = 100
- A high level indicates safety to creditors.
- A low (usually < 50) level assets the (investors) creditors.
From the following, calculate Proprietary Ratio:
| Rs | |
|---|---|
Equity Share Capital |
1,00,000 |
reference Share Capital |
30,000 |
Reserves and Surplus |
20,000 |
Debentures |
2,00,000 |
Sundry Creditors |
50,000 |
|
3,00,000 |
Fixed Assets |
2,00,000 |
Current Assets |
30,000 |
Investments |
70,000 |
|
3,00,000 |
Solution
- Shareholder’s Funds: Rs 1,00,000 + Rs 30,000 + Rs 20,000= Rs 1,50,000 (excluding debentures and creditors)
- Total Assets = Rs 3,00,000
- Proprietary Ratio = Rs l,50,000/Rs 3,00,000 = 1/2 = 0.5 or 5:1 (or) 0.5 × 100 = 50%
Computation of Proprietary Ratio from Balance Sheet
Illustration: 21
Balance Sheet of Dabar Ltd as on Mar 31, 2006 is given. From this, compute (a) Debt Equity Ratio, (b) Proprietary Ratio and (c) Total Assets to Debt Ratio

Solution
(a) Value of Debentures = Rs 5,00,000 |
||
Shareholder’s Funds (Equity) |
= |
Equity Share Capital + General Reserve |
|
= |
Rs 12,00,000 + Rs 8,00,000 (Debentures) |
Debt Equity Ratio |
= |
Long-term Debts/Shareholder’s Funds |
|
= |
Rs 5,00,000/Rs 20,00,000=0.25:1 |
(b) Proprietary Ratio |
= |
Shareholder’s Funds/Total Assets |
|
= |
Rs 20,00,000/Rs 40,00,000 = 0.5:1 or 0.5% = 50% |
(c) Total Assets to Debt Ratio |
= |
Total Assets/Long-term Debt |
|
= |
Rs 40,00,000/Rs 5,00,000 |
|
= |
8:1 |
OBJECTIVE 7: PROFITABILITY RATIOS
- Efficiency of a concern is measured by profitability.
- Profit as compared to the capital employed indicates profitability of a concern.
- Some important Profitability Ratios are: Gross Profit Ratio, Net Profit Ratio, Operating Profit Ratio and Operating Ratio.
7.1 Gross Profit Ratio
7.1.1 Gross Profit Ratio – Relationship of Gross Profit to Sales
- The relationship of gross profit to sales is termed as Gross Profit Ratio.
- This ratio is calculated as:
Gross Profit Ratio = Gross Profit/Net Sales × 100
- Gross Profit is taken from Trading Account of an enterprise.
Gross Profit
=
Sales − Cost of Goods Sold
Cost of Goods Sold
=
Opening Stock × Purchases − Closing Stock (or)
=
Sales − Gross Profit
Net Sales
=
Gross Sales (Cash Sale × Credit Sale) − Sales Returns
- This ratio is a good indicator to maintain the correct selling price and efficiency of trading activities.
- It may also be compared to previous years, which will assist the management to take vital policies.
Illustration: 22
From the following, calculate Gross Profit Ratio.
|
|
Rs |
|
Cash Sales |
50,000 |
|
Credit Sales |
60,000 |
|
Sales Return |
10,000 |
|
Gross Profit |
50,000 |
Solution
Step 1: Value of Net Sales to be computed.
Net Sales |
= |
Cash Sale + Credit Sale − Sales Return |
|
= |
Rs 50,000 + Rs 60,000 − Rs 10,000 |
|
= |
Rs 1,00,000 |
Step 2: Gross Profit = Rs 50,000 (Given)
Step 3: Gross Profit Ratio |
= |
Gross Profit/Net Sales × 100 |
|
= |
Rs 50,000/ Rs l,00,000 × 100 = 50% |
Illustration: 23
From the following data, compute Gross Profit Ratio.
| 2008 Rs | 2009 Rs | |
|---|---|---|
Sales |
2,00,000 |
2,40,000 |
Gross Profit |
50,000 |
80,000 |
Gross Profit Ratio = Gross Profit/Net Sales × 100 |
|
Year |
Year |
2008 |
2009 |
Gross Profit Ratio = Rs 50,000/Rs 2,00,000 × 100 |
= Rs 20,000/Rs 2,40,000 × 100 |
= 25% → |
= 33 1/3% |
Conclusion = Profit rose from 25% to 33 1/3% this year. |
|
Treatment of Cost of Goods Sold and Gross Profit (G.P.)
Illustration: 24
Sales of a company is Rs 7,20,000.
Gross Profit is 20% on cost. Compute Gross Profit Ratio.
Solution
Step 1: Cost of goods sold has to be calculated as:
Let the cost be |
= |
Rs 100 |
Then Sales |
= |
Rs 120 (100 + 20%) |
Cost of Goods Sold |
= |
100/120 × Rs 7,20,000 |
|
= |
Rs 6,00,000 |
Step 2: Next, Gross Profit has to be calculated.
Gross Profit |
= |
Sales − Cost of Goods Sold |
|
= |
Rs 7,20,000 − Rs 6,00,000 |
|
= |
Rs 1,20,000 |
Step 3: Gross Profit Ratio |
= |
Gross Profit/Net Sales × 100 |
|
= |
Rs 1,20,000/Rs 7,20,000 × 100 |
|
= |
16.66% |
7.2 Net Profit Ratio
7.1.2 Net Profit Ratio – The Relations hip of Net Profit to Net Sales
- The relationship of Net Profit to Net Sales is termed as “Net Profit Ratio”.
- Net Profit Ratio is calculated as
Net Profit Ratio = Net Profit/Net Sales ×100
- This ratio reflects the overall efficiency of a concern.
- This ratio also helps to determine operational efficiency of an enterprise.
- Higher the Net Profit Ratio, better the efficiency of a concern.
- At times, Net Profit Ratio is calculated either Profit Before Tax (P.B.T.) (or) Profit After Tax (P.A.T.), then Net Profit Ratios will be
P.B.T./Net Sales × 100 (or) P.A.T./Net Sales×100
- Net Profit is taken from P and L Account or to Gross profit less administration expenses, selling and distribution expenses, financial expenses, non-operating expenses and adding non-operating incomes.
Computation of Net Profit Ratio
Illustration: 25
Compute Net Profit Ratio from these.
Net Profit = Rs 75,000
Sales = Rs 3,00,000
Net Profit Ratio= Net Profit/Net Sales × 100
Illustration: 26
Gross Profit Ratio of a company is 20%. Its cash sales are Rs 5,00,000 and its credit sales are 80% of total sales. The indirect expenses are Rs 50,000. Calculate Net Profit Ratio.
Solution
Step 1: Total sales have to be computed.
Total Sales |
= |
Cash Sales + Credit Sales |
|
= |
Rs 5,00,000 + 80% of Total Sales |
| This means cash sales = 20% (100% − 80%) of Total Sales | ||
∴ Total Sales |
= |
Cash Sales ×100/20 |
|
= |
Rs 5,00,000 × 100/20 |
|
= |
Rs 25,00,000 |
Step 2: Next, value of Gross Profit is to be computed.
Gross Profit |
= |
Rs 25,00,000 × 20/100 |
|
= |
Rs 5,00,000 |
Step 3: Value of Net Profit is to be computed.
Net Profit |
= |
Gross Profit − Indirect Expenses |
|
= |
Rs 5,00,000 − Rs 50,000 |
|
= |
Rs 4,50,000 |
Step 4: Net Profit Ratio |
= |
Net Profit/Net Sales × 100 |
|
= |
Rs 4,50,000/Rs 25,00,000 × 100 |
|
= |
18% |
7.3 Operating Profit Ratio
7.3.1 Operating Profit Ratio – Relationship between Operating Profit and Net Sales
- This ratio measures the relationship between operating profit and net sales.
- This ratio helps in determining the operational efficiency of an enterprise.
- This ratio is calculated as:
Operating Profit Ratio = Operating Profit/Net Sales × 100
- Operating Profit = Net Profit+ Non-operating Expenses –Non-operating Income
Non-operating Expenses = Interest on Loan and Loss on sale of assets
Non-operating Income = Dividend, Interest received and Profit on sale of asset
Or - Operating Profit = Gross Profit –Operating Expenses
- Net Sales = Gross Sales = Cash Sales + Credit Sales – Sales Revenue
Computation of Operating Profit Ratio
Illustration: 27
Compute Operating Profit Ratio from the following:
|
|
Rs |
|
Net Profit |
6,00,000 |
|
Loss on Sale of Furniture |
20,000 |
|
Profit on Sale of Investments |
60,000 |
|
Rs |
|
|
Interest paid on Loan |
60,000 |
|
Interest from Investment |
40,000 |
|
Sales |
11,60,000 |
Solution
Step 1: Non-operating expenses have to be calculated.
Non-operating Expenses |
= |
Interest on Loan + Loss on Sale of Furniture |
|
= |
Rs 60,000 + Rs 20,000 |
|
= |
Rs 80,000 |
Step 2: Non-operating income to be computed.
Non-operating Income |
= |
Interest received from Investments + Profit on Sale of Investment |
|
= |
Rs 40,000 + Rs 60,000 |
|
= |
Rs 1,00,000 |
Step 3: Operating profit is to be computed.
Operating Profit |
= |
Net Profit + Non-operating Expenses − Non-operating Income |
|
= |
Rs 6,00,000 + 80,000 − 1,00,000 |
|
= |
Rs 5,80,000 |
Step 4: Operating Profit Ratio |
= |
Operating Profit/Net Sales × 100 |
|
= |
5,80,000/11,60,000 × 100 |
|
= |
50% |
Treatment of G.P. with Sales
Illustration: 28
Calculate Operating Profit Ratio if
Case (a) Net sales Rs 10,00,000, Gross profit 20%on Sales and Operating expenses Rs 20,000
Case (b) Net sales Rs 6,00,000, Gross profit 20% on Sales and Operating expenses Rs 20,000
Solution
Case (a): Operating Profit |
= |
Gross Profit—Operating Cost |
|
= |
Rs 2,00,000−Rs 20,000 |
|
= |
Rs 1,80,000 |
| Operating Profit Ratio | = |
Operating Profit/Net Sales × 100 |
|
= |
Rs 1,80,000/Rs 10,00,000 × 100 = 18% |
Case (b): Operating Profit |
= |
Gross Profit—Operating Expenses |
Gross Profit |
= |
20% of Sales |
|
= |
20/100 × Rs 6,00,000 |
|
= |
Rs 1,20,000 |
∴ Operating Profit |
= |
Rs 1,20,000−Rs 20,000 |
|
= |
Rs 1,00,000 |
Operating Profit Ratio |
= |
Operating Profit/Net Sales × 100 |
|
= |
Rs 1,00,000/Rs 6,00, 000 × 100 = 16.66% |
7.4 Operating Ratio
7.4.1 Operating Ratio – Relationship between Operating Cost and Net Sales
- This ratio establishes relationship between operating cost and net sales.
- This measures the operating efficiency of the enterprise.
- This ratio measures the amount of expenditure incurred in production, sales and distribution of output.
- Operating Ratio = Cost of Goods Sold + Operating Expenses/Net Sales × 100
or
Operating Ratio = Operating Cost/Net Sales × 100
- Cost of Goods Sold =Opening Stock + Purchases + Direct Expenses + Manufacturing Expenses – Closing Stock (or) Sales – Gross Profit
- Operating Expenses = Administrative Expenses + Selling and Distribution Expenses
- Operating Ratio and Net Profit Ratio are interrelated.
Operating Ratio + Net Profit Ratio = 100
Example: |
20% + 80% = 100 |
|
|
|
or |
|
40% + 60% = 100 |
|
|
|
or |
|
70% + 30% = 100 |
|
- Higher Operating Ratio indicates poor performance, so lower the better.
- It is an indicator to determine the cost content, and which element of cost has gone up.
Computation of Operating Ratio
Illustration: 29
From the following, compute Operating Ratio:
|
|
Rs |
|
Cost of Goods Sold |
4,50,000 |
|
Operating Expenses |
50,000 |
|
Sales |
10,60,000 |
|
Sales Returns |
60,000 |
Solution
Step 1: Add Cost of Goods Sold and Operating Expenses
= Rs 4,50,000 + Rs 50,000
= Rs 5,00,000
Step 2: Value of Net Sales has to be calculated.
Net Sales |
= |
Sales — Sales Return |
|
= |
Rs 10,60,000 − Rs 60,000 |
|
= |
Rs 10,00,000 |
Step 3: Operating Ratio is to be found out.
Operating Ratio |
= |
Cost of Goods Sold + Operating Expenses/Net Sales × 100 |
|
= |
Rs 5,00,000/Rs l0,00,000 × 100 |
|
= |
50% |
OBJECTIVE 8: ACTIVITY RATIOS
- Activity Ratios measure the effectiveness of entities.
- These ratios are also called as “Performance or Turnover Ratios”.
- These ratios measures the effectiveness of a business concern.
- It can also be known how effectively a concern utilises its resources, by using these ratios.
- The following are some important Activity Ratios:
8.1 Inventory Turnover Ratio
8.1.1 Inventory Turnover Ratio – Relationship between the Cost of Goods Sold and Average Inventory
- This ratio establishes relationship between the cost of goods sold (during a given period) and the average amount of inventory carried (during that period).
- This indicates whether stock has been efficiently used or not.
- The ratio is calculated as follows:
Inventory or Stock Turnover Ratio
= Cost of Goods Sold/Average Inventory (or) Stock
- Cost of Goods Sold = Opening Stock + Purchase + Direct Expenses – (Less) Closing Stock
or
Cost of Goods Sold =Sales– Gross Profit
Average Stock = (Opening Stock + Closing Stock)/2
Note: If information to calculate average stock is not given in the problem then students are expected to take the closing stock as average stock.
- Higher ratio indicates the unit functions on a comparatively low margin of profit. More sales are on with (that unit of investment in stocks) a rupee of investment in stocks.
- This ratio also helps to invest minimum in stock.
- It helps business enterprises to earn a reasonable margin of profits.
Computation of Inventory Turnover Ratio
Illustration: 30
From the following, compute Inventory Turnover Ratio.
|
|
Rs |
|
Cost of Sales |
9,00,000 |
|
Stock at the beginning of the year |
2,50,000 |
|
Stock at the end of the year |
3,50,000 |
Solution
Step 1: First, average stock is to be calculated.
Average Stock

Step 2: Cost of Goods Sold = Cost of Sales = Rs 9,00,000
Step 3: Inventory Turnover Ratio = Rs 9,00,000/Rs 3,00,000 = 3 times
Computation of Stock Turnover Ratio from Trading A/c
Illustration: 31
Following is the Trading A/c of Jam Ltd. Compute Inventory Turnover Ratio.
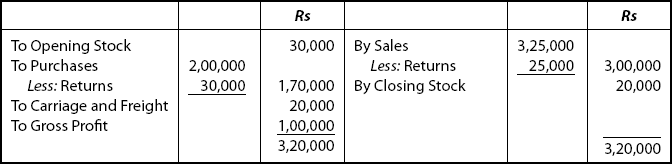
Solution
Step 1: Cost of goods sold has to be calculated.
Cost of Goods Sold |
= |
Sales — Gross Profit |
|
= |
Rs 3,00,000 − Rs 1,00,000 |
|
= |
Rs 2,00,000 |
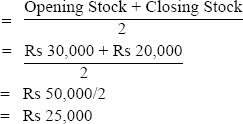
Step 2: Average stock is to be calculated.
Average Stock
Step 3: Stock Turnover Ratio |
= |
Cost of Goods Sold/Average Stock |
|
= |
Rs 2,00,000/Rs 25,000 = 8 times |
Treatment of Cost of Sales
Illustration: 32
From the following, calculate Stock Turnover Ratio.
Total Sales: Rs 10,00,000, Opening Stock: Rs 2,20,000 and Closing Stock: Rs 1,80,000.
Loss Ratio = 20%.
Solution
Step 1: From Sales, Cost of Sales is to be computed.
Sales = Rs 10,00,000
Gross Loss: 20%
20% of Sales (10,00,000) = Rs 2,00,000
∴ Cost of Sales |
= |
Sales + Gross Loss |
|
= |
Rs 10,00,000 + Rs 2,00,000 |
|
= |
Rs 12,00,000 |
Step 2: Average Stock has to be calculated.
Average Stock

Step 3: Inventory Turnover Ratio |
= |
Cost of Sales/Average Stock |
|
= |
Rs 12,00,000/Rs 2,00,000 = 6 times |
From the following, calculate Inventory Turnover Ratio.
|
Rs |
Opening Stock |
1,00,000 |
Purchases |
3,50,000 |
Sales |
5,00,000 |
Gross Profit Ratio |
20% on Sales |
Solution
Step 1: First, cost of sales has to be computed.
Cost of Sales |
= |
Sales − Gross Profit |
|
= |
Rs 5,00,000 − (20% of 5,00,000) |
|
= |
Rs 5,00,000 − Rs 1,00,000 |
|
= |
Rs 4,00,000 |
Step 2: Value of Closing Stock has to be calculated.
Closing Stock |
= |
Opening Stock + Purchases + Gross Profit − Sales |
|
= |
Rs 1,00,000 + Rs 3,50,000 + Rs 1,00,000 − Rs 5,00,000 |
|
= |
Rs 5,50,000 − Rs 5,00,000 |
|
= |
Rs 50,000 |
Step 3: Value of Average Stock

Step 4: Inventory Turnover Ratio |
= |
Cost of Goods Sold/Average Stock |
|
= |
Rs 4,00,000/Rs 75,000 |
|
= |
5.33 times |
8.2 Debtors Turnover Ratio or Receivables Turnover Ratio
8.2.1 Debtors Turnover Ratio –Relationship between Net Credit Sales and Average Debtors
- This ratio indicates the relationship between net credit sales and average debtors or receivables in a year.
- This ratio is calculated as:
Debtors Turnover Ratio = Net Credit Sales/Average Accounts Receivable
- Accounts Receivable includes “Trade Debtors” and “Bills Receivables”.
- Average Debtors

- Doubtful debts are not deducted from total debtors.
- If details regarding opening and closing receivables and credit sales are not given in the problem, the Debtors Turnover Ratio =Total Sales/Accounts Receivable
- This ratio is calculated to determine the number of times the receivables are turned over in a period in relation to sales.
- It indicates how quickly debtors are converted into cash.
- A high ratio indicates the quickness of debts collected. Lower ratio would mean otherwise.
Debtors Turnover Ratio — Computation
Illustration: 34
The following data are taken from Shah Ltd.
|
Rs |
Total Sales for the year 2009 |
4,00,000 |
Cash Sales for the year 2009 |
1,00,000 |
Debtors as on Jan 1, 2009 |
45,000 |
Debtors as on Dec 31, 2009 |
55,000 |
Compute Debtors Turnover Ratio.
Solution
Step 1: First, Credit Sales have to be calculated.
Credit Sales |
= |
Total Sales − Cash Sales |
|
= |
Rs 4,00,000 − Rs 1,00,000 |
|
= |
Rs 3,00,000 |
Step 2: Next, average debtors have to be computed.
Average Debtors
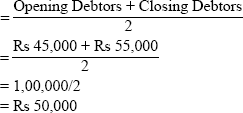
Step 3: Finally,
Debtors Turnover Ratio |
= |
Credit Sales/Average Debtors |
|
= |
Rs 3,00,000/Rs 50,000 = 6 times |
8.3 Working Capital Turnover Ratio
8.3.1 Working Capital Turnover Ratio – Relationship between Sales and Working Capital
- This ratio indicates the efficiency of working capital of a concern.
- This also indicates if there is over trading.
- This ratio is calculated as:
- Working Capital Turnover Ratio = Sales/Working Capital
Working Capital = Current Assets − Current Liabilities
- This ratio is better than Stock Turnover Ratio.
- It measures the rate of working capital utilisation.
Illustration: 35
Compute Working Capital Turnover Ratio.
|
Rs |
Cost of Goods Sold |
2,80,000 |
Current Assets |
2,05,000 |
Current Liabilities |
1,65,000 |
Solution
First, working capital is to be calculated.
Working Capital |
= |
Current Assets — Current Liabilities |
|
= |
Rs 2,05,000 − Rs 1,65,000 |
|
= |
Rs 40,000 |
Note: As no sales figures are given, ratio is to be calculated on the basis of cost of sales.
So Working Capital Turnover Ratio |
= |
Cost of Sales/Net Working Capital |
|
= |
Rs 2,80,000/Rs 40,000 |
|
= |
7 times |
Computation of Working Capital Turnover Ratio from Balance Sheet
Illustration: 36
Following is the Balance Sheet of Chopra Ltd. Compute Working Capital Turnover Ratio.

Further Information
- Total Sales during the year = Rs 46,00,000
- Sales Returns during the year = Rs 6,00,000
Solution
Step 1: First, Net Sales (or) turnover is to be computed.
Net Sales |
= |
Total Sales − Sales Return |
|
= |
Rs 46,00,000 − Rs 6,00,00 |
|
= |
Rs 40,00,000 |
Step 2: Next, Current Assets have to be added.
Current Assets |
= |
Short-term Investment + Stock + Debtors + Bills Receivable + Cash at Bank + Cash-in-hand |
Current Assets |
= |
Rs 2,30,000 + Rs 1,80,000 + Rs 2,20,000 + Rs 1,10,000 + Rs 60,000 + Rs 1,00,000 |
|
= |
Rs 9,00,000 |
Step 3: Next, Current Liabilities should be added together.
Current Liabilities |
= |
Creditors + Bills Payable + Provision for Income Tax |
|
= |
Rs 2,80,000 + Rs 80,000 + Rs 40,000 |
|
= |
Rs 4,00,000 |
Step 4: Working Capital |
= |
Current Assets — Current Liabilities |
|
= |
Rs 9,00,000 − Rs 4,00,000 |
|
= |
Rs 5,00,000 |
Step 5: Finally,
Working Capital Turnover Ratio |
= |
Net Sales/Working Capital |
|
= |
Rs 40,00,000/Rs 5,00, 000 |
|
= |
8 times |

Notes
* Both Operating Profit Ratio and Operating Ratio are complementary to each other.
* If one such ratio is deducted from 100, the other ratio can easily be obtained.
* Post-mortem Analysis: Ratio Analysis is based on past records, i.e. what happened on a particular date. Nothing is revealed in the interim period. No facts about the future is disclosed.
* Not conclusive result: A single ratio cannot be relied upon to take decisive action. Inter-related and overall analysis of all the concerned ratios can only yield the desired result to some extent. Ratios obtained by a single ratio analysis is not reliable and conclusive.
OBJECTIVE 9: RATIOS: ADVANCED LEVEL
9.1 Turnover Ratio
The ratios to determine how quickly certain current assets are converted into cash are termed as Turnover Ratios.
Some important Turnover Ratios are:
- Inventory Turnover Ratio
- Debtors Turnover Ratio
- Creditors Turnover Ratio
9.1.1 Inventory Turnover Ratio
Formula = Inventory Turnover Ratio = Cost of Goods Sold/Average Inventory
Remember
Cost of Goods Sold = Sales – Gross Profit
Average Inventory
This ratio is expressed by………times.
High ratio indicates status of liquidity of a concern.
Low ratio indicates that the inventory stays for a long time in the warehouse, which is not advisable.
Computation of Inventory Turnover Ratio
Illustration: 37
A firm has sold goods worth Rs 4,00,000 with a gross profit margin of 25%. The stock at the beginning and at the end of the period are Rs 45,000 and Rs 55,000 respectively. Compute the Inventory Turnover Ratio.
Solution
Step 1: Cost of Goods Sold = Sales – Gross Profit
Sales |
= |
Rs 4,00,000 (Given) |
Gross Profit (G.P.) |
= |
25% of Rs 4,00,000 |
|
= |
Rs 1,00,000 (Profit) |
|
= |
(Rs 4,00,000 – Rs 1,00, 000) = Rs 3,00,000 |
Step 2: Average Inventory = (Rs 45,000 + Rs 55,000)/2→(Stock in the beginning + Stock at the end)/2
Step 3: Inventory Turnover Ratio = Rs 3,00,000/Rs 50,000 =6 times
Step 4: Inventory Holding Period = 12 Months/Inventory Turnover Ratio
= 12/6 = 2 months
9.1.2 Debtors Turnover Ratio
Formula
Debtors Turnover Ratio |
= |
Net Credit Sales/Average Debtors |
Net Credit Sales |
= |
Gross Credit Sales – Sales Returns |
Average Debtors |
= |
|
Note: Debtors include Bills Receivable.
High ratio indicates short time lag between credit sales and cash collection. A low ratio shows the slackness in debt recovery.
Computation of Debtors Turnover Ratio
Illustration: 38
A firm has made credit sales of Rs 2,00,000 during the year. The outstanding amount of debtors at the beginning and at the end of the year were Rs 20,000 and Rs 30,000 respectively. What is the Debtors Turnover Ratio?
Solution
Formula
Debtors Turnover Ratio |
= |
Net Credit Sales/Average Debtors |
|
|
|
|
|
|
|
|
|
9.1.3 Creditors Turnover Ratio
It is a ratio between net credit purchases and the average amount of creditors outstanding during the year.
Formula
Creditors Turnover Ratio |
= |
Net Credit Purchases/Average Creditors |
Net Credit Purchases |
= |
Gross Credit Purchases – Returns |
|
|
|
Creditors include bills payable.
A low ratio shows the liberal credit policy.
A high ratio shows the speedy settlement of credit.
Computation of Creditors Turnover Ratio
Illustration: 39
A firm has made credit purchases of Rs 3,00,000. The amount payable to the creditors at the beginning and the end of the year is Rs 70,000 and Rs 80,000 respectively. Compute the Creditors Turnover Ratio.
Solution
Creditors Turnover Ratio |
= |
Net Credit Purchases/Average Creditors |
|
|
|
|
|
|
|
|
|
9.2 Cash Cycle – Combined Effect of Turnover Ratios
Cash cycle shows the inter-relationships of sales, collections from debtors and payment to creditors. It reveals the combined effect of all these Turnover Ratios.
Assume that in the above three illustrations, the data showed relate to a single and same firm, then cash cycle.
Inventory Holding Period |
= 2 months |
Add: Debtors Collection Period |
|
Less: Creditor s Payment Period |
|
Shorter the cash cycle,, better the liquidity status. |
|
[The liquidity position of a firm, now-a-days, at international level, is also examined in relation to its ability to meet projected daily expenditure from operations. Such ratios – Defensive Interval Ratio (a ratio between quick assets and projected daily cash recruitments), Cash Flow from operations ratios are not dealt with here.]
9.3 Leverage Ratios
The other category of financial ratios is also termed as Leverage Ratios or Capital Structure Ratios. A modern approach is to express Debt Equity Ratio in terms of the relative proportion of long-term debt and shareholder’s equity.
Debt Equity Ratio = Long-term Debt/Shareholder’s Equity
In this approach, Current Liabilities are excluded in long-term debt. So, by including the Current Liabilities in the debt structure, Debt Equity Ratio is computed differently as
Debt Equity Ratio = Total Debt/Shareholder’s Equity
The Debt Equity Ratio has wider implications, affecting the creditors, owners and even the firm itself. Do judicious combination of Creditors Funds and Owners Funds, that is, the proportion of debt in the financial structure plays a crucial role in determining financial status of a firm. Technically this is termed as Leverage or Trading on Equity %.
This is further inter-related to Coverage Ratios, which measure the firm’s ability to pay certain fixed charges. The Coverage Ratios measure the relation between what is normally available from operations of the firms and the claims of outsiders. Coverage Ratios –interest coverage, dividend coverage, total fixed charge coverage, total cash flow coverage, capital expenditure ratio, debt–service coverage ratio are not dealt with here.
9.4 Profitability Ratios
9.4.1 Profitability Ratios relating to Sales
We have discussed Profitability Ratios in the earlier part of the chapter. Now a slight advance step on Profitability Ratios is to be seen here. Profitability Ratios relating to sales is termed as Expense Ratio. There are different variants of Expense Ratios, depending upon the nature of expense. They are
- Cost of Goods Sold = Cost of Goods Sold/Net Sales × 100
- Operating Expenses Ratio = Administrative Expenses + Selling Expenses/Net Sales ×100
- Administrative Expenses Ratio = Administrative Expenses/Net Sales × 100
- Selling Expenses Ratio = Selling Expenses/Net Sales× 100
- Operating Ratio = Cost of Goods Sold + Operating Expenses/Net Sales × 100
- Financial Expenses Ratio=Financial Expenses/Net Sales × 100
Note: Expenses on taxes, dividends and extraordinary losses (theft, stock devasted by natural calamities) are not included.
Thus, specific Expenses Ratio for each of such items may be calculated. These Expense Ratios are interrelated with Profit Margin Ratio (G.P. Ratio, N.P. Ratio etc.). The Profitability Ratios based on sales (Expenses Ratio) is a very important tool for ana1ysing the operational efficiency – the profitability of a manufacturing concern.
9.4.2 Profitability Ratios relating to Investments
Return on Investment Ratio: Profitability Ratios relating to Investments, measures the relationship of the profit of the firm to its Investments. These ratios are termed as Return on Investments (ROI).
Return on Assets: (based on assets) measure the relationship between net profit assets. The net profit may be (a) net profits after taxes (b) net profits after taxes + interest and (c) net profits after taxes + interest – tax savings and the assets may be (a) total assets (b) fixed assets and (c) tangible assets. As such, there are different variants in computation of return on assets.
Formulae for computing different return on assets:
- Return on Assets (ROA) = Net Profit after Taxes/Average Total Assets × 100
- ROA = Net Profit after Taxes + Interest/Average Total Assets × 100
- ROA = Net Profit after Taxes + Interest/Average Tangible Assets × 100
- ROA = Net Profit after Taxes + Interest/Average Fixed Assets ×100
The above formulae can be substituted by the following to ascertain the operating performance of a business entity.
Return on Capital Employed (ROCE): Here the capital employed is the base to test the profitability of a concern, relating to sources of long-term funds.
As the concepts of profits and capital employed vary, ROCE also can be computed in various ways:
- ROCE = Earnings Before Interest and Taxes (EBIT) /Average Total Capital Employed + 100
- ROCE = Net Profit after Taxes + Interest – Tax advantage on Interest/Average Total Capital Employed ×100
- ROCE = Net Profit after Taxes + Interest – Tax advantage on Interest/Average Total Capital Employed – Average Intangible Assets × 100
ROCE, in total, assess the firm’s profitability, taking owners’ funds and lenders’ funds together.
9.4.3 Return on Shareholder’s Equity
Profit is based on return on shareholder’s equity and its different variants. Moving one step up, profitability of firm may be ascertained by computing Return on Shareholder’s Equity.
There are different variants of the Return on Shareholder’s equity. They are:
- Rate of return on:
- Total Shareholders’ Equity
- Equity of Ordinary Shares
- Earnings Per Share (EPS)
- Dividend Per Share (DPS)
- Dividend Payout Ratio (D/P Ratio)
- Dividend and Earnings Yield
- Price Earnings Ratio (P/E Ratio)
- Return on Investment (ROI) and (h) Computing of ROI Ratio
9.4.3.1a Return on Total Shareholders’ Equity: Return on Total Shareholders’ Equity = Net Profit after Taxes/ Average Total Shareholders’ Equity × 100
Total Shareholders’ Equity = Preference Share Capital + Ordinary Shareholders’ Equity (equity share capital + share premium +reserves and surplus – accumulated loss)
This ratio indicates how profitably the owners’ funds have been utilised by the business entities.
9.4.3.1b Rate of Return on Equity of Ordinary Shareholders: It is also called as Net Worth. This ratio measures the return on the total equity funds of ordinary shareholders.
Return on Equity Funds
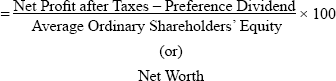
This is the most essential and vital ratio for equity shareholders of a company. Since equity shareholders are real owners, this ratio plays a crucial and significant role in industries.
9.4.3.2 Earnings Per Share (EPS):This measures the extent of profit available to the equity shareholders. Profit is computed as per share basis.
Earnings Per Share = Net Profit (after taxes and dividend on performance shares)/No. of Ordinary Shares Outstanding × 100
These ratios can be analysed by (i) intra-firm results (past records) (ii) inter-firm comparisons and (iii) overall industry results.
Besides these,
- Cash Earnings Per Share,
- Book Value Per Share and
- Price to Book Value Shares
are also useful in analysing and predicting future returns from Stock.
9.4.3.3 Dividend Per Share (DPS):DPS = Dividend paid to ordinary shareholders/No. of Ordinary Shares Outstanding
DPS may be a better indicator than EPS, as it shows the distribution of net profit to ordinary shareholders.
9.4.3.4 Dividend Payout Ratio (D/P Ratio):This ratio measures the proportion of dividends paid to earning available to shareholders.
From this, Retention Ratio is computed.
Retention Ratio = 100 − D/P Ratio
This is useful to measure how much is retained in the business from the net profits earned.
These two ratios, i.e. EPS and DPS are generally based on book value of shares (per share).
9.4.3.5 Earnings and Dividend Yield: Yield of a firm may also be expressed on the basis of market value of shares (per share). These are (i) Earnings Yield (ii) Dividend Yield
They are computed as:
- Earnings Yield = EPS/Market Value Per Share × 100
- Dividend Yield = DPS/Market Value Per Share × 100
9.4.3.6 Price Earnings Ratio (P/E Ratio):This ratio measures the amount that investors are willing to pay for each rupee of earnings.
- This ratio measures investors’ expectations and the market appraisal of the performance of a business entity.
- As investors on firm’s performance is assessed, this is very useful to the investors.
- Further advanced concepts such as Return on Equity (ROE), Growth Rates, Internal Growth Rate (IGR) and Sustainable Growth Rates (SGR) are not dealt with here.
9.4.3.7 Return on Investment (ROI):This ratio measures the relationship of profit with capital employed.
Formula:
- This ratio is expressed in percentage.
- This is useful to ascertain how much income the use of Rs 100 of Capital generates.
- This ratio measures how efficiently the sources entrusted to the business are used.
- This ratio also ascertains the efficiency of different units within a business concern.
9.4.3.8 Computation of ROI Ratio: Capital employed is to be computed, first. For this, any of the following methods can be adopted.
Method 1: Sum of (1) Share Capital (includes preference and equity) (2) Reserves and (3) Long-term loans has to be done.
From this total, the following items have to be deducted: (1) Fictious Assets (e.g. preliminary expenses) and (2) Non-operating assets.
Net result will be the Capital employed.
Method 2: Capital employed will be ascertained by adding all the fixed assets (less depreciation) and the working capital of a concern.
Illustration: 40
Following is the Balance Sheet of Raj Ltd as on Mar 31, 2009: Compute ROI:

Solution
Step 1: Profit before interest has to be computed.
|
Rs |
|---|---|
Profit (as shown in the question) |
4,00,000 |
Add: Interest (10% on Rs 10,00,000) |
1,00,000 |
Profit before interest |
5,00,00 |
Step 2: Capital employed is to be computed.
Method 1:Fixed Assets (Net) |
25,00,000 |
Add: Working Capital |
|
Current Assets –Current Liabilities |
5,00,000 |
(Rs 15,00,000 – Rs 10,00,000) |
|
Capital Employed |
________ |
This can be ascertained by another way. |
|
Method 2: Share Capital |
10,00,000 |
Add: (Reserves + Profits) |
|
Rs 7,00,000 + Rs 4,00,000 |
11,00,000 |
|
21,00,000 |
Add: Loans |
10,00,000 |
|
31,00,000 |
Less: Underwriting Commission |
1,00,000 |
Capital Employed |
30,00,000 |
Step 3: → ROI |
= |
Profit before Interest/Capital Employed × 100 |
|
= |
Rs 5,00,000/Rs 30,00,000 × 100 |
|
= |
16.66% |
Calculation of Capital Employed
Illustration: 41
The Balance Sheet of X Ltd as on Mar 31, 2009.

Additional Information
Net profit for the year was Rs 1,00,000 after charging interest of Rs 20,000 on secured term loan, but before tax.
Calculate Return on Capital Employed for the year.
Solution
[Note: As Net profit and interest are shown in additional information they may straight away be taken for the computation of the Profit Before Interest (PBI).
Step 1: Here profit is shown after charging interest. So profit is added to interest here to arrive at Profit Before Interest.
Therefore, Profit Before Interest = Rs 1,00,000 + Rs 20,000 = Rs 1,20,000
Step 2: Capital Employed is now calculated.
Method 1: Fixed Assets
(Rs 1,00,000 + Rs 1,00,000 + Rs 1,77,500 + Rs 37,500 + Rs 25,000) |
= |
Rs 4,40,000 |
Add → Working Capital (C.A.. C.L.) |
= |
Rs 60,000 |
(Rs 4,70,000 – Rs 4,10,000) |
|
__________ |
Method 2
|
Rs |
Share Capital |
2,50,000 |
Preference Share Capital |
1,00,000 |
Add: Reserves and Surplus |
1,25,000 |
Add: Long-term Loan |
1,50,000 |
|
6,25,000 |
Less: Miscellaneous Expenditure |
25,000 |
|
6,00,000 |
Less: Investment |
1,00,000 |
Capital Employed |
5,00,000 |
Step 3: Return on Capital Employed: PBI/Capital Employed × l00
= 1,20,000/5,00,000 × 100 = 24%
Note: Investments not taken into account here assuming it is not exclusively for the business concern.
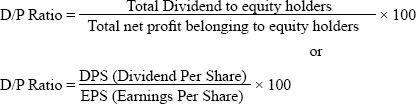
Computation of EPS
Illustration: 42:
Calculate the Earnings Per Share from the following data.
|
Rs |
Net Profit after Tax |
6,00,000 |
10% Preference Share Capital (Rs 10 each) |
10,00,000 |
Equity Share Capital (Rs 10 per share) |
10,00,000 |
Solution
|
Rs |
Preference Dividend: 10% of Rs 10,00,000 |
1,00,000 |
Number of Equity Shares |
10,00,000/10 |
|
1,00,000 |
Net Profit after Tax |
6,00,000 |
Substitute the figures in the equation or formula:
Earnings Per Share

Computation of DPS
Illustration: 43
Net Profit after interest and tax Rs 5,00,000. Profit distributed as dividend 50%. Equity Share Capital (25,000 equity shares Rs 100 per share) Rs 25,00,000. Calculate Dividend Per Share.
Solution
DPS |
= |
Profit distributed as Dividend/No. of Equity Shares |
|
= |
(50% of Rs 5,00,000)/25,000 = Rs 2,50,000/25,000 |
|
= |
Rs 10 |
DPS |
= |
Rs 10 per Share |
Illustration: 44
Earnings per share Rs 25. Market Price per share Rs 400. Calculate Price Earning Ratio.
Solution

Illustration: 45
The Capital of Vasanth Co. Ltd is as follows:
|
Rs |
10% Preference Share of Rs 10 each |
5,00,000 |
Equity Shares of Rs 10 each |
20,00,000 |
|
________ |
Further Information
|
Rs |
Profit after Tax |
2,50,000 |
Equity Dividend Paid |
1,00,000 |
Market price per Equity Share |
50 |
Calculate: (i) Earnings Per Share and (ii) Price Earning Ratio.
Solution
- EPS
P/E Ratio
=
Market Price per Share/Earning per Share
=
Rs 50/Re. 1 = 50 : 1
(Combining these two ratios, that is, EPS and P/E, market value of share in future may be computed, which means forecast.)
[Here Market Price per Share |
= |
EPS × P/E |
|
= |
1 × 50 = Rs 50] |
Illustration: 46
|
Rs |
Equity Share Capital (Rs 10 per Share) |
25,00,000 |
Reserves and Surplus |
2,50,000 |
Secured Loan (15%) |
12,50,000 |
10% Unsecured Loan |
6,25,000 |
Fixed Assets |
15,00,000 |
10% Investments |
2,50,000 |
Operating Profit |
12,50,000 |
Income Tax Rate |
50% |
Market Price per Share |
50 |
Calculate Price Earning Ratio (P/E) |
|
Solution
Step 1: First, EPS has to be ascertained.
Rs |
|
Operating Profit |
12,50,000 |
Less:
|
2,50,000 |
Profit before Tax |
10,00,000 |
Less: Income Tax 50% |
5,00,000 |
Profit after Tax |
5,00,000 |
Step 2: No. of Equity Shares
= Rs 25,00,000/Rs 10 = 2,50,000 shares
Step 3: EPS = Profit after Tax/No. of Equity Shares
= Rs 5,00,000/2,50,000 = Rs 2
Step 4: Calculation of P/E Ratio
|
P/E Ratio |
= |
Market Price per Share/EPS |
|
|
|
|
SOLVED PROBLEMS FOR PROFESSIONAL COURSES – COMPREHENSIVE
Construction of Trading and Profit A/c
Illustration: 47
You are given the following information for the year 2008–09 from the books of a firm engaged in trading operations.
Average monthly sales for the year amounted to Rs 30,000
Goods are sold at cost plus 25%
Stock-in-trade on Mar 31,2009: Rs 29,000
Stock Turnover Ratio: 10
Operating Ratio: 85% Turnover
Depreciation charged on fixed assets for the year: Rs 10,000
Non-operating income for the year consisted of Bank Interest Rs 1,500 and Dividends received from investments Rs 2,500.
Non-operating expenses amounted to Rs 2,500 towards the sale of fixed assets.
You are required to construct the Trading and Profit and Loss Account of the firm for the year ended Mar 31, 2009.
(ICWA Inter – Modified)
Solution
The following have to be computed in the order of sequence: (1) G.P. (2) Opening Stock (3) Purchases (4) Net Operating Profit (5) Total Operating Expenses to construct the Trading and Profit and Loss A/c.
Step 1: Calculation of Gross Profit
Gross Profit |
= |
25% of Sales |
|
= |
25/100 × (Rs 30,000 × 12) |
|
= |
1/4 × Rs 3,60,000 |
|
= |
Rs 90,000 |
Step 2: Calculation of Opening Stock
Cost of Goods Sold |
= |
Sales – G.P. |
|
= |
Rs 3,60,000 – Rs 90,000) |
|
= |
Rs 2,70,000 |
Stock Turnover |
= |
Cost of Goods Sold/Average Stock |
10 (Given) |
= |
Rs 2,70,000/Average Stock |
Let Average Stock be X. |
|
|
Then 10 |
= |
Rs 2,70,000/X |
10 × X |
= |
Rs 2,70,000 |
X = Rs 2,70,000/10 = Rs 27,000 |
|
|
Average Stock |
= |
(Opening Stock + Closing Stock)/2 |
Rs 27,000 |
= |
(Opening Stock + Closing Stock)/2 |
(Opening Stock + Closing Stock)/2 |
= |
Rs 27,000 |
Let Opening Stock be taken as “Y” |
|
|
Y + Closing Stock |
= |
Rs 27,000 × 2 |
Y + Rs 29,000 |
= |
Rs 54,000 |
(Given) |
|
|
Y |
= |
Rs 54,000 – Rs 29,000 |
Therefore, Opening Stock |
= |
Rs 25,00 |
Step 3
Purchases |
= |
C.G.S. + Opening Stock – Closing Stock |
Purchases |
= |
Rs 2,70,000 + Rs 29,000 – Rs 25,000 |
|
= |
Rs 2,74,000 |
Step 4: Calculation of Net Operating Profit
|
|
85 (Given) |
|
Therefore, Total Operating Expenses |
= |
85 × 3,60,000/100 |
|
= |
Rs 3,06,000 |
Therefore, Net Operating Profit |
= |
Sales – Total Operating Expenses |
|
= |
Rs 3,60,000 – Rs 3,06,000 |
|
= |
Rs 54,000 |
Step 5: Calculation of Operating Expenses
Operating Expenses other than Depreciation = Total Operating Expenses — C.G.S. — Depreciation
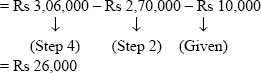
Step 6: Construction of Trading and Profit and Loss Account
Trading and Profit and Loss Account
For the Year Ending Mar 31, 2009
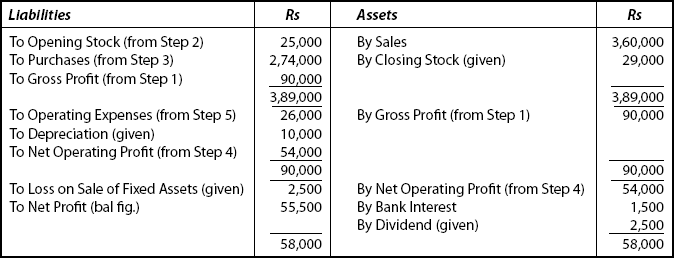
Construction of Balance Sheet
Illustration: 48
From the particulars furnished here under, you are required to prepare the Balance Sheet: Stock Velocity: 6; Gross Profit Margin = 20%; Capital Turnover Ratio: 2; Fixed Assets Turnover Ratio: 4; Debt Collection Period: 2 months; Creditors Payment Period: 73 days; Gross Profit was Rs 3,00,000; Excess of Closing Stock over Opening Stock was Rs 25,000; Difference in Balance Sheet represents Bank balance.
C.A. Inter – Modified)
Solution
(Assumption: The entire sales and purchases were made on credit.)
Note: Missing figures which are inter-related with other items are to be ascertained in the following sequences.
Step 1: Computation of Sales
Gross Profit Margin |
= |
20% |
Gross Profit (Given) |
= |
Rs 3,00,000 |
Therefore, Sales |
= |
100/20 × Rs 3,00,000 |
|
= |
Rs 15,00,000 |
Step 2: Cost of Goods Sold has to be computed.
Cost of Goods Sold |
= |
Sales – Gross Profit |
|
= |
Rs 15,00,000 − Rs 3,00,000 |
|
= |
Rs 12,00,000 |
Step 3: Calculation of Opening Stock and Closing Stock.
Stock Velocity |
= 6 (Given) |
Remember: Average Stock = Cost of Goods Sold/Stock Velocity
|
= |
Rs 12,00,000/6 = Rs 2,00,000 |
Let Opening Stock be taken as X Rs |
||
Then Closing Stock |
= |
Rs (X + 25,000) |
Remember another Equation: |
||
|
|
|
|
|
|
|
|
|
2X + Rs 25,000 |
= |
Rs 2,00,000 × 2 |
2X |
= |
Rs 4,00,000 − Rs 25,000 |
|
= |
Rs 3,75,000 |
X |
= |
Rs 3,75,000/2 = Rs 1,87,500 |
Therefore, Opening Stock |
= |
Rs 1,87,500 |
Closing Stock |
= |
Rs 1,87,500 + Rs 25,000 |
|
= |
Rs 2,12,500 |
Step 4: Computation of Capital
Remember: Capital = Sales/Capital Turnover Ratio
= Rs 15,00,000/2 = Rs 7,50,000
Step 5: Computation of Fixed Assets
Remember: Fixed Assets = Sales/Fixed Assets Turnover Ratio
= Rs 15,00,000/4 = Rs 3,75,000
Step 6: Calculation of Debtors
Debt Collection Period |
= |
2 months |
Debtors |
= |
Credit Sales × 2/12 |
|
= |
Rs (15,00,000) × (2/12) |
|
= |
Rs 2,50,000 |
Step 7: Computation of Purchases
Purchases |
= |
Cost of Goods Sold + Excess of Closing Stock over Opening Stock |
|
= |
Rs 12,00,000 + Rs 25,000 |
|
= |
Rs 12,25,000 |
Step 8: Computation of Creditors
Creditors Payment Period |
= |
73 days |
Creditors |
= |
(Credit Purchases) × 73/365 |
|
= |
(Rs 12,25,000) × 73/365 |
|
= |
Rs 2,45,000 |
Step 9: Finally, Preparation of Balance Sheet
Balance Sheet as on….

Calculation of Missing Figures
Illustration: 49
Complete the following annual financial statements on the basis of ratios provided as under.
Profit and Loss Account for the Year Ended Mar 31, 2009

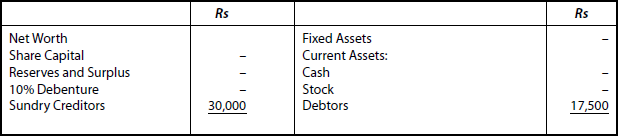
- Net Profit to Sales 5%
- Current Ratio 1.5
- Return on Net worth 20%
- Inventory Turnover 15 times
(based on Cost of Goods Sold)
- Share Capital to Reserves 4:1
- Rate of Income Tax 50%
(C.A. Inter – Modified)
Solution
Missing figures have to be ascertained in the following sequence (as the particulars relating to ratio are inter-related).
Step 1: Profit after Tax (PAT)
PAT |
= |
Sales × Net Profit Ratio |
= |
10,00,000 × 5% = Rs 50,000 |
Step 2: Provision for Tax
Income Tax Rate is 50%
Income Tax 50% of PBIT and
Profit after Tax = Balance 50%
(PAT)
Therefore PAT and Income Tax are equal
Hence Income Tax = (same as PAT) Rs 50,000 (Step 1)
Step 3: Debentures
Debentures |
= Interest on Debentures/Rate of Interest |
Step 4: EBIT
EBIT |
= Net Profit after Tax + Provision for Tax + Debentures interest |
Step 5: Net Worth
Net Worth |
= Return/Rate of Return on Net Worth |
Step 6: Share Capital
Share Capital |
= Net Worth × 4/5 |
Step 7: Reserves
Reserves |
= Net Worth – Share Capital |
Step 8: Current Assets
| Current Assets | = | Current Liabilities × 1.5 |
| = | (Given as Sundry Creditors)Rs 30,000 × 1.5 = Rs 45,000 |
Step 9: Closing Stock
Closing Stock |
= Cost of Goods Sold/Inventory Turnover Ratio |
Profit and Loss Account for the Year Ended Mar 31, 2009
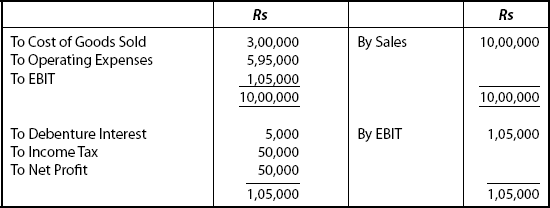
Balance Sheet as on Mar 31, 2009

Preparation of Final Accounts
Illustration: 50
From the following ratios and further information, you are required to prepare a Trading and Profit and Loss Account:
- Fixed Assets/Capital = 5/4
- Fixed Assets Rs 2,50,000
- Capital/Liabilities = 1/2
- Net Profit/Capital = 1/5
- Gross Profit Ratio 20%
- Stock Turnover Ratio = 10
- Fixed Assets/Total Current Assets = 5/7
- Net Profit to Sales 20%
- Closing Stock Rs 25,000
Out of Current Assets, Sundry Debtors are Rs 3,00,000.
The balance represents Cash.
(CA – Modified)
Solution
Note: In ratio analysis, the particulars are inter-related. As such, missing figures have to be computed in the sequence as follows:
Step 1: Calculation of Capital
Fixed Assets/Capital = 5/4
Rs 2,50,000/Capital = 5/4
Capital × 5 = 4 × Rs 2,50,000
Therefore, Capital = 4 × Rs 2,50,000/5 = Rs 2,00,000
Step 2: Liabilities value is to be computed
Capital/Liabilities |
= |
1/2 |
Rs 2,00,000/Liabilities |
= |
1/2 |
2 × Rs 2,00,000 |
= |
1 × Liabilities |
Therefore, Liabilities |
= |
Rs 4,00,000 |
Step 3: Computation of Net Profit
Net Profit/Capital |
= |
1/5 |
Net Profit/2,00,000 |
= |
1/5 |
Net Profit × 5 |
= |
1 × Rs 2,00,000 |
Net Profit |
= |
Rs 2,00,000/5 |
|
= |
Rs 40,000 |
Step 4: Computation of Sales
Net Profit/Sales × 100 |
= |
20 (Given: Particular No. (viii)) |
Rs 40,000/Sales × 100 |
= |
20 |
Therefore, Sales |
= |
Rs 40,000 × 100/20 = Rs 2,00,000 |
Step 5: Computation of Gross Profit
Gross Profit Ratio |
= |
20% (Given) |
Gross Profit/Sales × 100 |
= |
20 |
Gross Profit/Rs 2,00,000 × 100 |
= |
20 |
Therefore, Gross Profit |
= |
Rs 2,00,000 × 20/100 = Rs 40,000 |
Step 6: Computation of Opening Stock
Take the equation,
Cost of Goods Sold |
= |
Sales – Gross Profit |
|
= |
Rs 2,00,000 – Rs 40,000 = Rs 1,60,000 |
Going to other related equation:
Cost of Goods Sold/Average Stock |
= |
Stock Turnover Ratio |
Rs 1,60,000/Average Stock |
= |
10 (Given) |
Rs 1,60,000 |
= |
10 × Average Stock |
Average Stock = Rs 1,60,000/10 |
= |
Rs 16,000 |
|
|
|
Opening Stock + Closing Stock |
= |
2 × Average Stock |
|
= |
2 × Rs 16,000 |
|
= |
Rs 32,000 |
Opening Stock + Rs 25,000 |
= |
Rs 32,000 |
Therefore, Opening Stock |
= |
Rs 32,000 − Rs 25,000 |
|
= |
Rs 7,000 |
Step 7: Cash Balance
Fixed Assets/Total Current Assets |
= |
5/7 |
Rs 2,50,000/Total Current Assets |
= |
5/7 |
5 × Total Current Assets |
= |
7 × Rs 2,50,000 |
Total Current Assets |
= |
7 Rs 2,50,000/5 |
|
= |
7 × Rs 50,000 |
|
= |
Rs 3,50,000 |
But Total Current Assets |
= |
Closing Stock + Debtors + Cash |
Cash |
= |
Total Current Assets – Closing Stock – Debtors |
|
= |
Rs 3,50,000 – Rs 25,000 – Rs 3,00,000 |
|
= |
Rs 25,000 |
Step 8: Finally, after obtaining all the figures, we have to prepare first, Trading and Profit and Loss Account and then the Balance Sheet.
Trading and Profit and Loss Account for the Year Ended

Balance Sheet as at
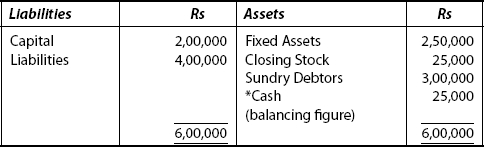
Construction of a Proforma Balance Sheet
Illustration: 51
From the following information, compute the Proforma Balance Sheet of a public limited company:
Sales = Rs 20,00,000
Sales to Net Worth = 2 times
Current liabilities to Net Worth = 40%
Total liabilities to Net Worth= 60%
Current Ratio= 3 times
Sales to Closing Inventory =5 times
Average Collection Period = 73 days
Proforma Balance Sheet
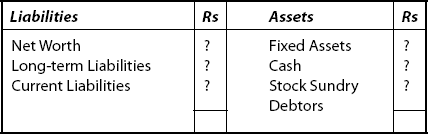
(C.A. Inter, Modified)
Solution
Note: Proforma Balance Sheet itself is a hint to ascertain the missing figures. It is done as follows:
Step 1: Computation of Net Worth
Sales to Net Worth |
= |
2 times (given) |
Rs 20,00,000/Net Worth |
= |
2 |
Net Worth × 2 |
= |
Rs 20,00,000 |
Net Worth |
= |
Rs 20,00,000/2 |
|
= |
Rs 10,00,000 |
Step 2: Computation of Current Liabilities
Current Liabilities to Net Worth |
= |
40% (given) |
Current Liabilities/Net Worth |
= |
40/100 |
Current Liabilities/Rs 10,00,000 |
= |
40/100 |
100 × Current Liabilities |
= |
40 × Rs 10,00,000 |
Current Liabilities |
= |
40 Rs 10,00,000/100 |
|
= |
Rs 4,00,000 |
Step 3:Computation of Long-term Liabilities
Total Liabilities to Net Worth |
= |
60% (given) |
Total Liabilities/Net Worth |
= |
60/100 |
100 × Total Liabilities |
= |
60 × Rs 10,00,000 |
Total Liabilities |
= |
60 × Rs 10,00,000/100 |
|
= |
Rs 6,00,000 |
Therefore, Long-term liabilities |
= |
Total Liabilities – Current Liabilities |
|
= |
Rs 6,00,000 – Rs 4,00,000 |
|
= |
Rs 2,00,000 |
Step 4: Computation of Current Assets
Current Ratio |
= |
Current Assets/Current Liabilities = 3 (Given) |
|
= |
Current Assets/Rs 4,00,000 = 3 (Given) |
Therefore, Current Assets |
= |
3 × Rs 4,00,000 |
|
= |
Rs 12,00,000 |
Step 5: Calculation of Stock
Sales to Closing Inventory |
= |
5 times (Given) |
Sales/Stock |
= |
5 times |
Rs 20,00,000 |
= |
5 × Stock |
Therefore, Stock |
= |
Rs 20,00,000/5 |
|
= |
Rs 4,00,000 |
Step 6: Computation of Sundry Debtors
Average Collection Period |
= |
73 days |
Sundry Debtors/Sales/365 |
= |
73 |
Therefore, Sundry Debtors |
= |
Rs 20,00,000 × 73/365 |
|
= |
Rs 4,00,000 |
Step 7: Computation of Cash
Cash |
= |
Current Assets – Stock – Debtors |
|
= |
Rs 12,00,000 – Rs 4,00,000 – Rs 4,00,000 |
|
= |
Rs 4,00,000 |
Step 8: Finally, Proforma Balance Sheet has to be drawn.
Proforma Balance Sheet
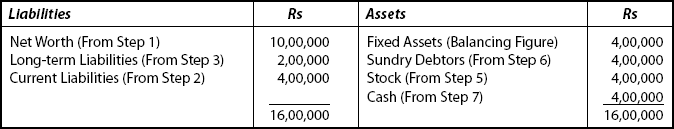
SOLVED PROBLEMS (COMPREHENSIVE)
Comprising different ratios
Illustration: 52
Net Profit Ratio of a business concern is 20%. The indirect expenses are Rs 80,000 and cash sales are Rs 3,00,000. The credit are 80% of total sales. Calculate the Gross Profit Ratio.
Solution
Step 1: Value of Total Sales has to be calculated.
Credit Sales = 80% of total sales (given in the question)
∴ Cash Sales = 100% – 80%
(Total Sales – Credit Sales)
Step 2: After this, we have to calculate Net Profit..
Formula: Net Profi t Ratio = Net Profi t/Net Sales × 100
Substitute the values in the formula:
20% |
= |
Net Profit/Rs 15,00,000 |
i.e., 20/100 |
= |
Net Profit/Rs 15,00,000 |
Net Profit × 100 |
= |
20 × Rs 15,00,000 |
Net Profit |
= |
20 × 15,00,000/100 |
∴ Net Profit |
= |
Rs 3,00,000 |
Step 3: Next, Gross Profit has to be found out.
Remember: Gross Profit = Net Profit + Indirect Expenses
|
= |
Rs 3,00,000 + Rs 80,000 (given) |
|
= |
Rs 3,80,000 |
Step 4: Finally, Gross Profit Ratio has to be computed.
Formula: Gross Profit Ratio = Gross Profit/Net Sales × 100
Substitute the values in the formula:
Gross Profit Ratio |
= |
Rs 3,80,000/Rs 15,00,000 × 100 |
|
= |
25.33% |
Illustration: 53
From the following information, calculate
(i) Stock Turnover Ratio (ii) Operating Ratio and (iii) Capital Turnover Ratio
|
Rs |
Opening Stock |
28,000 |
Closing Stock |
22,000 |
Purchases |
46,000 |
Sales |
90,000 |
Sales Returns |
10,000 |
Carriage Inwards |
4,000 |
Office Expenses |
4,000 |
Selling and Distribution Expenses |
2,000 |
Capital Employed |
2,00,000 |
Solution
(i) Computation of Stock Turnover Ratio
Step 1: Formula: Stock Turnover Ratio = Cost of Goods Sold/Average Stock
- From the given information, we have to calculate Cost of Goods Sold.
- Remember: Cost of Goods Sold = Opening Stock × Purchases × Carriage Inwards – Closing Stock
- Substitute the figures in the equation from the information given in the question.
- Cost of Goods Sold = Rs 28,000× Rs 46,000 × Rs 4,000– Rs 22,000 = Rs 56,000
Step 2: Then Average Stock has to be computed.
|
|
|
|
|
|
Average Stock |
= |
Rs 25,000 |
Step 3: Final Step
Formula: Stock Turnover Ratio |
= |
Cost of Goods Sold/Average Stock |
|
= |
Rs 56,000/Rs25,000 |
∴ Stock Turnover Ratio |
= |
2.24 times |
(ii) Computation of Operating Ratio
For this, Operating Expenses have to be computed.
Step 1: Here, Operating Expenses = Office Expenses + Selling and Distribution Expenses
|
= |
Rs 4,000 + Rs 2,000 |
|
= |
Rs 6,000 |
Step 2: Cost of Goods Sold (As worked out in Step 1) = Rs 56,000
Step 3: Net Sales = Sales – Sales Returns
|
= |
Rs 90,000 − Rs 10,000 (Given) |
|
= |
Rs 80,000 |
Step 4: Formula: Operating Ratio ![]()
|
= |
Rs 56,000 + Rs 6,000/Rs 80,000 × 100 |
∴ Operating Ratio |
= |
77.5% |
(iii) Computation of Capital Turnover Ratio
Formula |
= |
Net Sales/Capital Employed × 100 |
|
= |
Rs 80,000/Rs 2,00,000 × 100 |
|
= |
40% |
Illustration: 54
Rs 2,40,000 is the Cost of Goods Sold.
Inventory Turnover is 8 times.
Stock at the beginning is 1.5 times more than the stock at the end.
Calculate the value of opening and closing stock.
Solution
Step 1: Let the Closing Stock be X. (Assumption)
Then Opening Stock will be = 1.5X (As per question)
i.e., Opening Stock is 1.5 times more than Closing Stock.
Step 2: Formula: Inventory Turnover Ratio = Cost of Goods Sold/Average Stock
8 |
= |
Rs 2,40,000/(X + l.5X/2) |
(Average Stock = (Opening Stock + Closing Stock)/2) |
||
8 |
= |
Rs 2,40,000 × 2/(X + l.5X) |
8(X + 1.5X) |
= |
Rs 2,40,000 × 2 |
8(2.5X) |
= |
Rs 4,80,000 |
20X |
= |
Rs 4,80,000 |
X |
= |
Rs 4,80,000/20 = Rs 24,000 |
Closing Stock |
= |
Rs 24,000 |
Step 3: Opening Stock = Rs 24,000 × 1.5
= Rs 36,000
Illustration: 55
- The ratio of Current Assets (Rs 3,00,000) to Current Liabilities (Rs 2,00,000) is 1.5:1. The accountant of the business concern is interested in maintaining a Current Ratio at the level 2:1 by paying off a part of Current Liabilities. Compute the amount of current liabilities that should be paid off in order to maintain the Current Ratio at the level 2:1.
- Compute the Gross Profit Ratio. Sales: Rs 6,00,000; Gross Profit 25% on Cost.
Solution
(A) Let the Current Liabilities that should be paid off be Y (assumed).
Substitute the figure in the formula :
|
|
|
2(2,00,000 − Y) |
= |
1(3,00,000 − Y) |
4,00,000 − 2Y |
= |
3,00,000 − Y |
−2Y + Y |
= |
3,00,000 − 4,00,000 |
−Y |
= |
−1,00,000 |
Y |
= |
Rs 1,00,000 |
So Current Liabilities that should be paid to maintain the Current Ratio at the level 2:1 will be Rs 1,00,000.
(B) Step 1: Let the Cost of Goods Sold be Rs 100 (assumed).
Then Sales = Rs 100 + 25 (Given) = 125
If Sales are Rs125, Cost of Goods Sold is Rs 100.
Step 2: If Sales are Rs 6,00,000 (given in question),
Cost of Goods Sold will be |
= |
100/125 × 6,00,000 |
|
= |
Rs 4,80,000 |
Step 3: Gross Profit = Sales – Cost of Goods Sold
|
= |
Rs 6,00,000 – Rs 4,80,000 |
|
= |
Rs 1,20,000 |
Step 4: Formula: Gross Profit Ratio = Gross Profit/Net Sales × 100
Substitute the values in the formula:
Gross Profi t Ratio = Rs l,20,000/Rs 6,00,000 × 100
|
= |
20% |
Illustration: 56
Net Sales: Rs 4,00,000; Cost of Goods Sold: Rs 2,00,500; Administrative Expenses: Rs 45,000; Selling Expenses: Rs 57,000; Share Capital: Rs 8,50,000; Reserves and Surplus: Rs 3,00,000; Long-term Loans: Rs 8,20,000; Fixed Assets (Net): Rs 4,62,000; Investments: Rs 2,42,500; Debtors: Rs 72,000; Opening Stock; Rs 2,40,000; Closing Stock: Rs 2,10,000; and Bank Balance: Rs 3,00,000.
From the above details, you are required to compute:
- Gross Profit Ratio
- Stock Turnover Ratio
- Proprietary Ratio
Solution
(a) Computation of Gross Profit Ratio
Remember: Gross Profit |
= |
Net Sales – Cost of Goods Sold |
|
= |
Rs 4,00,000 – Rs 2,00,500 |
|
= |
Rs 1,99,500 |
- Formula: Gross Profit Ratio = Gross Profit/Net Sales × 100
|
= |
Rs l,99,500/Rs 4,00,000 × 100 |
|
= |
49.87% |
(b) Computation of Stock Turnover Ratio
Step 1: First, Average Stock is to be calculated.
|
|
|
|
|
|
|
= |
Rs 4,50,000/2 = Rs 2,25,000 |
Step 2: Formula = Stock Turnover Ratio = Cost of Goods Sold/Average Stock
Substitute the values in the formula,
= Rs 2,00,500/Rs 2,25,000 = 0.89 times
(c) Calculation of Proprietary Ratio
Step 1: Shareholder’s Funds should be calculated.
Remember: Shareholder’s Funds |
= |
Share Capital + Reserves and Surplus |
|
= |
Rs 8,50,000 + Rs 3,00,000 (Given) |
|
= |
Rs 11,50,000 |
Step 2: Total Assets should be calculated.
Remember: Total Assets: Sum of all assets given in question
Here, Total Assets |
= |
Fixed Assets + Investments + Debtors + Closing Stock + Bank Balance |
|
= |
Rs 4,62,000 + Rs 2,42,500 + Rs 72,000 + Rs 2,10,000 + Rs 3,00,000 |
|
= |
Rs 12,86,500 |
Step 3: Formula:
Proprietary Ratio |
= |
Shareholder’s Funds/Total Assets |
|
= |
Rs l1,50,000/Rs 12,86,000 |
|
= |
0.89 |
|
|
Or |
|
= |
89.42% |
Illustration: 57
On the basis of the following information, you are required to calculate the following ratios:
- Gross Profit Ratio
- Debt Equity Ratio
- Working Capital Turnover Ratio
Net Sales: Rs 5,65,000; Bank Loan; Rs 1,25,000; Cost of Goods Sold: Rs 3,75,000.00; Current Assets: Rs 3,25,000; Current Liabilities: Rs 1,75,000; Equity Share Capital: Rs 3,95,000; Debentures: Rs 1,29,000.
Solution
(a) Calculation of Gross Profit Ratio
Step 1: Gross Profit has to be worked out first.
Remember: Gross Profit |
= |
Net Sales – Cost of Goods Sold |
|
= |
Rs 5,65,000 – Rs 3,75,000 |
|
= |
Rs 1,90,000 |
Step 2: Now, Gross Profit Ratio = Gross Profit/Net Sales × 100
|
= |
Rs 1,90,000/Rs 5,65,000 × 100 |
|
= |
33.62% |
(b) Calculation of Debt Equity Ratio
Step 1: Total Long-term Debts have to be determined first.
Remember: Total Long-term Debts |
= |
Debentures + Loan |
|
= |
Rs 1,29,000 + Rs 1,25,000 |
|
= |
Rs 2,54,000 |
Step 2: Formula:
Debt Equity Ratio = (Total) Long-term Debts/Shareholder’s Funds
Remember: Shareholder’s Funds = Equity Share Capital
∴ Ratio |
= |
Rs 2,54,000/Rs 3,95,000 |
|
= |
0.64:1 |
(c) Calculation of Working Capital Turnover Ratio
Step 1: First Net Working Capital has to be ascertained.
Remember: Working Capital |
= |
Current Assets – Current Liabilities |
|
= |
Rs 3,25,000 – Rs 1,75,000 |
|
= |
Rs 1,50,000 |
Step 2: Formula:
Working Capital Turnover Ratio |
= |
Net Sales/Net Working Capital |
|
= |
Rs 5,65,000/Rs 1,50,000 |
|
= |
3.76 times |
Illustration: 58
Calculate the Cost of Goods Sold from the following information:
Sales: Rs 12,00,000; Sales Returns: Rs 80,000;
Operating Expenses: Rs 1,82,000; Operating Ratio: 92%
Solution
Formula:
Operating Ratio = Cost of Goods Sold + Operating Expenses/Net Sales × l00
Substitute the values
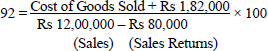
92/100 = Cost of Goods Sold + Rs 1,82,000/Rs 11,20,000
100 × (Cost of Goods Sold + Rs 1,82,000) |
= |
92 × Rs 11,20,000 |
Cost of Goods Sold + Rs 1,82,000 |
= |
92 × Rs l1,20,000/100 |
|
= |
Rs 10,30,400 |
Cost of Goods Sold |
= |
Rs 10,30,400 − Rs 1,82,000 |
|
= |
Rs 8,48,400 |
Illustration: 59
Calculate the amount of Gross Profit from the following information:
Average Stock |
= |
Rs 80,000 |
Stock Turnover Ratio |
= |
6 times |
Selling Price |
= |
25% above cost |
Solution
This problem can be solved in either of the following two methods:
Method 1
Step 1: Formula: Stock Turnover Ratio = Cost of Goods Sold/Average Stock
6 |
= |
Cost of Goods Sold/Rs 80,000 |
6 × Rs 80,000 |
= |
Cost of Goods Sold |
Rs 4,80,000 |
= |
Cost of Goods Sold |
Step 2: Selling Price is given 25% above cost.
∴ Gross Profit |
= |
25% of Cost of Goods Sold |
|
= |
25/100 – Rs 4,80,000 |
|
= |
Rs 1,20,000 |
Method 2
Let the Cost Price be taken as Rs 100 (assumption)
Sale Price |
= |
25% above cost |
|
= |
Rs 100 + 25 = Rs 125 |
If Sale Price is Rs 125, Cost Price = 100 |
||
If Sale Price is Rs 4,80,000, Cost Price = 125/100 × Rs 4,80,000 |
||
(Cost Price) Sales Cost = Rs 6,00,000 |
||
Gross Profit = Sales – Cost of Goods Sold |
||
|
= |
Rs 6,00,000 – Rs 4,80,000 |
|
= |
Rs 1,20,000 |
Note: Depending on the particulars provided in the problem, students can choose any of the above methods to ascertain Gross Profit.
Illustration: 60
Calculate Opening Stock and Closing Stock from the following information:
Total Sales = Rs 6,00,000
Gross Profit = 25% on Sales
Stock Turnover Ratio = 5 times
Closing Stock is Rs 12,000 more than the Opening Stock
Solution
The following stages has to be followed one by one to compute the Opening Stock and Closing Stock.
Step 1: First, Gross Profit has to be ascertained.
Step 2: From Gross Profit value, Cost of Goods Sold has to be worked out.
Step 3: From Cost of Goods Sold, value of Average Stock is ascertained by applying Stock Turnover Ratio.
Step 4: From the Stock Turnover Ratio, that is, after knowing Average Stock, Opening Stock and Closing Stock amounts have to be ascertained, finally.
Note: The factors are inter-related. So we have to unlock the secret information, i.e. indirect particulars to solve the problem.
Step 1: First Gross Profit is to be ascertained.
Gross Profit |
= |
25% on Sales |
(Given in Problem) |
||
|
= |
25/100 × Rs 6,00,000 |
|
= |
Rs 1,50,000 |
Step 2: From this value, Cost of Goods Sold has to be found out.
Remember: Cost of Goods Sold |
= |
Sales – Gross Profit |
|
= |
Rs 6,00,000 – Rs 1,50,000 |
|
= |
Rs 4,50,000 |
Step 3: After computing the value of Cost of Goods Sold, value of Average Stock is to be ascertained by applying the Stock Turnover Ratio.
Formula:
Stock Turnover Ratio |
= |
Cost of Goods Sold/Average Stock |
5 |
= |
Rs 4,50,000/Average Stock |
Average Stock × 5 |
= |
Rs 4,50,000 |
Average Stock |
= |
Rs 4,50,000/5 |
|
= |
Rs 90,000 |
Step 4: Finally, the value of Opening and Closing Stock has to be ascertained.
Let Opening Stock be Z (assumption).
Then Closing Stock = (Z + Rs 12,000)
(Given in the problem, i.e. Closing Stock is Rs 12,000 more than Opening Stock)
Remember:
|
|
= |
Average Stock |
|
Z + (Z + Rs 12,000) |
= |
Average Stock × 2 |
|
Z + (Z + Rs 12,000) |
= |
Rs 90,000 × 2 (From Step 3) |
|
2Z + Rs 12,000 |
= |
Rs 1,80,000 |
|
2Z |
= |
Rs 1,80,000 − Rs 12,000 |
|
|
= |
Rs 1,68,000 |
|
Z |
= |
Rs l,68,000/2 = Rs 84,000 |
|
i.e., Opening Stock |
= |
Rs 84,000 |
|
Closing Stock |
= |
(Rs 84,000 + Rs 12,000) |
|
|
= |
Rs 96,000 |
Illustration: 61
- Calculate Stock Turnover Ratio from the following information: Sales: Rs 2,00,000; Gross Profit Ratio: 25%
Opening Stock was 1/4th value of Closing Stock. Closing Stock was 40% of Sales.
- A business firm has a Current Ratio of 4:1 and a Quick Ratio of 1.2:1. Working Capital: Rs 1,80,000. Compute the Total Current Assets and Stock.
Solution
On the basis of information, the following has to be computed one by one:
Step 1: Gross Profit from Gross Ratio.
Step 2: Cost of Goods Sold from Gross Profit.
Step 3: Closing Stock, Opening Stock and Average Stock have to be worked out.
Step 4: Finally, Stock Turnover Ratio is to be found out.
Step 1: Gross Profit = 25% on Sales (Given)
|
= |
25/100 × Rs 2,00,000 |
|
= |
Rs 50,000 |
Step 2: Remember: Cost of Goods Sold = Sales – Gross Profit
|
= |
Rs 2,00,000 – Rs 50,000 |
|
= |
Rs 1,50,000 |
Step 3: Closing Stock = 40% of Sales (Given)
|
= |
40/100 × Rs 2,00,000 |
|
= |
Rs 80,000 |
Opening Stock is ¼th value of Closing Stock.
(Given in the Problem)
∴ Opening Stock |
= |
¼ Rs 80,000 |
|
= |
Rs 20,000 |
Average Stock |
= |
|
|
= |
|
|
= |
Rs 50,000 |
Step 4: Only after computing values for the above, Stock Turnover Ratio can be ascertained.
Formula: Stock Turnover Ratio |
= |
Cost of Goods Sold/Average Stock |
|
= |
Rs 1,50,000/Rs 50,000 |
|
= |
3 times |
Computation of Total Current Assets
Step 1: Current Ratio is 4:1 (Given)
Remember: Current Ratio |
= |
Current Assets/Current Liabilities |
4/1 |
= |
Current Assets/Current Liabilities |
* 1 × Current Assets |
= |
4 × Current Liabilities |
Working Capital |
= |
Rs 1,80,000 (Given) |
Remember: Current Assets – Current Liabilities |
= |
Working Capital |
Current Assets – Current Liabilities |
= |
Rs 1,80,000 |
4 × Current Liabilities – Current Liabilities |
= |
Rs 1,80,000 |
(As worked out in *) |
|
|
3 Current Liabilities |
= Rs 1,80,000 |
Current Liabilities |
= Rs 1,80,000/3 |
|
= Rs 60,000 |
∴ Current Assets |
= 4 × Current Liabilities |
|
= 4 × Rs 60,000 |
Total Current Assets |
= Rs 2,40,000 |
(ii) Computation of Stock
Quick Ratio formula is applied to compute Quick Assets first.
Remember: Quick Ratio |
= Quick Assets/Current Liabilities |
1.2/1 |
= Quick Assets/Rs 60,000 |
Quick Assets |
= Rs 60,000 × 1.2 |
|
= Rs 72,000 |
Remember: Stock |
= Current Assets – Quick Assets |
|
= Rs 2,40,000 – Rs 72,000 |
|
= Rs 1,68,000 |
Summary
Part A: Theory
- Accounting Ratio – Meaning and uses
- Ratio Analysis – Advantages – Limitations of Accounting Ratios
- Classification of Ratios:
- Various Ratios – Significance – Calculation (Refer the summarised form attached separately)
Part B:
- Remember formula to calculate various ratios.
- Once again remember various items included for each such category.
For example: Liquid Assets: Various items to be included in this: Cash-in-hand, Bank, Sundry Debtors, Bills Receivable, Short-term investments etc.
Note: The author does not want to repeat once again here. Students are asked to refer the main part of the chapter and remember the steps involved in the calculation of various ratios.
- Remember also, the standard parameter for each ratio. Based on that, suggest your ideas on the basis of results obtained.
Key Terms
Current Assets: Assets that can be converted to cash or sold or consumed within a year.
Current Liabilities: Liabilities that fall due within a year.
Current Ratio: Relationship between Current Assets and Current Liabilities.
Debt Equity Ratio: Common dividends per share divided by market price per share.
Earning Per Share (EPS): Net income divided by average no. of outstanding common share.
Inventory: Stock or Goods held by an entity for sale.
Inventory Turnover: The Cost of Goods Sold divided by the average inventory held during the period.
Owner’s Fquity: The residual interest in the company’s assets after deducting liabilities.
Price Earning (P/E) Ratio: Market Price per Share divided by Earning per Share.
Return on Sales Ratio: Net income divided by sales.
Short-term liquidity: A business entity’s ability to meet current liabilities on maturity date.
Shareholder’s Equity: Equity Assets over liabilities of company.
Total Assets Turnover: Sales divided by Average Total Assets.
Working Capital: The excess of Current Assets over Current Liabilities.
References
White Gerald I, “The analysis and use of financial statements”, John Wiley & Sons, New York 1998.
Helbert E.A., “Techniques of financial analysis”, Richard. D. Irwin, Homewood 911, 1972.
Horngreen, Sundem & Elliott, “Introduction to Financial Accounting”, Pearson Education, New Delhi, 2005.
A Objective-type Questions
I Fill in the blanks with opt terms
- Ratio is a ___________ relationship between two items expressed in a quantitative form.
- Ratio Analysis is a study of relationship among various ________ factors in a business.
- Ratio Analysis is a useful device for analyzing __________ statements.
- Ratio Analysis is a __________ device to spot out weak areas and take remedial measures quickly.
- Liquidity Ratios measure the _____________ solvency of a concern.
- The relationship of current assets to current liabilities is termed as _______ Ratio.
- By computing Current Ratio ______________ solvency of a concern is assessed.
- Satisfactory level of Current Ratio is _____________
- The excess of current assets over current liabilities is known as __________
- Liquid Ratio is a relationship of liquid assets with ________.
- Liquid Ratio is an indicator to assess the short-term _______ paying capacity of a concern.
- Favourable level of Liquid Ratio is __________
- ___________ Ratio studies the concern’s ability to meet its long-term financial position.
- ___________ Ratio indicates the proportion between debt and equity.
- Satisfactory level of Debt Equity Ratio is _________.
- Components of Total Assets to Debts Ratio are Total Assets and _________.
- Normal level of Total Assets to Debts Ratio is __________.
- Proprietary Ratio establishes the relationship between ______ and Total Tangible Assets.
- Normal level of Proprietary Ratio is ________.
- The relationship of Gross Profit to Sales is termed as _________.
- The relationship of Net Profit to Net Sales is termed as ________.
- Operating Profit Ratio measures the relationship between ___________ and Net Sales.
- Operating Ratio establishes relationship between __________ and Net Sales.
- Activity Ratios are also known as __________.
- __________ Ratios establish relationship between the Cost of Goods Sold and the average amount of inventory carried during the period.
- Debtors Turnover Ratio is also called as _______.
- __________ Ratio indicates how quickly debtors are converted into cash.
- Working Capital Turnover Ratio studies the relationship between _________ and working capital.
- Both Operating Profit Ratio and Operating Ratio are _________ to each other.
- Net result of Probability Ratios are expressed in __________.
Answers
- Mathematical
- Financial
- Financial
- Diagnostic
- Short-term
- Current
- Short-term
- 2:1
- Working Capital
- Current Liabilities
- Debt
- 1:1
- Solvency
- Debt Equity
- 2:1
- Debt
- 2:1
- Proprietor’s Funds
- 100
- Gross Profit Ratio
- Net Profit Ratio
- Operating Profit
- Operating Cost
- Turnover
- Inventory Turnover
- Receivables Turnover
- Debtors Turnover
- Sales
- complementary
- percentage
II State whether the following statements are True or False
- Ratio Analysis helps in financial forecasting.
- Liquidity Ratios measure the long-term solvency of a concern.
- A liquid asset is one that can very easily be converted into asset.
- Current Ratio is calculated for a particular period.
- Marketable securities are Current Assets.
- Overdraft (Bank/Bills) is current liability.
- Current Liabilities = Working Capital – Current Assets
- Liquid Ratio is used to assess the firm’s short-term solvency.
- A high Liquid Ratio indicates under stocking.
- Solvency Ratios study the concern’s ability to meet short-term indebtedness.
- A higher Debt Equity Ratio indicates safer financial position of an equity.
- In computing Solvency Ratios, fictitious assets do not form part of total assets.
- Long-term Debts, generally get matured after 1 year.
- A higher Total Assets to Debts Ratio indicates a risky financial position of the concern.
- In proprietor’s funds, payments to others are not included.
- A high level Proprietary Ratio indicates safety to creditors.
- Higher the Net Profit Ratio, better the efficiency of a concern.
- Loss on sale of assets is operating expenses.
- Higher Operating Ratio indicates poor performance of a concern.
- Higher Inventory Ratio indicates the concern’s high margin of profit.
Answers
1. True |
2. False |
3. True |
4. False |
5. True |
6. True |
7. False |
8. True |
9. False |
10. False |
11. False |
12. True |
13. True |
14. False |
15. True |
16. True |
17. True |
18. False |
19. True |
20. False |
B Multiple Choice Questions
III Choose the correct answer
- Ratio which measures the short-term solvency of a concern is
- Gross Profit Ratio
- Operating Ratio
- Proprietary Ratio
- Current Ratio
- Ratio to assess the short-term debt paying capacity of a concern is
- Liquid Ratio
- Debt Equity Ratio
- Creditors Turnover Ratio
- None of the above
- The ratio which is used to ascertain the soundness of the long-term financial position is
- Debt Equity Ratio
- Current Ratio
- Absolute Liquid Ratio
- Gross Profit Ratio
- Normal level for Proprietary Ratio is expected to be at
- 1:1
- 2:1
- 100
- 50
- If the Current Assets and Working Capital of a concern are Rs 80,000 and Rs 50,000 respectively then Current Liabilities will be
- Rs 1,00,000
- Rs 70,000
- Rs 1,30,000
- Rs 30,000
- The ratio which is a good indicator to maintain the correct selling price and efficiency of trading activities is
- Net Profit Ratio
- Gross Profit Ratio
- Current Ratio
- Liquid Ratio
- The relationship of Net Profit to Net Sales is termed as
- Gross Profit Ratio
- Net Profit Ratio
- Operating Profit Ratio
- None of the above
- If the value of Gross Profit and Indirect Expenses of a concern are Rs 4,00,000 and Rs 1,00,000 respectively the value of Net Profit will be
- Rs 5,00,000
- Rs 4,00,000
- Rs 3,00,000
- None of the above
- The Operating Profit and Net Sales of a firm are Rs 2,00,000 and Rs 10,000 respectively, then Operating Profit Ratio will be
- 20%
- 5%
- 50%
- 10%
- The ratio which indicates how quickly debtors are converted into cash is
- Receivables Turnover Ratio
- Inventory Turnover Ratio
- Working Capital Turnover Ratio
- Creditors Turnover Ratio
Answers
- (d),
- (a),
- (a)
- (c),
- (d),
- (b),
- (b),
- (c),
- (a),
- (a)
C Short Answer Questions
- What do you mean by “Ratio”?
- What is Ratio Analysis?
- Enlist the important objectives of Ratio Analysis.
- Enumerate the significance of Ratio Analysis.
- Mention the broad classification of ratios.
- How can Liquidity Ratios be classified?
- What do you mean by Current Ratio?
- How can Current Ratio be computed?
- Give examples for Current Assets.
- Mention items relating to Current Liabilities.
- What is the satisfactory level of Current Ratio?
- How can Working Capital be computed?
- Current Assets and Current Liabilities of a firm are Rs 3,00,000 and Rs 1,50,000. Calculate the Current Ratio and interpret the result.
- What is meant by Absolute Liquid Ratio?
- What are the Solvency Ratios?
- How can Debt Equity Ratio be calculated?
- How can Liquid Ratio be computed?
- How will you calculate Total Assets to Debts Ratio?
- What is the formula to compute Proprietary Ratio?
- What are the components of Proprietor’s funds?
- How can Gross Profit Ratio be computed?
- How will you calculate Net Profit Ratio?
- How Operating Profit Ratio can be found out?
- Write down the formula to calculate Operating Ratio.
- Mention the classification of Turnover Ratios.
- How Inventory Turnover Ratio can be computed?
- Mention the formula to compute Debtors Turnover Ratio.
- How can Working Capital Turnover Ratio be calculated?
D Essay-type Questions
- Explain Ratio Analysis. Enlist the objectives of Ratio Analysis. Explain its significance.
- What are the advantages and disadvantages of Ratio Analysis?
- Explain Liquidity Ratio. How are they useful in financial accounting? How the results of various Liquidity Ratios may be interpreted?
- How “Solvency” of a concern is determined? Explain the significance of various “Solvency Ratios”. Discuss their role in a concern to take important decisions.
- Enumerate the important role of some “Profitability Ratio”. Explain how they are helpful in determining the profit aspects of a concern.
- Mention some important “Activity Ratios”. Explain each of their role in decision making process of a growing concern.
E Exercises
1. The Current Assets of a company are Rs 1,26,000 and the Current Ratio is 3:2 and the value of inventories is Rs 2,000. Find out the Liquid Ratio.
Answer: 1.48:1
2. Inventory Turnover Ratio is 3 times sales are Rs 1,80,000. Opening Stock is Rs 2,000 more than the Closing Stock. Calculate the Opening and Closing Stock when goods are sold at 20% profit on cost.
Answer: Opening Stock: Rs 51,000
Closing Stock: Rs 49,000
3. A company had a Liquid Ratio of 1.5 and Current Ratio of 2 and Inventory Turnover Ratio 6 times. It had total Current Assets of Rs 8,00,000 in the year 2008. Find out the annual sales if goods are sold at 25% profit on cost.
Answer: Sales: Rs 15,00,000
4. A company earns a gross profit of 20% on cost. Its credit sales are thrice its cash sales. It credit sales are Rs 4,00,000. Calculate the Gross Profit Ratio of the company.
Answer: 16.67%
5. A company earns a gross profit of 25% on cost. Its credit sales are twice its cash sales. If the credit sales are Rs 8,00,000, compute the Gross Profit Ratio of the company.
Answer: 20%
6. Current Liabilities of a company are Rs 5,60,000, Current Ratio is 5:2, Quick Ratio is 2:1. Find the value of stock.
Answer: Rs 2,80,000
7. Calculate the Current Assets of a company from the following information:
- Stock Turnover: 4 times
- Gross Profit 20% on sales
- Stock in the end is Rs 20,000 more than stock in the beginning
- Sales: Rs 3,00,000
- Current Liabilities: Rs 40,000
- Quick Ratio: 0.75
Answer: Rs 1,00,000
8. X Ltd has a Liquid Ratio 7:3, value of stock is Rs 25,000 and its Current Liabilities Rs 75,000. Compute the Current Ratio.
Answer: 8:3
9. Cost of Goods Sold is Rs 2,00,000. Inventory Turnover is 8 times. Stock at the beginning is 1.5 times more than stock at the end. Compute the value of opening and closing stocks.
Answer: Opening Stock: Rs 20,000
Closing Stock: Rs 30,000
10. The ratio of Current Assets (Rs 6,00,000) to Current Liabilities (Rs 4,00,000] is 1.5:1. The accountant of the firm is interested in maintaining Current Ratio at 2:1 by paying off a part of Current Liabilities. Compute the Current Liabilities that should be paid off so as to maintain the Current Ratio at the level of 2:1.
Answer: Rs 2,00,000
11. Sales: Rs 4,00,000
Gross Profit: 25% on cost
Compute Gross Profit Ratio.
Answer: 20%
12. Rs 3,00,000 is the Cost of Goods Sold. Inventory Turnover is 8 times. Stock at the beginning is 2 times more than the stock at the end. Calculate the value of opening and closing stock.
Answer: Closing Stock: Rs 25,000
Opening Stock: Rs 50,000
13. Rs 4,00,000 is the Cost of Goods Sold. Inventory Turnover is 5 times. Stock at the beginning is 1.5 times more than the stock at the end. Calculate the values of opening and closing stock.
Answer: Opening Stock: Rs 25,000
Closing Stock: Rs 16,667
14. Compute the Gross Profit Ratio:
Sales: Rs 5,00,000; Gross Profit: 25% on cost
Answer: Gross Profit: Rs 1,00,000
Gross Profit Ratio: 20%
15. The Current Liabilities of a company are Rs 3,50,000. Its Current Ratio is 3 and Liquid Ratio is 1.75. Calculate (i) Current Assets (ii) Liquid Assets and (iii) Inventory
Answer:
- Current Assets: Rs 10,50,000
- Liquid Assets: Rs 6,12,500
- Inventory: Rs 4,37,500
16.
|
Rs |
Net Sales |
3,75,000 |
Cost of Goods Sold |
2,50,000 |
Current Liabilities |
1,20,000 |
Loan |
60,000 |
Current Assets |
4,25,000 |
Equity Share Capital |
1,90,000 |
Debentures |
75,000 |
From the above information calculate (i) Gross Profit Ratio (ii) Debt Equity Ratio and (iii) Working Capital Turnover Ratio.
Answer:
- Gross Profit Ratio: 33 1/3%
- Debt Equity Ratio: 27:38
- Working Capital
Turnover Ratio: 1.22 times
17. The Current Assets of a company are Rs 15,00,000. Its Current Ratio is 3.00 and Liquid Ratio is 1.25. Calculate the amount of (i) Current Liabilities (ii) Liquid Assets and (iii) Inventory.
Answer:
- Current Liabilities: Rs 5,00,000
- Liquid Assets: Rs 6,25,000
- Inventory: Rs 8,75,000
18. The Current Ratio of a company is 3.0 and its Liquid Ratio is 1.15. Its Current Liabilities are Rs 3,00,000. Compute (i) Current Assets (ii) Liquid Assets and (iii) Inventory.
Answer:
- Current Assets Rs 9,00,000
- Liquid Assets: Rs 3,45,000
- Inventory: Rs 5,55,000
19. The Current Assets of a company are Rs 17,00,000. Its Current Ratio is 2.50 and Liquid Ratio is 0.95. Calculate (i) Current Liabilities (ii) Liquid Assets and (iii) Inventory.
Answer:
- Current Liabilities: Rs 6,80,000
- Liquid Assets: Rs 6,46,000
- Inventory: Rs 10,54,000
20. From the following details, compute (i) Gross Profit Ratio (ii) Stock Turnover Ratio and (iii) Operating Ratio:
|
Rs |
Sales |
1,50,000 |
Cost of Goods Sold |
1,20,000 |
Opening Stock |
29,000 |
Closing Stock |
31,000 |
Debtors |
16,000 |
Net Fixed Assets |
1,10,000 |
Answer:
- Gross Profit Ratio: 20%
- Stock Turnover Ratio: 4 times
- Operating Ratio: 90.66%
21. From the following information, calculate (i) Current Ratio (ii) Quick Ratio and (iii) Working Capital Turnover Ratio:
|
Rs |
Sundry Debtors |
4,00,000 |
Stock |
1,60,000 |
Marketable Securities |
80,000 |
Cash |
1,20,000 |
Prepaid Expenses |
40,000 |
Bills Payable |
80,000 |
Sundry Creditors |
1,60,000 |
Debentures |
2,00,000 |
Expenses Payable |
1,60,000 |
Net Sales |
20,00,000 |
Answer:
- Current Ratio: 2:1
- Quick Ratio: 1.5:1
- Working Capital Turnover Ratio = 5 times
22. From the particulars given below, calculate (i) Current Ratio (ii) Acid Test Ratio (iii) Working Capital Turnover Ratio:
|
Rs |
Fixed Assets |
1,00,000 |
Stock |
37,200 |
Debtors |
19,200 |
Cash |
39,600 |
Prepaid Expenses |
10,000 |
Creditors |
36,000 |
Bank Overdraft |
17,000 |
Reserves |
10,000 |
Net Sales |
31,800 |
Answer:
- Current Ratio: 2:1
- Acid Test Ratio: 1.11:1
23.
- From the given information, calculate the Stock Turnover Ratio.
Sales: Rs 2,00,000; G.P.: 25% on Cost; Operating Stock: 1/3rd of the value of closing stock; Closing Stock: 30% of Sales.
- A business has a Current Ratio of 3:1 and Quick Ratio of 1.2:1. The Working Capital is Rs 1,80,000. Compute the Total Current Assets and Stock.
Answer:
- 4 times
-
- Rs 2,70,000
- Rs 1,62,000
24. From the given information, calculate the Stock Turnover Ratio:
Sales: Rs 2,00,000; G.P.: 25%; Opening Stock was 1/4th value of closing stock. Closing Stock was 20% of Sales.
Answer: 6 times
25. A business has a Current Ratio of 2:1 and a Quick Ratio of 1.2:1. Working Capital is Rs 1,50,000. Calculate Total Current Assets and Stock.
Answer:
- Total Current Assets: Rs 3,00,000
- Stock: Rs 1,20,000
26. On the basis of the particulars given below, calculate (i) Operating Ratio (ii) Liquid Ratio and (iii) Proprietary Ratio.
Cash Sales: Rs 3,00,000; Credit Sales: Rs 2,80,000; Sales Returns: Rs 20,000; Cost of Goods Sold: Rs 4,00,000; Selling and Distribution Expenses: Rs 7,000; Administrative Expenses: Rs 8,000; Current Liabilities: Rs 2,30,000; Current Assets: Rs 4,00,000; Closing Stock: Rs 40,000; Equity Share Capital: Rs 5,00,000; 8% Preference Share Capital: Rs 2,00,000; Fixed Assets: Rs 5,50,000.
Answer:
- Operating Ratio: 74.1%
- Liquid Ratio: 36:23
- Proprietary Ratio: 73.68%
27. On the basis of the following information you are required to calculate (i) Operating Ratio (ii) Liquid Ratio and (iii) Proprietary Ratio. Cash Sales: Rs 4,00,000; Credit Sales: Rs 2,75,000; Sales Returns: Rs 27,000; Cost of Goods Sold: Rs 3,90,000; Selling and Distributive Expenses: Rs 7,000; Administrative Expenses: Rs 3,000; Current Liabilities: Rs 1,95,000; Current Assets: Rs 3,94,000; Closing Stock: Rs 23,000; Equity Share Capital: Rs 4,37,000; Preference Share Capital: Rs 1,74,000; Fixed Assets: Rs 4,30,000.
Answer:
- Operating Ratio: 61.72%
- Liquid Ratio: 1.9:1
- Proprietary Ratio: 74.15%
EXERCISES (CONTINUED – MODELWISE)
Model 1: Current Ratio
28.
- From the following, calculate the Current Ratio:
Rs
Cash-in-hand
2,50,000
Sundry Debtors
1,50,000
Stock-in-trade
2,00,000
Sundry Creditors
2,00,000
Bills Payable
1,00,000
- From the following, compute Current Ratio:
Rs
Stock
30,000
Sundry Debtors
20,000
Cash or Bank
8,000
Bills Receivable
15,000
Short-term Investments
25,000
Prepaid Expenses
2,000
Bank Overdraft
15,000
Sundry Creditors
20,000
Bills Payable
10,000
Outstanding Expenses
5,000
Answer:
- 2:1
- 2:1
Model 2: Liquid Ratio or Acid Test Ratio or Quick Ratio
29. Calculate Liquid Ratio from the following:
|
Rs |
Cash |
15,000 |
Bills Receivable |
20,000 |
Stock |
22,000 |
Creditors |
17,000 |
Outstanding Expenses |
2,000 |
|
Rs |
Debtors |
20,000 |
Short-term Investment |
20,000 |
Prepaid Expenses |
3,000 |
Bills Payable |
6,000 |
Answer: 47:26
30. Calculate Current Ratio and Liquid Ratio from the following balance sheet:
Balance Sheet of Swarna Ltd as on Mar 31, 2007

Answer:
- Current Ratio = 8:5
- Liquid Ratio = 5:7
Model 3: Absolute Liquid Ratio
31. Calculate Absolute Liquid Ratio.
|
Rs |
Cash-in-hand |
2,000 |
Cash at Bank |
3,000 |
Short-term Investments |
5,000 |
Current Liabilities |
30,000 |
Bank Overdraft |
10,000 |
Answer: 5:1
Model 4: Debt Equity Ratio
32. Calculate Debt Equity Ratio from the following:
|
Rs |
Debentures |
3,00,000 |
Loan from Banks |
2,00,000 |
Equity Share Capital |
1,75,000 |
Reserves and Surpluses |
75,000 |
Answer: 2:1
Model 5: Proprietary Ratio
33. Calculate Proprietary Ratio from the following:
|
Rs |
Equity Share Capital |
2,00,000 |
Preference Share Capital |
1,00,000 |
Reserves and Surpluses |
1,00,000 |
Machinery |
1,00,000 |
Goodwill |
40,000 |
Cash at Bank |
40,000 |
Stock |
60,000 |
Answer: 16.66%
34. Calculate Gross Profit Ratio from the following:
|
Rs |
Purchases |
3,15,000 |
Opening Stock |
15,000 |
Closing Stock |
30,000 |
Sales |
4,00,000 |
Answer: 25%
Model 7: Net Profit Ratio
35. Calculate Net Profit Ratio from the following:
|
Rs |
Net Profit |
50,000 |
Sales |
2,50,000 |
Answer: 20%
36. From the given data, calculate
- Gross Profit Ratio
- Net Profit Ratio
- Current Ratio
|
Rs |
Sales |
6,00,000 |
Net Profit |
60,000 |
Current Liabilities |
60,000 |
Cost of Goods Sold |
4,00,000 |
Current Assets |
1,20,000 |
Answer:
- 33⅓%
- 10%
- 2:1
Model 8: Operating Profit Ratio
37. From the following data, compute the Operating Profit Ratio:
|
Rs |
Net Profit |
2,00,000 |
Loss on Sale of Machine |
10,000 |
Profit on Sale of Investment |
40,000 |
Interest Paid on Loan |
40,000 |
Interest from Investments |
60,000 |
Sales |
3,00,000 |
Answer: 50%
38. Calculate Operating Profit Ratio from the following:
|
Rs |
Gross Profit |
1,50,000 |
Sales |
9,07,500 |
Operating Expenses |
60,000 |
Sales Return |
7,500 |
Answer: 10%
39. Calculate Operating Ratio from the following:
|
Rs |
Cost of Goods Sold |
4,50,000 |
Operating Expenses |
50,000 |
Sales |
10,12,500 |
Sales Returns |
12,500 |
Answer: 50%
40. From the following, calculate Operating Ratio:
|
Rs |
Cost of Goods Sold |
6,25,000 |
Operating Expenses |
75,000 |
Sales |
14,13,900 |
Sales Returns |
13,900 |
Answer: 50%
Model 10: Capital Turnover Ratio
41. Compute Capital Turnover Ratio, from the following:
|
Rs |
Cash Sales |
2,40,000 |
Credit Sales |
2,72,000 |
Sales Return |
12,000 |
Equity Share Capital |
1,00,000 |
Long-term Loan |
90,000 |
Reserves and Surpluses |
60,000 |
Answer: 2 Times
42. From the following, compute Capital Turnover Ratio:
|
Rs |
Cash Sales |
3,10,000 |
Credit Sales |
3,97,600 |
Sales Return |
7,600 |
Equity Share Capital |
2,00,000 |
Long-term Loan |
1,00,000 |
Reserves and Surpluses |
50,000 |
Answer: 2 Times
Model 11: Fixed Assets Turnover Ratio
43. Compute Fixed Assets Turnover Ratio from the following:
|
Rs |
Fixed Assets |
5,50,000 |
Depreciation on Fixed Assets |
50,000 |
Sales |
10,08,750 |
Sales Return |
8,750 |
Answer: 2 Times
44. Calculate Fixed Assets Turnover Ratio from the following:
|
Rs |
Sales |
16,19,875 |
Sales Return |
19,875 |
Fixed Assets |
4,60,000 |
Depreciation on Fixed Assets |
60,000 |
Answer: 4 Times
Model 12: Stock Turnover Ratio
45. Calculate Stock Turnover Ratio from the following:
|
Rs |
Cost of Goods Sold |
6,00,000 |
Opening Stock |
1,00,000 |
Closing Stock |
2,00,000 |
Answer: 4 Times
46. Compute Stock Turnover Ratio from the following:
|
Rs |
Sales |
4,50,000 |
Gross Profit |
50,000 |
Stock |
75,000 |
Answer: 5.3 Times
Model 13: Debtors Turnover Ratio
47. Calculate Debtors Turnover Ratio from the following data:
|
Rs |
Cash Sales |
60,000 |
Total Sales |
2,20,000 |
Debtors at the beginning of the year |
75,000 |
Debtors at the closing of the year |
85,000 |
Answer: 2 Times
48. Compute Debtors Turnover Ratio from the following:
|
Rs |
Total Sales |
12,50,000 |
Sales Return |
50,000 |
Opening Debtors |
1,05,000 |
Closing Debtors |
95,000 |
Answer: 12 Times
Model 14: Creditors Turnover Ratio
49. Compute Creditors Turnover Ratio from the following:
|
Rs |
Credit Purchases |
4,80,000 |
Opening Creditors |
55,000 |
Closing Creditors |
65,000 |
Answer: 8 Times
50. Compute Creditors Turnover Ratio from the following:
|
Rs |
Total Purchases |
2,05,000 |
Cash Purchases |
40,000 |
Purchases Return |
5,000 |
Opening Creditors |
55,000 |
Closing Creditors |
25,000 |
Answer: 4 Times
Model 15: Miscellaneous (Comprehensive) (Combination of Ratios)
51. From the following balance sheet, calculate Current Ratio and Proprietary Ratio: Balance Sheet of Felix Ltd as on Mar 31, 2007.

- Current Ratio = 0.8:1
- Proprietary Ratio = 2.3:3.5
52. The following is the Profit and Loss Account of a company for the year ending Mar 31, 2007.

You are required to prepare
- Gross Profit Ratio
- Net Profit Ratio
- Operating Ratio
- Stock Turnover Ratio
Answer:
- 28.5%
- 57%
- 71.4%
- 5 Times
53. From the following balance sheet of X Ltd, you are required to calculate
- Debt Equity Ratio
- Proprietary Ratio
- Current Ratio
- Fixed Assets Turnover Ratio

- 1:8
- 4:5
- 2:1
54. From the following, calculate
- Operating Profit Ratio
- Operating Ratio
- Gross Profit Ratio
- Net Profit Ratio
|
Rs |
Sales |
2,00,000 |
Gross Profit |
40,000 |
Administrative Expenses |
3,000 |
Selling Expenses |
2,000 |
Loss on Sale of Investments |
2,000 |
Dividend Received |
1,000 |
Net Profit |
30,000 |
Answer:
- 15.5%
- 82.5%
- l20%
55. Following is the summarised Trading and Profit and Loss A/c for the year ending Mar 31, 2007 and the Balance Sheet as on that date:

Balance Sheet as on Mar 31, 2007
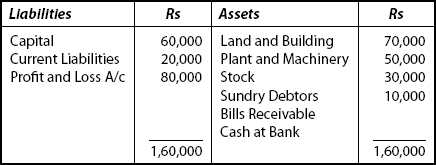
Calculate :
- Gross Profit Ratio
- Operating Ratio
- Return on Capital Employed
Answer:
- 60%
- 67.5%
- 50%
56. Calculate the amount of Gross Profit:
Average Stock: Rs 50,000
Stock Turnover Ratio: 10 times
Selling Price: 20% above Cost
Answer: Rs 1,00,000
57. Calculate Cost of Goods Sold:
Sales: Rs 15,00,000; Sales Return: Rs 1,00,000
Operating Expenses: Rs 50,000; Operating Ratio = 90%
Answer: Rs 12,10,000
58. Calculate Opening Stock and Closing Stock:
Total Sales: Rs 10,00,000
Gross Profit: 20% on Sales
Stock Turnover Ratio: 5 times
Closing Stock is Rs 20,000 more than Opening Stock
Answer:
- Cost of Goods gold: Rs 8,00,000
- Opening Stock: Rs 1,50,000
- Closing Stock: Rs 1,70,000
59. A trader carries an average stock of Rs 20,000. His Stock Turnover is 5 times. If he sells goods at a profit of 25% on sales, calculate the profit.
Answer: Rs 25,000
60. Debt collection period of X Ltd is 36 days. Sales affected during the year were Rs 5,00,000. Assuming 360 days in a year, calculate Debtors Turnover Ratio; Average Debtors; Debtors on Jan 01, 2006 and Dec 31, 2006, if the debtors at the end are Rs 20,000 more than those in the beginning.
Answer:
- Debtors Turnover Ratio = 10 Times
- Debtors on 1. 1. 2006: Rs 40,000
- Debtors on 31. 12. 2006: Rs 60,000
61. Current Liabilities are Rs 50,000; Liquid Ratio is 2:1; Current Ratio is 3:1. Calculate Quick Assets, Stock-in-trade and Current Assets.
Answer:
- Quick Assets: Rs 1,00,000
- Stock-in-trade: Rs 50,000
- Current Assets: Rs 1,50,000
62. Calculate Return on Equity:
|
Rs |
Equity Share Capital |
1,50,000 |
10% Prof. Share Capital |
1,00,000 |
Reserves and Surpluses |
5,00,000 |
Net Profit after Tax |
2,10,000 |
Answer: 28%
63.
|
Rs |
Share Capital |
1,00,000 |
General Reserve |
50,000 |
12% Loan |
50,000 |
Sales for the year |
2,00,000 |
Tax paid |
10,000 |
Profit after Tax and Dividend |
20,000 |
From the above information, you are required to calculate:
- Debt Equity Ratio
- Capital Turnover Ratio
- Interest Coverage Ratio
- Return on Equity
- Debt to Total Fund Ratio
Answer:
- Debt Equity Ratio = 1:2
- Capital Turnover Ratio = 2 Times
- Interest Coverage Ratio = 6 Times
- Return on Equity = 30%
- Debt to Total Fund Ratio = 1:3
64. The following data relates to Shree Ltd.
|
2008 (Rs) |
2009 (Rs) |
Sales |
20,00,000 |
25,00,000 |
Cost of Goods Sold |
10,00,000 |
12,00,000 |
Gross Profit |
2,00,000 |
2,50,000 |
The Manager claims that he has worked more efficiently during the year 2006 because the Gross Profit has increased by Rs 50,000 and should be rewarded for his efficiency of service.
Give your opinion to the management to decide upon manager’s claim.
65. From the following information, comment on the efficiency of the working of the company:
| 2008 (Rs) | 2009 (Rs) | |
|---|---|---|
Sales |
4,00,000 |
6,00,000 |
Cost of Goods Sold |
3,00,000 |
4,00,000 |
Gross Profit |
2,00,000 |
2,50,000 |
Operating Expenses |
50,000 |
1,00,000 |
Operating Profit |
1,00,000 |
1,00,000 |