Chapter 10. Sharing Your Excel Prototype
• Use your prototype for collaboration
• Mitigate the risks of implementing a finished prototype
• Avoid the risks in sharing your prototype
• Denote your prototype's interaction methods
Introduction
Your prototype is finished—now what? The way you share your prototypes with others and present them will determine the effectiveness of your designs and the impact they will have. Excel has many features that can help you effectively share your prototypes with other stakeholders. The process of sharing your design to achieve buy-in from the various stakeholders includes three important activities:
• Collaboration. Designing interactively with your colleagues, either in synchronous group interactive sessions or asynchronously, either ping-ponging prototype versions back and forth or synthesizing competing visions.
• Presentation. The way a prototype and accompanying explanations are communicated to the target audience.
• Evaluation. The assessment of the design embodied in your prototype by both internal and external stakeholders.
Using Your Prototype for Collaboration
Rarely is a prototype the product of a single person's effort. Often many people play roles in the design process. They all have some ownership of the iterations of prototypes that go into creating software. An early prototype might begin as a product manager's idea, but during the course of the design and implementation process, others will contribute their expertise and ideas. In today's world of global software creation, the people who participate in any prototyping activity might not even be on the same continent.
We have participated in many workshops in which we brainstormed on software designs by opening an Excel prototyping template and beginning to visualize ideas. Someone will start with an idea for a design. We create the designs without spending time to make them look pixel-perfect, because Excel nearly automatically handles alignments and styles. The prototypes are clear enough for everyone to understand the ideas behind them. If some members of the design team are not available in the same physical space, we share the Excel files over the Internet by using meeting applications such as WebEx. Sometimes a participant tries to contribute an idea but cannot explain it adequately, either because English is not his first language or because he speaks a specialized domain language that not everyone understands. In such cases, we hand over the Excel file to that person, who can quickly show us in Excel what he is thinking. This way, when people are creating a real-time prototype, misunderstandings and mismatches in expectations are immediately identified.
Excel can be an even more powerful tool to help clarify competing visions and conceptual misunderstandings. When you create a prototype and distribute it to stakeholders, the feedback you receive will immediately show you whether you have hit the mark or not. With Excel, the advantage is that design team members can annotate or correct designs by directly changing the Excel files. This eliminates the dependency on a single gatekeeper prototyper or being limited to a prototyping tool that few participants know. Moreover, sharing Excel prototypes levels the playing field so everyone can contribute. People who are more visually oriented and less articulate in meetings are empowered to visualize their ideas.
Excel can display a worksheet that is many screens deep by using a scroll bar. This can be a tremendous advantage if the content of your designs extends vertically below the visible area of the screen. Rather than showing designs at a reduced size or across multiple slides, as PowerPoint requires, you can present your designs in one screen scaled at 100 percent. Having a scroll bar also mimics how a user would see your design in a browser or perhaps as a client application. This single benefit can outweigh the other display features that come with a presentation application, such as PowerPoint.
Another form of collaboration is to have your prototype evaluated by internal stakeholders and objective external reviewers. Just as with other prototypes, Excel prototypes can be evaluated. For example, cognitive walkthroughs or interactive demos are among the methods that can be used in the different evaluation settings, such as usability testing, focus groups, and participatory design sessions. Whatever the evaluation or review techniques, it is important to avoid any potential risks with Excel prototypes.
Mitigating the Risks of Implementing a Finished Prototype
Why is sharing the results of a prototype the riskiest step in the prototyping process? What happens after you've finished your prototype can be unpredictable for four reasons:
• Engineering can't implement the design. If a prototype is designed without due consideration for the way it is to be implemented or without regard for adequate resources, the engineering team might go its own way with implementing—or not implementing—your design, creating tension between the design team and the engineering team.
• Competing prototypes. Multiple simultaneous prototypes within the context of a given design effort might offer differing and conflicting design directions. This happens when different prototypes are created by different parts of a larger software team, each unaware of what the other is doing. This is usually the result of either inadequate or no program management.
• Outdated prototypes. What happens when a prototype is no longer current? A prototype is generally created for a specific stage of the software creation process. Neither time nor requirements nor concept stand still during the software design and implementation stages. Watch for prototypes that degrade rapidly over a short period of time. An outdated prototype can compromise the outcome of a product design effort.
• Misunderstanding and misinterpretation. How is the audience of a prototype to know the primary intent of your design and how it should be interpreted? An audience can misinterpret the design intent of a prototype by not understanding its objectives, purpose, or design criteria. For example, a prototype meant to be merely proof of an innovative design concept can be confused with a finished design if the prototype's fidelity is too high and its intent is not clearly communicated.
How do you mitigate these risks by prototyping in Excel?
Engineering Can't (or Doesn't Want to) Implement Your Design
Your presentation should include a roadmap from the current design instantiation to the final design to be implemented. Be sure to share the Excel prototype with all your product stakeholders and go over the various design and requirements details with them before the presentation. The Excel prototype can either be shared during a meeting, where you can interactively work on it with your stakeholders, or distributed so that they can mark it up and return it to you.
Be sure that the design concepts of a prototype can be implemented by socializing your designs with the engineering team. What seemed to be possible in the beginning of a project might no longer be possible just weeks before code freeze—and definitely not possible during system testing. Again, solutions to issues found as a result of evaluation need to be reviewed carefully and signed off by the product stakeholders to assure they can be implemented.
Competing Prototypes
A simple process rule suggests that you never let any of the members of your product team prototype in isolation or diverge from the agreed-on product design plan. Assure that all prototyping activities are included in the project plan, even those by developers used for proof of concepts. These proof-of-concept prototypes can often undermine your design efforts by introducing conflicting design ideas that are orthogonal to the overall agreed-on design direction. In a presentation, everyone in development involved in prototyping should be present and actively participating. Include all stakeholders at your presentations and design reviews.
Outdated Prototypes
Archive outdated prototypes from project servers, project folders, and so on. Ensure that anyone who has seen the older versions of the prototype knows that a new one supersedes previous versions. Meet with stakeholders to inform them of and discuss the differences, and leave nothing to chance.
During a prototype presentation, provide a schedule of the future updates and other prototyping activities such as future validation testing, reiterations, and so on. Outline the types of changes that are anticipated. Early in the design process there could be conceptual changes, so developing to early conceptual prototypes is very risky. Later in the product design process, when no major changes are expected, developing to a more refined prototype is less risky—as long you allow for last-minute changes and refinements. Set everyone's expectations for the possibility of changes ahead.
After an evaluation takes place, the prototype is out of date. Planning of the evaluation activities must be clearly communicated to everyone. Published results should be made available to everyone and whenever possible integrated into the prototype.
You can integrate results into an Excel prototype in five ways:
• Insert an executive summary of the results in the first worksheet of the prototype.
• Include hyperlinks on the areas of the prototype using cell-based hyperlinks that take the user to the related evaluation results.
• Include text boxes to place the relevant results right over the prototype itself.
• On the old prototype, mark clearly that it is out of date, and then place links in the old prototype to the new designs in the new prototype. If the new prototype is not Excel and pinpointing the design is not possible, use a cell comment or hyperlink tooltip to explain where they can find the design in the new prototype.
• Make it a policy to place an expiration date in a prominent place on every prototype. For example, using Excel's text box feature, you can put an expiration date in the upper-left corner, which will not interfere with any cell-level-based designs or hyperlinks.
Misunderstanding and Misinterpretation
During a presentation, the moment can come when it seems that magic happens: Everything seems logical and intuitive. This is usually because someone is narrating a preconceived scenario to fit the design that was created. As long as the scenario is credible, the prototype comes across as effective and brilliant. But what can get lost in such a presentation is what, exactly, one is supposed to learn from the prototype. It might be impossible to distinguish what was temporarily added to support the flow of the scenario from what is the core, agreed-on design direction embodied in the prototype. To avoid any confusion, annotations can be created within Excel to communicate what has been and has not been tested.
For more details about annotations, see Chapter 9.
Tips for Avoiding the Risks in Sharing Your Prototypes
The following tips are all designed to help you avoid the risks of sharing a prototype. Prototypes too often get bogged down in details that the product team never intended to demonstrate, but the details are nevertheless employed to help set context. One solution is to reduce the fidelity to mask these distracting details. Sometimes these details are essential to help an audience understand important aspects of a prototype and the conceptual design it represents. Some ways to control what you're trying to communicate with your prototype include
• Using a summary worksheet
• Setting the appropriate fidelity level
• Setting the appropriate visual emphasis
• Signaling how someone can interact with your prototype
• Tips to improve the visual appearance of the prototype
Using a Summary Worksheet
Setting expectations at the onset is essential. It helps to make sure that you adequately address the established requirements and the defined task flow, which are the focal points of the prototype. This can be done verbally in a meeting but can be quickly forgotten. It is much better to give the audience a short summary of these points. If you are distributing your prototype, you can include this summary as a kind of cover worksheet. In the downloadable files on our Effective Prototyping Website, we include a sample summary worksheet that you can copy and modify for your purposes. In addition to a summary, the key design requirements and task flow diagram can be included as worksheets that link to related screen design worksheets.
Setting the Appropriate Fidelity Level
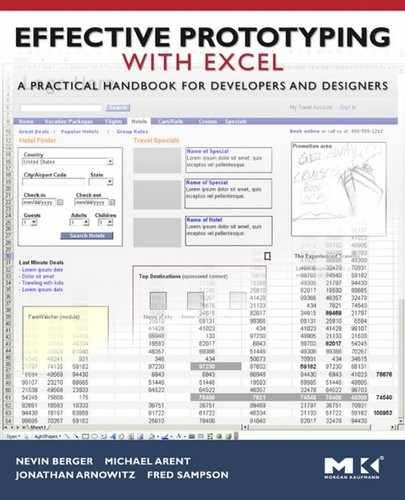
Modulating degrees of fidelity within and across prototypes can be a powerful means of controlling what users focus on in your prototypes relative to what you are trying to portray and communicate. For example, one method for focusing the user on the right prototype characteristics is to reduce the fidelity of unimportant but contextually helpful characteristics. If you're displaying a wireframe to show a new visual design direction, one way of controlling what the viewer focuses on is to greek the text to prevent the viewer from getting immersed in the editorial content.
Setting the Appropriate Visual Emphasis
Another method for directing the user's attention where you want it is to deemphasize the parts of the design that don't require focus. This method involves toning down the unimportant areas of prototype screens by reducing their opacity; that is, modulating their translucency. For example, you're prototyping a new screen layout for a business application. Two elements in the prototype are two controversial data tables, which are not part of your design. You do not want the conversation to focus on these tables. To avoid that, you can lay a translucent shape over the table to preserve it as part of the larger context but diminish its potential for distraction.
To Create a Translucent Overlay:
For this exercise, deemphasize the table in the prototype screen design (Figure 10.1, page 194) by reducing its contrast relative to the background. Start by first laying a rectangle over the tables and then reducing its opacity so that the table elements are more subdued.

1 Choose the rectangle AutoShape; then draw a rectangle over the two tables that are to be overlaid (Figure 10.2, page 194).

2 While it's still highlighted, right-click the rectangle AutoShape and select Format AutoShape from the menu (Figure 10.3, page 195).

3 In the Format AutoShape dialog box, specify the desired amount of translucency for the overlaid shape. In this case, enter 30% transparency. To maximize the translucent effect and avoid visual confusion, choose the Line Color, No Line for the overlay, which eliminates the rectangle's unnecessary outline border (Figure 10.4).

With the overlay in place, the table portion of the screen is visually deemphasized while still sufficiently visible for reference (Figure 10.5, page 196).

Denoting Your Prototype's Interaction Methods
• Creating simple click-through interaction
• Improving the appearance and presentation of your Excel prototypes
Creating a Simple Click-Through Interaction:
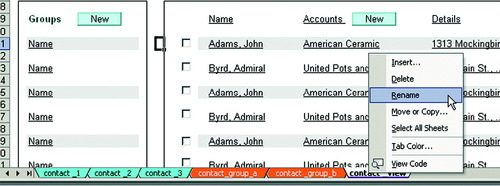
The tab bar at the bottom of the worksheet area affords simplified linear and nonlinear click-through navigation of your prototype for presentations. As you're presenting your designs to an audience, they will inevitably have questions and discussions that require returning to earlier presented worksheets. To support this type of use, you can use a naming convention such as numbering that will make it easy for you to navigate among your prototype screens. You can also organize your tabs by color-coding them to help you quickly orient and reorient yourself.
To Name a Tab:
1 Right-click the worksheet tab.
2 Select Rename from the menu (Figure 10.6).
3 Type a new name into the selected tab.
To Color a Tab:
2 Select Tab Color (Figure 10.7).

3 Choose a color from the color palette (Figure 10.8).

Now that you have renamed and recolored the tabs, you can now present your prototype screens by simply clicking through the tabs in the order that is appropriate for your presentation.
Identifying Which Links Work and Which Are Just Mocked Up
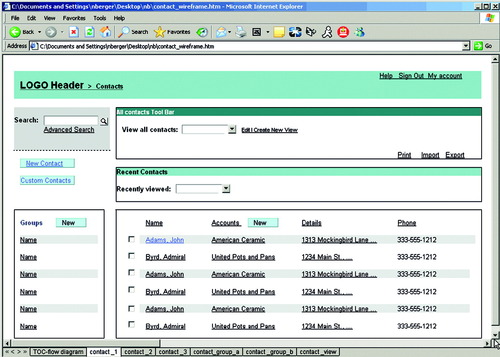
One recommendation for this type of presentation is to distinguish which links are functional from those that aren't by displaying the functional links in blue (with or without underlines) and the nonfunctional links in black with underlines (Figure 10.9). This is important to signal to the presenter or anyone else using this prototype which links are clickable and which are not (Figure 10.10).


Improving the Appearance and Presentation of Your Excel Prototypes
You can modify the Excel application user interface to achieve better visual presentations. To clear out some of the distracting visual screen clutter, start by closing any unneeded toolbars. From the View > Tools menu, deselect any toolbars that are not needed for your presentation (Figure 10.11, page 200).

Choosing Tools > Options > View, you can hide the row and column headers by deselecting that option in the Options dialog box (Figure 10.12, page 200).
 |
| Figure 10.12 |
Hiding the row and column headers allows your design to take full advantage of the worksheet width and removes extraneous visual elements that might detract from the presentation. In this dialog box you can also deselect the Sheet tabs setting that hides the tabs at the bottom of the worksheet. Although you might not want to hide the tabs if you plan to use them to navigate your presentation, you can still navigate from one worksheet tab to the next via Ctrl-PgUp and Ctrl-PgDn (Figure 10.13, page 201).

Another way to present your Excel prototype designs in a more streamlined and effective way is by saving the workbook as an HTML file and then using that as a presentation artifact. Saving as HTML
• Allows a browser user interface without the application user interface trappings of Excel.
• Affords a minimum of function bars that might distract from your presentation.
• Provides a convincing way to display your work to others, especially if your designs are meant to represent a Website or application.
• Allows you to show your designs virtually anywhere in the world by posting them on a Website and sending its URL to your stakeholders.
To save your prototype as HTML, in the Save As dialog box, select Web Page in the Files of type menu (Figure 10.14 and Figure 10.15).

Some Excel features do not translate directly into HTML. Centered or right-justified text reverts to left justified. Sometimes the positioning of graphics will be shifted slightly—enough to be annoying. If you have removed the tabs from the workbook, they will still show up at the bottom of the Web page with the names that you assigned them, but they will not maintain any colors you might have assigned to them.
Conclusion
Good preparation, thorough documentation, and thoughtful presentation and evaluation can ensure buy-in from stakeholders for your design and can make your prototype useful throughout the design and development process. Selective use of presentation devices ensures an effective presentation of your prototype.
References
[1] Jonathan, Arnowitz; Michael, Arent; Nevin, Berger, Effective Prototyping for Software Makers. (2007) Morgan Kaufmann, San Francisco.
..................Content has been hidden....................
You can't read the all page of ebook, please click here login for view all page.