
The combination of math, computer programming, and domain knowledge is what makes data science so powerful. Oftentimes, it is difficult for a single person to master all three of these areas. That's why it's very common for companies to hire teams of data scientists instead of a single person. Let's look at a few powerful examples of data science in action and their outcomes.
Social security claims are known to be a major hassle for both the agent reading it and the person who wrote the claim. Some claims take over two years to get resolved in their entirety, and that's absurd! Let's look at the following diagram, which shows what goes into a claim:
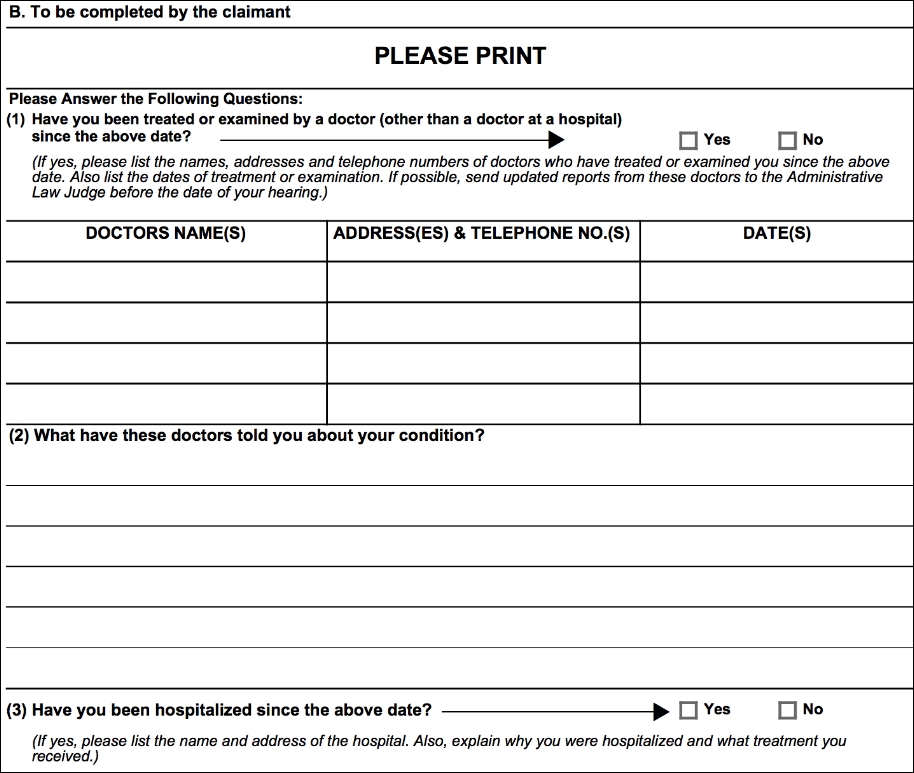
Sample social security form
Not bad. It's mostly just text, though. Fill this in, then that, then this, and so on. You can see how it would be difficult for an agent to read these all day, form after form. There must be a better way!
Well, there is. Elder Research Inc. parsed this unorganized data and was able to automate 20% of all disability social security forms. This means that a computer could look at 20% of these written forms and give its opinion on the approval.
Not only that—the third-party company that is hired to rate the approvals of the forms actually gave the machine-graded forms a higher grade than the human forms. So not only did the computer handle 20% of the load on average, it also did better than a human.
Before I get a load of angry emails claiming that data science is bringing about the end of human workers, keep in mind that the computer was only able to handle 20% of the load. This means that it probably performed terribly on 80% of the forms! This is because the computer was probably great at simple forms. The claims that would have taken a human minutes to compute took the computer seconds. But these minutes add up, and before you know it, each human is being saved over an hour a day!
Forms that might be easy for a human to read are also likely easy for the computer. It's when the forms are very terse, or when the writer starts deviating from the usual grammar, that the computer starts to fail. This model is great because it lets the humans spend more time on those difficult claims and gives them more attention without getting distracted by the sheer volume of papers.
A dataset shows the relationships between TV, radio, and newspaper sales. The goal is to analyze the relationships between the three different marketing mediums and how they affect the sale of a product. In this case, our data is displayed in the form of a table. Each row represents a sales region, and the columns tell us how much money was spent on each medium, as well as the profit that was gained in that region. For example, from the following table, we can see that in the third region, we spent $17,200 on TV advertising and sold 9,300 widgets:
Note
Usually, the data scientist must ask for units and the scale. In this case, I will tell you that the TV, radio, and newspaper categories are measured in "thousands of dollars" and the sales in "thousands of widgets sold." This means that in the first region, $230,100 was spent on TV advertising, $37,800 on radio advertising, and $69,200 on newspaper advertising. In the same region, 22,100 items were sold.

Advertising budgets' data
If we plot each variable against the sales, we get the following graph:
import pandas as pd
import seaborn as sns
%matplotlib inline
data = pd.read_csv('http://www-bcf.usc.edu/~gareth/ISL/Advertising.csv', index_col=0)
data.head()
sns.pairplot(data, x_vars=['TV','radio','newspaper'], y_vars='sales', height=4.5, aspect=0.7)
Results – Graphs of advertising budgets
Note how none of these variables form a very strong line, and that therefore they might not work well in predicting sales on their own. TV comes closest in forming an obvious relationship, but even that isn't great. In this case, we will have to create a more complex model than the one we used in the spawner-recruiter model and combine all three variables in order to model sales.
This type of problem is very common in data science. In this example, we are attempting to identify key features that are associated with the sales of a product. If we can isolate these key features, then we can exploit these relationships and change how much we spend on advertising in different places with the hope of increasing our sales.
Looking for a job in data science? Great! Let me help. In this case study, I have "scraped" (taken from the web) 1,000 job descriptions for companies that are actively hiring data scientists. The goal here is to look at some of the most common keywords that people use in their job descriptions, as shown in the following screenshot:

An example of data scientist job listings
In the following Python code, the first two imports are used to grab web data from the website http://indeed.com/, and the third import is meant to simply count the number of times a word or phrase appears, as shown in the following code:
import requests
from bs4 import BeautifulSoup
from sklearn.feature_extraction.text import CountVectorizer

# grab postings from the webtexts = []
for i in range(0,1000,10): # cycle through 100 pages of indeed job resources
 soup = BeautifulSoup(requests.get('http://www.indeed.com/jobs?q=data+scientist&start='+str(i)).text)
 texts += [a.text for a in soup.findAll('span', {'class':'summary'})]

print(type(texts))

print(texts[0]) # first job description
Okay, before I lose you, all that this loop is doing is going through 100 pages of job descriptions, and for each page, grabbing each job description. The important variable here is texts, which is a list of over 1,000 job descriptions, as shown in the following code:
type(texts) # == list


vect = CountVectorizer(ngram_range=(1,2), stop_words='english')

# Get basic counts of one and two word phrases


matrix = vect.fit_transform(texts)

# fit and learn to the vocabulary in the corpus


print len(vect.get_feature_names())  # how many features are there

# There are 10,587 total one and two words phrases in my case!!
Since web pages are scraped in real-time and these pages may change since this code is run, you may get different number than 10587.
I have omitted some code here, but it exists in the GitHub repository for this book. The results are as follows (represented as the phrase and then the number of times it occurred):

The following list shows some things that we should mention:
- "Machine learning" and "experience" are at the top of the list. Experience comes with practice. A basic idea of machine learning comes with this book.
- These words are followed closely by statistical words implying a knowledge of math and theory.
- The word "team" is very high up, implying that you will need to work with a team of data scientists; you won't be a lone wolf.
- Computer science words such as "algorithms" and "programming" are prevalent.
- The words "techniques", "understanding", and "methods" imply a more theoretical approach, unrelated to any single domain.
- The word "business" implies a particular problem domain.
There are many interesting things to note about this case study, but the biggest take away is that there are many keywords and phrases that make up a data science role. It isn't just math, coding, or domain knowledge; it truly is a combination of these three ideas (whether exemplified in a single person or across a multiperson team) that makes data science possible and powerful.