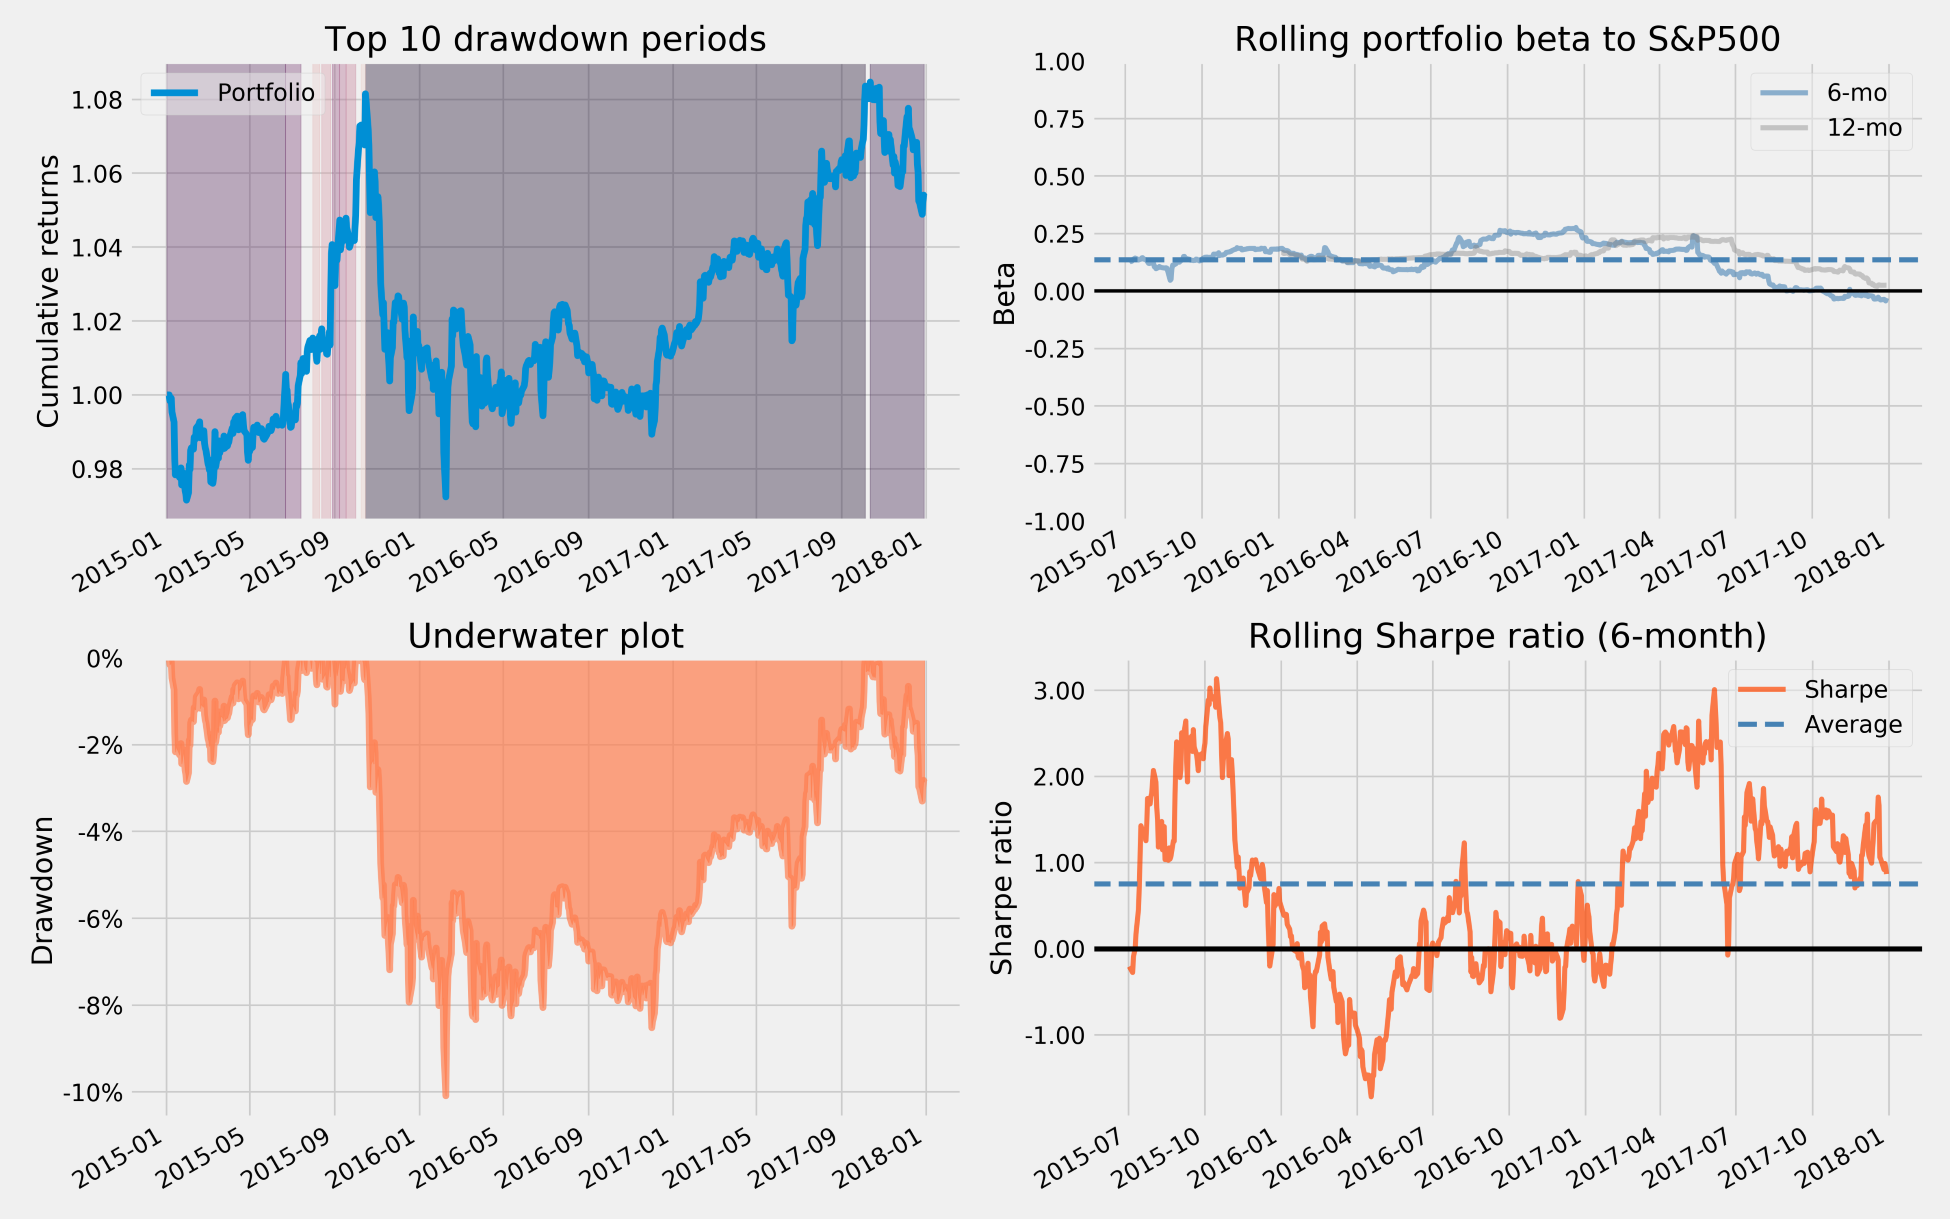
The plot_drawdown_periods(returns) function plots the principal drawdown periods for the portfolio, and several other plotting functions show the rolling SR and rolling factor exposures to the market beta or the Fama French size, growth, and momentum factors:
fig, ax = plt.subplots(nrows=2, ncols=2, figsize=(16, 10))
axes = ax.flatten()

plot_drawdown_periods(returns=returns, ax=axes[0])
plot_rolling_beta(returns=returns, factor_returns=benchmark_rets,
                  ax=axes[1])
plot_drawdown_underwater(returns=returns, ax=axes[2])
plot_rolling_sharpe(returns=returns)
This plot, which highlights a subset of the visualization contained in the various tear sheets, illustrates how pyfolio allows us to drill down into the performance characteristics and exposure to fundamental drivers of risk and returns: