
In this chapter, we will look at a few different schedulers that are capable of launching containers on both your own infrastructures as well as public cloud-based infrastructures. To start with, we will look at two different schedulers, both of which we will use to launch clusters on Amazon Web Services. The two schedulers are as follows:
- Kubernetes: http://kubernetes.io/
- Amazon ECS: https://aws.amazon.com/ecs/
We will then take a look at a tool that offers its own scheduler as well as supports others:
- Rancher: http://rancher.com/
Let's dive straight in by looking at Kubernetes.
Kubernetes is an open source tool, originally developed by Google. It is described as:
"A tool for automating deployment, operations, and scaling of containerized applications. It groups containers that make up an application into logical units for easy management and discovery. Kubernetes builds upon a decade and a half of experience of running production workloads at Google, combined with best-of-breed ideas and practices from the community." http://www.kubernetes.io
While it is not the exact tool that Google uses to deploy their containers internally, it has been built from the ground up to offer the same functionality. Google is also slowly transitioning to internally use Kubernetes themselves. It is designed around the following three principles:
- Planet scale: Designed on the same principles that allow Google to run billions of containers a week, Kubernetes can scale without increasing your ops team
- Never outgrow: Whether testing locally or running a global enterprise, Kubernetes' flexibility grows with you in order to deliver your applications consistently and easily no matter how complex your need is
- Run anywhere: Kubernetes is open source, giving you the freedom to take advantage of on-premise, hybrid, or public cloud infrastructure, letting you effortlessly move workloads to where it matters to you
Out of the box, it comes with quite a mature feature set:
- Automatic bin packing: This is the core of the tool, a powerful scheduler that makes decisions on where to launch your containers based on the resources currently being consumed on your cluster nodes
- Horizontal scaling: This allows you to scale up your application, either manually or based on CPU utilization
- Self-healing: You can configure status checks; if your container fails a check, then it will be relaunched where the resource is available
- Load balancing & service discovery: Kubernetes allows you to attach your containers to services, these can expose your container either locally or externally
- Storage orchestration: Kubernetes supports a number of backend storage modules out of the box, including Google Cloud Platform, AWS, and services such as NFS, iSCSI, Gluster, or Flocker to name a few
- Secret and configuration management: This allows you to deploy and update secrets such as API keys to your containers, without exposing them or rebuilding your container images
There are a lot more features that we could talk about; rather than covering these features, let's dive right in and install a Kubernetes cluster.
As hinted by the Kubernetes website, there are a lot of ways you can install Kubernetes. A lot of the documentation refers to Google's own public cloud; however, rather than introducing a third public cloud into the mix, we are going to be looking at deploying our Kubernetes cluster onto Amazon Web Services.
Before we start the Kubernetes installation, we need to ensure that you have the AWS Command Line Interface installed and configured.
As we have already used Homebrew several times during the previous chapters, we will use that to install the tools. To do this, simply run the following command:
brew install awscli
Once the tools have been installed, you will be able to configure the tools by running the following command:
aws configure
This will ask for the following four pieces of information:
- AWS Access Key ID
- AWS Secret Access Key
- Default region name
- Default output format
You should have your AWS Access and Secret keys from the when we launched a Docker Machine in Amazon Web Services in Chapter 2, Introducing First-party Tools. For the Default region name, I used eu-west-1 (which is the closest region to me) and I left the Default output format as None:

Now that we have the AWS Command Line Tools installed and configured, we can install the Kubernetes Command Line Tools. This is a binary that will allow you to interact with your Kubernetes' cluster in the same way that the local Docker client connects to a remote Docker Engine. This can be installed using Homebrew, just run the following command:
brew install kubernetes-cli

We don't need to configure the tool once installed as this will be taken care of by the main Kubernetes deployment script that we will be running next.
Now that we have the tools needed to launch and interact with our AWS Kubernetes cluster, we can make a start deploying the cluster itself.
Before we kick off the installation, we need to let the installation script know a little bit of information about where we want our cluster to launch and also how big we would like it, this information is passed on to the installation script as environment variables.
First of all, I would like it launched in Europe:
export KUBE_AWS_ZONE=eu-west-1c
export AWS_S3_REGION=eu-west-1
Also, I would like two nodes:
export NUM_NODES=2
Finally, we need to instruct the installation script that we would like to launch the Kubernetes in Amazon Web Services:
export KUBERNETES_PROVIDER=aws
Now that we have told the installer where we would like our Kubernetes cluster to be launched, it's time to actually launch it. To do this, run the following command:
curl -sS https://get.k8s.io | bash
This will download the installer and the latest Kubernetes codebase, and then launch our cluster. The process itself can take anywhere between eight and fifteen minutes, depending on your network connection.
If you prefer not to run this installation yourself, you can view a recording of a Kubernetes cluster being deployed in Amazon Web Services at the following URL:

Once the installation script has completed, you will be given information on where to access your Kubernetes cluster, you should also be able to run the following command to get a list of the nodes within your Kubernetes cluster:
kubectl get nodes
This should return something similar to the following screenshot:

Also, if you have the AWS Console open, you should see that a new VPC dedicated to Kubernetes has been created:

You will also see that three EC2 instances have been launched into the Kubernetes VPC:

The last thing to make a note of before we start to launch applications into our Kubernetes cluster is the username and password credentials for the cluster.
As you may have seen during the installation, these are stored in the Kubernetes CLI configuration, as they are right at the bottom of the file, you can get these by running the following command:
tail -3 ~/.kube/config

Now that our Kubernetes cluster has been launched, and we have access to it using the command-line tools, we can start launching an application.
To start off with, we are going to be launching a really basic cluster of NGINX containers, each container within the cluster will be serving a simple graphic and also print its host name on the page. You can find the image for container on the Docker Hub at https://hub.docker.com/r/russmckendrick/cluster/.
Like a lot of the tools we have looked at in the previous chapters, Kubernetes uses the YAML format for its definition file. The file we are going to launch into our cluster is the following file:
apiVersion: v1
kind: ReplicationController
metadata:
  name: nginxcluster
spec:
  replicas: 5
  selector:
    app: nginxcluster
  template:
    metadata:
      name: nginxcluster
      labels:
        app: nginxcluster
    spec:
      containers:
      - name: nginxcluster
        image: russmckendrick/cluster
        ports:
        - containerPort: 80
Let's call the file nginxcluster.yaml. To launch it, run the following command:
kubectl create -f nginxcluster.yaml
Once launched, you will be able to see the active pods by running the following command:
kubectl get pods
You may find that you need to run the kubectl get pods command a few times to ensure that everything is running as expected:

Now that you have your pods up and running, we need to expose them so that we can access the cluster using a browser. To do this, we need to create a service. To view the current services, type the following:
kubectl get services
You should see just the main Kubernetes service. When we launched our pods, we defined a replication controller, this is the process that manages the number of pods. To view the replication controllers, run the following command:
kubectl get rc
You should see the nginxcluster controller with five pods in the desired and current column. Now that we have confirmed that our replication controller is active with the expected number of pods registered with it, let's create the service and expose the pods to the outside world by running the following command:
kubectl expose rc nginxcluster --port=80 --type=LoadBalancer
Now, if you run the get services command again, you should see our new service:
kubectl get services
Your terminal session should look something similar to the following screenshot:

Great, you now have your pods exposed to the Internet. However, you may have noticed that the cluster IP address is an internal one, so how do you access your cluster?
As we are running our Kubernetes cluster in Amazon Web Services, when you exposed the service, Kubernetes made an API call to AWS and launched an Elastic Load Balancer. You can get the URL of the load balancer by running the following command:
kubectl describe service nginxcluster

As you can see, in my case, my load balancer can be accessed at http:// af92913bcf98a11e5841c0a7f321c3b2-1182773033.eu-west-1.elb.amazonaws.com/.
Opening the load balancer URL in a browser shows our container page:

Finally, if you open the AWS console, you should be able to see the elastic load balancer created by Kubernetes:

Let's try something more advanced than launching a few of the same instances and load balancing them.
For the following example, we are going to launch our WordPress stack. This time we are going to mount Elastic Block Storage volumes to store both our MySQL database and WordPress files on:
"Amazon Elastic Block Store (Amazon EBS) provides persistent block level storage volumes for use with Amazon EC2 instances in the AWS Cloud. Each Amazon EBS volume is automatically replicated within its Availability Zone to protect you from component failure, offering high availability and durability. Amazon EBS volumes offer the consistent and low-latency performance needed to run your workloads. With Amazon EBS, you can scale your usage up or down within minutes – all while paying a low price for only what you provision." - https://aws.amazon.com/ebs/
Before we launch our pods and services, we need to create the two EBS volumes that we will be attaching to our pods. As we already have the AWS Command Line Interface installed and configured, we will be using that to create the volume rather than logging into the console and creating it using the GUI.
To create the two volumes, simply run the following command twice, making sure that you update the availability zone to match where your Kubernetes cluster was configured to launch:
aws ec2 create-volume --availability-zone eu-west-1c --size 10 --volume-type gp2
Each time you run the command, you will get a blob of JSON returned, this will contain all of the metadata generated when the volume was created:

Make a note of VolumeId for each of the two volumes, you will need to know these when we create our MySQL and WordPress pods.
Now that we have the volumes created, we are now able to launch our MySQL Pod and Service. First of all, let's start with the Pod definition, make sure that you add one of the volumeIDs at the where promoted towards the bottom of the file:
apiVersion: v1
kind: Pod
metadata:
  name: mysql
  labels:
    name: mysql
spec:
  containers:
    - resources:
      image: russmckendrick/mariadb
      name: mysql
      env:
        - name: MYSQL_ROOT_PASSWORD
          value: yourpassword
      ports:
        - containerPort: 3306
          name: mysql
      volumeMounts:
        - name: mysql-persistent-storage
          mountPath: /var/lib/mysql
  volumes:
    - name: mysql-persistent-storage
      awsElasticBlockStore:
        volumeID:<insert your volume id here>
        fsType: ext4
As you can see, this follows pretty closely to our first Kubernetes application, except this time, we are only creating a single Pod rather than one with a Replication Controller.
Also, as you can see, I have added my volumeID to the bottom of the file; you will need to add your own volumeID when you come to launch the Pod.
I call the file mysql.yaml, so to launch it, we need to run the following command:
kubectl create -f mysql.yaml
Kubernetes will validate the mysql.yaml file before it tries to launch the Pod; if you get any errors, please check whether the indentation is correct:

You should now have the Pod launched; however, you should probably check if it's there. Run the following command to view the status of your Pods:
kubectl get pods
If you see that the Pod has a status of Pending, like I did, you will probably be wondering what's going on? Luckily, you can easily find that out by getting more information on the Pod we are trying to launch by using the describe command:
kubectl describe pod mysql
This will print out everything you will ever want know about the Pod, as you can see from the following terminal output, we did not have enough capacity within our cluster to launch the Pod:

We can free up some resources by removing our previous Pods and Services by running the following command:
kubectl delete rc nginxcluster
kubectl delete service nginxcluster
Once you run the commands to remove nginxcluster, your mysql Pod should automatically launch after a few seconds:

Now that the Pod has been launched, we need to attach a service so that port 3306 is exposed, rather than doing this using the kubectl command like we did before, we will use a second file called mysql-service.yaml:
apiVersion: v1
kind: Service
metadata:
  labels:
    name: mysql
  name: mysql
spec:
  ports:
    - port: 3306
  selector:
    name: mysql
To launch the service, simply run the following command:
kubectl create -f mysql-service.yaml
So now that we have the MySQL Pod and Service launched, it's time to launch the actual WordPress container.
Like the MySQL Pod and Service, we will be launching our WordPress container using two files. The first file is for the Pod:
apiVersion: v1
kind: Pod
metadata:
  name: wordpress
  labels:
    name: wordpress
spec:
  containers:
    - image: wordpress
      name: wordpress
      env:
        - name: WORDPRESS_DB_PASSWORD
          value: yourpassword
      ports:
        - containerPort: 80
          name: wordpress
      volumeMounts:
        - name: wordpress-persistent-storage
          mountPath: /var/www/html
  volumes:
    - name: wordpress-persistent-storage
      awsElasticBlockStore:
        volumeID: <insert your volume id here>
        fsType: ext4
As an EBS volume cannot be attached to more than one device at a time, remember to use the second EBS volume you created here. Call the wordpress.yaml file and launch it using the following command:
kubectl create -f wordpress.yaml
Then wait for the Pod to launch:

As we have already removed nginxcluster, there should be enough resources to launch the Pod straightaway, meaning that you should not get any errors.
Although the Pod should be running, it's best to check whether the container launched without any problems. To do this, run the following command:
kubectl logs wordpress
This should print out the container logs, you will see something similar to the following screenshot:

Now that the Pod has launched and WordPress appears to have bootstrapped itself as expected, we should launch the service. Like nginxcluster, this will create an Elastic Load Balancer. The service definition file looks similar to the following code:
apiVersion: v1
kind: Service
metadata:
  labels:
    name: wpfrontend
  name: wpfrontend
spec:
  ports:
    - port: 80
  selector:
    name: wordpress
  type: LoadBalancer
To launch it, run the following command:
kubectl create -f wordpress-service.yaml
Once launched, check whether the service has been created and get the details of the Elastic Load Balancer by running the following command:
kubectl get services
kubectl describe service wpfrontend
When I ran the commands, I got the following output:

After a few minutes, you should be able to access the URL for Elastic Load Balancer, and as expected, you will be presented with a WordPress installation screen:

As we did in Chapter 3, Volume Plugins when we were looking at storage plugins, complete the installation, log in, and attach an image to the Hello World post.
Now that we have the WordPress site up and running, let's try removing the wordpress Pod and relaunching it, first of let's make a note of the Container ID:
kubectl describe pod wordpress | grep "Container ID"
Then delete the Pod and relaunch it:
kubectl delete pod wordpress
kubectl create -f wordpress.yaml
Check the Container ID again to make sure that we have a different one:
kubectl describe pod wordpress | grep "Container ID"

Going to your WordPress site, you should see everything exactly as you left it:

If we wanted to, we could perform the same action for the MySQL pod and our data would be exactly as we left it, as it is stored in the EBS volume.
Let's remove the Pod and Service for the WordPress application by running the following command:
kubectl delete pod wordpress
kubectl delete pod mysql
kubectl delete service wpfrontend
kubectl delete service mysql
This should leave us with a nice clean Kubernetes cluster for the next section of the chapter.
You may be wondering to yourself why we bothered grabbing the username and password when we first deployed our Kubernetes cluster as we have not had to use it yet. Let's take a look at some of the supporting tools that are deployed as part of our Kubernetes cluster.
When you first deployed your Kubernetes cluster, there was a list of URLs printed on the screen, we will be using these for this section. Don't worry if you didn't make a note of them as you can get all the URLs for the supporting tools by running the following command:
kubectl cluster-info
This will print out a list of URLs for the various parts of your Kubernetes cluster:

You will need the username and password to view some of these tools, again if you don't have these to hand, you can get them by running the following command:
tail -3 ~/.kube/config
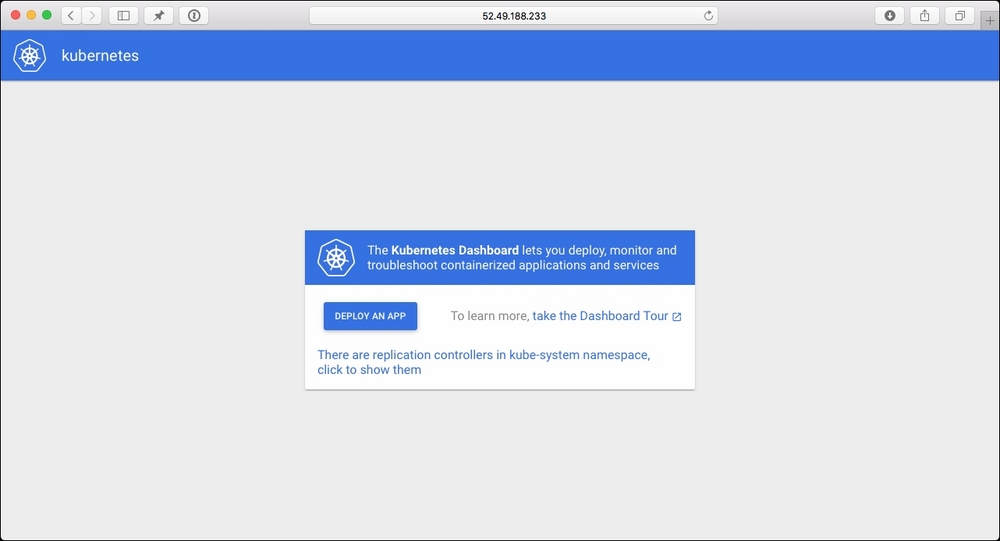
First of all, let's take a look at the Kubernetes Dashboard. You can get this by putting the URL for the Kubernetes-dashboard in your browser. When you enter it, depending on your browser, you will get warnings about the certificates, accept the warnings and you will be given a login prompt. Enter the username and password here. Once logged in, you will see the following screen:
Let's deploy the NGINX Cluster application using the UI. To do this, click on Deploy An App and enter the following:
- App name =
nginx-cluster - Container image =
russmckendrick/cluster - Number of pods =
5 - Port = Leave blank
- Port =
80 - Target port =
80 - Tick the box for Expose service externally

Once you click on Deploy, you will be taken back to the overview screen:

From here, you can click on nginx-cluster and be taken to an overview screen:

As you can see, this gives you all the details on both the Pod and Service, with details such as the CPU and memory utilization, as well as a link to the Elastic Load Balancer. Clicking the link should take you to the default cluster page of the image and the container's hostname.
Let's leave nginx-cluster up and running to look at the next tool.
The next URL that we are going to open is Grafana; going to the URL, you should see a quite dark and mostly empty page.
Grafana is the tool that is recording all the metrics that we saw being displayed in the Kubernetes dashboard. Let's take a look at the cluster stats. To do this, click on the Cluster dashboard:

As you can see, this gives us a breakdown of all of the metrics that you would expect to see from a system-monitoring tool. Scrolling down, you can see:
- CPU Usage
- Memory Usage
- Network Usage
- Filesystem Usage
Both collectively and per individual node. You can also view details on Pods by clicking on the Pods dashboard. As Grafana gets its data from the InfluxDB pod, which has been running since we first launched our Kubernetes cluster, you can view metrics for every Pod that you have launched, even if it is not currently running. The following is the Pod metrics for the mysql pod we launched when installing WordPress:

I would recommend you to look around to view some of the other Pod metrics.
The final tool we are going to look at is the ELK stack that has been running in the background since we first launch our Kubernetes cluster. An ELK stack is a collection of the following three different tools:
- Elasticsearch: https://www.elastic.co/products/elasticsearch
- Logstash: https://www.elastic.co/products/logstash
- Kibana: https://www.elastic.co/products/kibana
Together they form a powerful central logging platform.
When we ran the following command earlier in this section of the chapter (please note you will not be able to run it again as we removed the WordPress pod):
kubectl logs wordpress
The logs displayed for our wordpress pod the log file entries were actually read from the Elasticsearch pod. Elasticsearch comes with its own dashboard called Kibana. Let's open the Kibana URL.
When you first open Kibana, you will be asked to configure an index pattern. To do this, just select Time-field name from the drop-down box and click on Create button:

Once the index pattern has been created, click on the Discover link in the top menu. You will then be taken to an overview of all of the log data that has been sent to Elasticsearch by the Logstash installations that are running on each of the nodes:

As you can see, there is a lot of data being logged; in fact, when I looked, there were 4,918 messages logged within 15 minutes alone. There is a lot of data in here, I would recommend clicking around and trying some searches to get an idea of what is being logged.
To give you an idea of what each log entry looks like, here is one for one of my nginx-cluser pods:

As the cluster is sat in your Amazon Web Services account on instances that are pay-as-you-go, we should look at removing the cluster; to do this, let's re-enter the original configuration that we entered when we first deployed the Kubernetes cluster by running the following command:
export KUBE_AWS_ZONE=eu-west-1c
export AWS_S3_REGION=eu-west-1
export NUM_NODES=2
export KUBERNETES_PROVIDER=aws
Then, from the same location you first deployed your Kubernetes cluster, run the following command:
./kubernetes/cluster/kube-down.sh
This will connect to the AWS API and start to tear down all of the instances, configuration, and any other resources that have been launched with Kubernetes.
The process will take several minutes, do not interrupt it or you maybe left with resources that incur costs running within your Amazon Web Services account:

I would also recommend logging into your Amazon Web Services console and remove the unattached EBS volumes that we created for the WordPress installation and also any Kubernetes labelled S3 buckets as these will be incurring costs as well.
Kubernetes, like Docker, has matured a lot since its first public release. It has become easier to deploy and manage with each release without having a negative impact on the feature set.
As a solution that offers scheduling for your containers, it is second to none, and as it is not tied to any particular provider, you can easily deploy it to providers other than Amazon Web Services, such as Google's own Cloud Platform, where it is considered a first class citizen. It is also possible to deploy it on premise on your own bare metal of virtual servers, making sure that it keeps itself inline with the build once and deploy anywhere philosophy that Docker has.
Also, it adapts to work with the technologies available in every platform you deploy it onto; for example, if you need persistent storage, then as already mentioned, there are multiple options available to you.
Finally, just like Docker has been over the past 18 months, Kubernetes has quite a unifying platform, with multiple vendors such as Google, Microsoft, and Red Hat. They all support and use it as part of their products.