To see the result of our labor, we can take a look at the instance flow of the request we have just sent to our integration. Use a browser to login to your integration cloud instance and, instead of navigating to the designer portal, go to the monitoring dashboard by clicking Monitoring in the menu on the top-right corner as shown in the following screenshot:

We will discuss the monitoring dashboard later in Chapter 12, Are My Integrations Running Fine, and What If They Are Not?, so for now we won't go into too much detail but we will navigate directly to the Integrations section. Click the corresponding menu item on the left side.
Enter the text Ch2 into the search box to filter out all other integrations, if any. For each integration this pages shows the amount of received messages, how many are processed, and for the processed messages how many where successful or had errors as shown in the following screenshot:
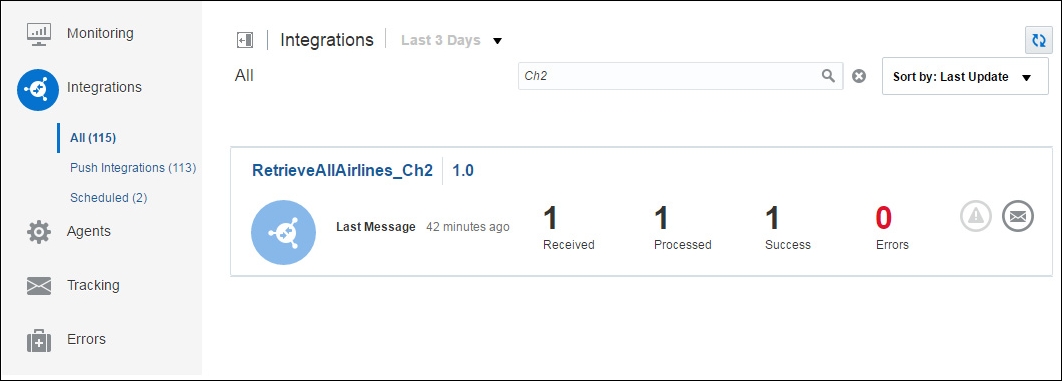
To see the messages processed by a specific integration, we can click on the message icon on the right side or on one of the numbers. Click the show messages icon of the RetrieveAllAirlines_Ch2 integration.
We are routed to the Tracking section of the monitoring dashboard, which shows a list of messages. Since we only invoke the integration once, we see one message. Notice that the title of the message instance includes the tracking field we set when finishing the integration, as shown in the following screenshot:

To see the message flow of a specific instance, we can click on the instance title. Click on max Results: to look at the instance details. The following screenshot shows the message flow using the same view as the integration canvas. Our instance completed successful so the flows show two green arrows from and to the Source and Target.

For each instance we can view the business identifiers, view any errors that occurred and execute various actions, for example view the Audit Trail as shown in the following screenshot:

The message sent and received by ICS to our backend REST service can be viewed in apiary. Visit apiary.io again and login with your account. Navigate to the Inspector page of your API. The Inspector page, as we explained earlier, shows us the received requests from ICS.
The incoming request was processed and returned with the following JSON response:
