Some consider the standard library of reports provided in the NAV product distribution from Microsoft to be relatively simple in design and limited in its features. Others feel that the provided reports satisfy most needs because they are simple but flexible. Their basic structure is easy to use. They are made much more powerful and flexible by taking advantage of NAV's filtering and SIFT capabilities. There is no doubt that the existing library can be used as a foundation for many of the special reports that customers require to match their own specific business management needs.
The fact remains that NAV's standard reports are basic. In order to obtain more complex or more sophisticated reports, we must use the features that are part of the product or feed processed data to external reporting tools. Through creative use of these features, many different types of complex report logic may be implemented.
First, we will review different types of reports and the components that make up the reports. We'll look in detail at the triggers, properties, and controls that make up NAV report data processing. SQL Server Report Builder is installed by default when the NAV system is installed. We will work with this tool for our report layout work. However, for those who are experienced with Visual Studio Report Designer, it also integrates into NAV 2015 and can be used instead.
We'll create some reports with our Report Designer tools. We'll modify a report or two using Report Designer. We'll examine the data flow of a standard report and the concept of reports used for processing only (with no printed or displayed output). Further, we'll take a look at the Microsoft Word 2013 Report Layout design capability, which is new in NAV 2015.
A report is a vehicle for organizing, processing, and displaying data in a format suitable for outputting to the user. Reports may be displayed on-screen in the Preview mode, output to a file in the Word or PDF format (or, when appropriately designed, output in the CSV or XML format), e-mailed to a user (or other consumer of the information), or printed to hardcopy the old-fashioned way. All the report screenshots in this book were taken from Preview mode reports.
Once generated, the data contents of a report are static. When a NAV 2015 Report is output in the Preview mode, the report can have interactive capabilities. These capabilities only affect the presentation of the data; they do not change the actual data contents included in the report dataset. Interactive capabilities include dynamic sorting, visible/hidden options, and detail/summary expand/collapse functions. All specifications of the data selection criteria for a report must be done at the beginning of the report run, before the report view is generated. NAV 2015 also allows a dynamic functionality for drill down into the underlying data, drill through to a page, and even drill through into another report.
In NAV, report objects can be classified as Processing Only (such as report 795 Adjust Cost – Item Entries) by setting the correct report property (that is, by setting the ProcessingOnly property to Yes). A ProcessingOnly report will not display data to the user but will simply process and update data in the tables. Report objects are convenient to use for processing because the report's automatic read-process-write loop and the built-in Request page reduce the coding that would otherwise be required. A report can add, change, or delete data in tables, irrespective of whether the report is ProcessingOnly or a typical report that generates output for viewing.
In general, reports are associated with one or more tables. A report can be created without being externally associated with any table, but this is an exception. Even if a report is associated with a particular table, it can freely access and display data from other referenced tables.
Any NAV 2015 report design project uses at least two Report Designer tools. The first is Report Designer that is part of the C/SIDE development environment. The second is the developer's choice of Visual Studio Report Designer or SQL Server Report Builder or Microsoft Word 2013. Refer to Microsoft Dynamics NAV Development Environment Requirements for information about the choice of tools for handling RDLC report layouts for NAV 2015. SQL Server Report Builder is installed by default during a NAV system install. There is also a free version of Visual Studio available at https://msdn.microsoft.com/en-us/visual-studio-community-vs.aspx
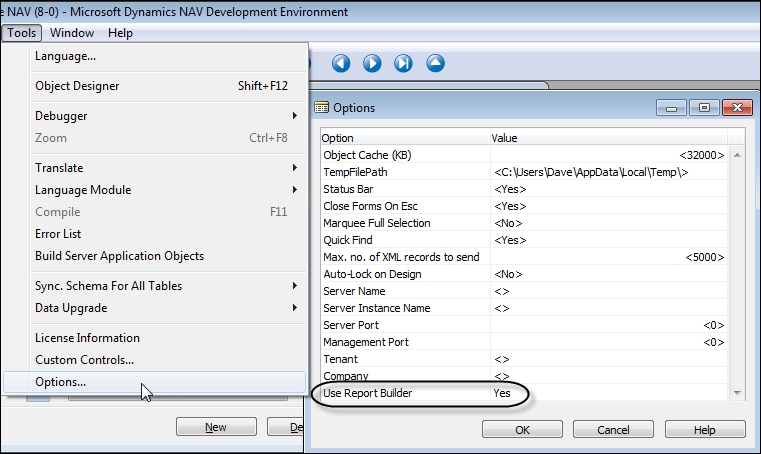
For our work, we are going to use a combination of C/SIDE Report Designer (C/SIDE RD) and SQL Server Report Builder (SSRB). Access to SQL Server Report Builder is enabled by going to Tools | Options and setting Use Report Builder to Yes, as shown in the following screenshot:
The new option, using Microsoft Word 2013, is aimed at supporting quick, simple changes in format with the goal of allowing customers to be more self-sufficient while requiring less technical expertise. Because our focus is on becoming qualified NAV Developers, we will leave the discussion of layout formatting with Word for later.
Note
The report development process for a NAV 2015 report begins with the data definition in C/SIDE RD. All the data structures, working data elements, data flows, and C/AL logic are defined there. We must start in C/SIDE RD to create or modify report objects. Once all of the elements of the dataset definition and Request page are in place, the development work proceeds to SSRB or VS RD or Word where the display layout work is done (including any desired dynamic options).
When a report is developed, SSRB and VS RD each build a definition of the report layout in the XML-structured Report Definition Language Client-side (RDLC). If Word is used to build a NAV 2015 Report layout, the result is a custom XML part, which is used to map the data into a report at run time. When we exit the layout design tool, the latest copy of the RDLC code is stored in the current C/SIDE Report object. When we exit C/SIDE Report Designer and save our Report object, C/SIDE RD saves the combined set of report definition information, C/SIDE and RDLC, in the database.
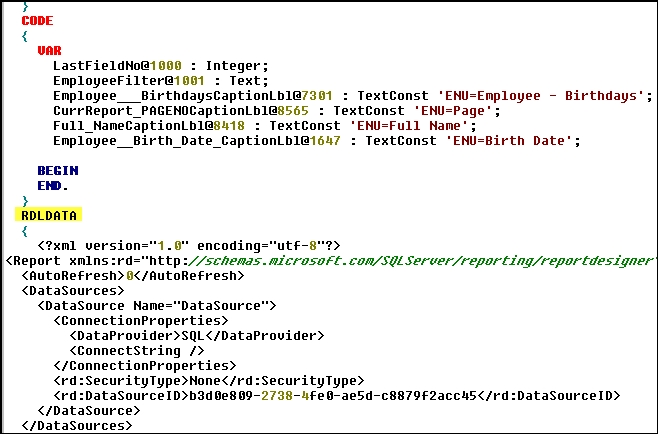
If we export a report object in the text format, we will be able to see the two separate sets of report definition. XML-structured RDLC is quite obvious (beginning with the heading RDLDATA).
For an experienced NAV Classic Client report developer who is moving to Role Tailored Client projects, it is initially a challenge to learn exactly which tasks are done using which report development tool and to learn the intricacies of the SQL Server or Visual Studio report designer layout tools. The biggest challenge is the fact that there are no wizards to help with the NAV 2015 report layout. All our report development must be done manually, one field or format at a time. If we would like Microsoft to invest in report layout wizards for future releases, we should tell them.
Tip
We can submit suggestions on any Dynamics NAV-related topic through Microsoft Connect at http://connect.microsoft.com/directory/.
NAV allows us to create reports of many types with different look and feel attributes. The consistency of the report look and feel does not have the same level of design importance as it has for pages. There may be Patterns developed that relate to reports, so before starting a new report format, it is best to check whether there is an applicable Pattern.
Good design practice dictates that enhancements should integrate seamlessly in both process and appearance unless there is an overwhelming justification for being different. There are still many opportunities for reporting creativity. The tools available within NAV for accessing and manipulating data for reports are very powerful. Of course, there is always the option to output report results to other processing/presentation tools such as Excel or third-party products.
The standard NAV application uses only a few of the possible report styles, most of which are in a relatively basic format. The following are the types of reports included in NAV 2015:
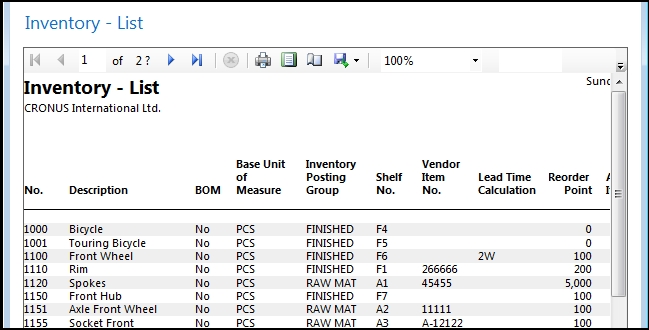
- List: A formatted list of data. A standard list is the Inventory - List report (Report 701)
- Document: Is formatted along the lines of a pre-printed form, where a page (or several pages) contains a header, details, and footer section with dynamic content. Examples are Customer Invoice, Packing List (even though it's called a list, it's a document report), Purchase Order, and Accounts Payable Check
The following screenshot shows a Customer Sales-Invoice document report preview:

The List and Document report types are defined on the basis of their layouts. The next three report types are defined on the basis of their usage rather than their layout.
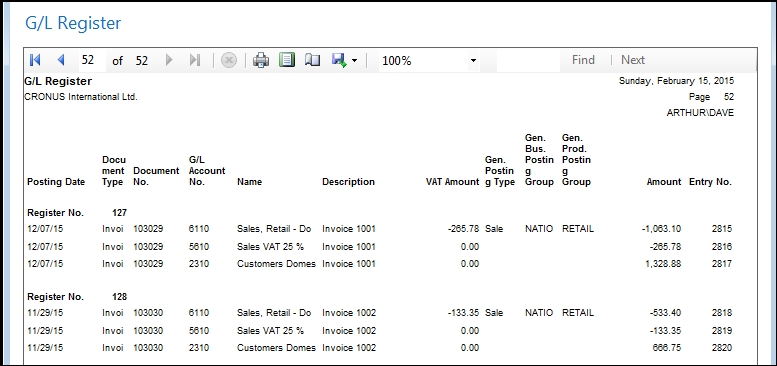
- Transaction: Provides a list of ledger entries for a particular Master table. For example, a Transaction list of the Item Ledger entries for all of the items matching a particular criterion, or a list of General Ledger entries for some specific accounts, as shown in the following screenshot:
- Test: These reports are printed from the
Journaltables prior to posting the transactions. Test reports are used to pre-validate data before posting. The following is a Test report for a General Journal – Sales batch.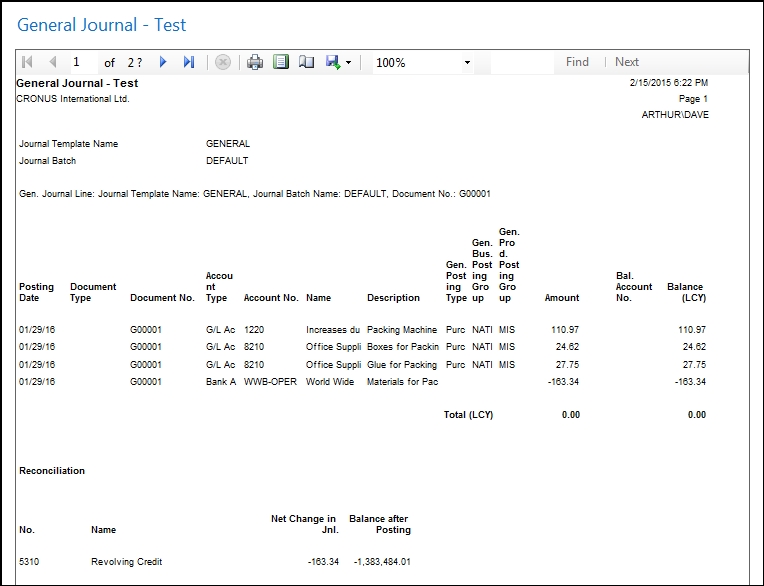
- Posting: Reports are printed as an audit trail as part of a "Post and Print" process. Posting report printing is controlled by the user's choice of either a Posting Only option or a Post and Print option. The Posting portions of both options work in a similar manner. Post and Print runs a report that is selected in the application setup (in the applicable Templates page in columns that are hidden by default). The default setup uses the same report that one would use as a Transaction (history) report (like G/L Register shown earlier). This type of posting audit trail report, which is often needed by accountants, can be regenerated completely and accurately at any time.
The following list describes the different basic types of reports available in NAV 2015.
Many reports in the standard system don't fit neatly within the preceding categories but are variations or combinations. Of course, this is also true of many custom reports.
Simple reports are often named the same as the table with which they are primarily associated, plus a word or two describing the basic purpose of the report. Common key report purpose names include the words Journal, Register, List, Test, and Statistics. Some examples are as follows: General Journal–Test, G/L Register, and Customer – Order Detail.
When there are conflicts between naming that is based on the associated tables and naming that is based on the use of the data, the usage context should take precedence in naming reports, just as it does with pages. One absolute requirement for names is that they must be unique; no duplicate names are allowed for a single object type.