Chapter 14. Understanding Cisco NAC Appliance Monitoring
This chapter covers the following topics:
- Understanding the Various Monitoring Pages and Event Logs
- Understanding Monitoring of Web Login and Clean Access Agents
- Monitoring the Status of NAC Appliance Manager and NAC Appliance Servers
This chapter covers the most common monitoring techniques and tools available for NAC Appliance. This chapter is written with both the administrator and help desk support tech in mind. It also contains useful information for those who need to test a new installation of NAC Appliance. The pages, logs, and tools discussed here will help the support tech to locate, monitor, maintain, and troubleshoot the various components of the NAC Appliance solution. This includes the client, the web login and agent, the server, and the manager.
Understanding the Various Monitoring Pages and Event Logs
The NAC Appliance solution has several monitoring pages and support logs available. Most of these pages are accessed using the web GUI for NAC Appliance Manager. Many of them are found under the Monitoring section shown in Figure 14-1.
Figure 14-1. Monitoring Section
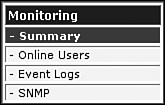
Other pages and logs require the use of the command-line interface (CLI) or the server's direct access web console. The purpose of these pages and log files is to provide administrators with operational information regarding their NAC Appliance environment. This includes clients, servers, system events, and others.
Summary Page
The Summary page is a good place to go to find out, at a high level, how many users, hosts, and NAC Appliance Servers are online. It is also a good place to go to see what Clean Access Agent version is installed. But the primary purpose of the Summary page is to display the online users who are both in-band (IB) and out-of-band (OOB). The Summary page shown in Figure 14-2 gives an example of this. It shows that one user is currently online out-of-band in the Employee user role. The number 1 is a hyperlink that, if clicked, takes you to the out-of-band online users list for the user role Employee. This allows you to quickly obtain additional detail for each user online in a particular role.
Figure 14-2. Summary Page
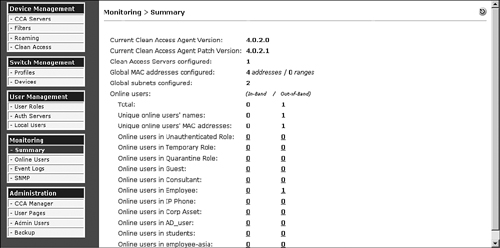
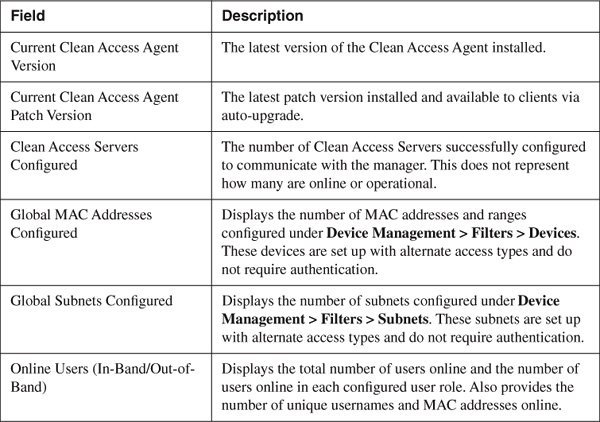
The Summary page shown in Figure 14-2 has several fields, described in Table 14-1.
Table 14-1. Summary Page Fields
Discovered Clients and Online Users Pages
The View Online Users page is actually broken down into two separate pages: an In-Band page and an Out-of-Band page. Each page shows the users who are online and using the respective mode of operation. When trying to track down an online user in an out-of-band environment, it is important to understand where a client can be monitored at each stage of its certification. For monitoring OOB clients, you need to be aware of three stages. Each stage requires you to view a different monitoring page to obtain client information at that stage. Table 14-2 shows each stage and its corresponding monitoring page.
Table 14-2. OOB Monitoring Stages and Pages
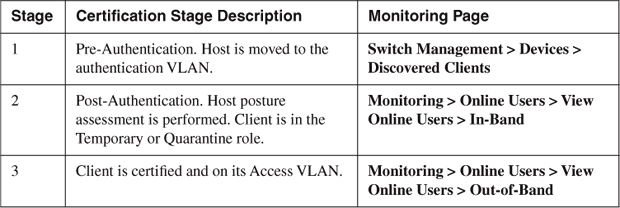
The following is an example of how you follow the monitoring of an OOB client as it progresses through the authentication and certification stages of NAC Appliance. Understanding this flow is essential for efficiently troubleshooting clients.
Stage 1 The client plugs into the network; the switch tells NAC Appliance Manager it has a new user on a particular port. The Manager then learns the MAC address of the host. The Manager instructs the switch to move the client's switch port into the authentication VLAN. At this point, the client is not online and therefore will not show up on any of the online user pages.
To monitor a client at stage 1, it is necessary to view the OOB Discovered Clients page. This page shows all the clients discovered from Simple Network Management Protocol (SNMP) MAC-notification or linkup and linkdown traps sent from controlled switch ports.
Stage 2 Relevant only for hosts that fail requirements or are presented with a User Agreement Page (UAP). If the host passes all requirements and no UAP is configured, it moves directly to stage 3. The user successfully authenticates to NAC Appliance. The access method used by the client, web login, or Clean Access Agent makes no difference to the monitoring pages flow. The client then moves to either the Temporary role (Clean Access Agents) or the Quarantine role (web login with network scanner clients). The client is now in-band with its respective NAC Appliance Server. While in quarantine, all traffic travels through NAC Appliance Server.
To monitor a client at stage 2, it is necessary to view the View Online Users > In-Band page. This page shows all clients that are actively in-band with NAC Appliance, such as clients in the Temporary and Quarantine user roles.
Stage 3 The client passes the posture assessment and remediation. The Manager instructs the switch to move the client's switch port into the proper access VLAN. At this stage, no client traffic flows through NAC Appliance; therefore, the client is said to be out-of-band.
Clients in stage 3 can be monitored using the Out-of-Band Online Users pages. This page displays all clients that are actively out-of-band with NAC Appliance.
A solid understanding of each of the monitoring pages just discussed is necessary. To that end, each page will be discussed in detail starting with the Discovered Clients page.
Discovered Clients Page
The Discovered Clients page displays all the clients discovered from SNMP MAC-notification or linkup and linkdown traps sent from controlled switch ports. It serves as a location database, letting NAC Appliance Manager know which switch port a particular client (MAC address) is plugged into. The Manager uses this list when it needs to set a VLAN (authentication or access VLAN) for an out-of-band client. When a client first connects to a switch port, the switch sends an SNMP MAC-notification or linkup trap to NAC Appliance Manager. The Manager then adds the client's MAC address, switch IP, port number, and Auth VLAN to the Discovered Clients page. The other fields on the page update as the information becomes available to the Manager. The Manager then sends an SNMP Set request to the switch, instructing it to change the port's VLAN to the proper authentication VLAN. Figure 14-3 shows a sample Discovered Clients page.
Figure 14-3. Discovered Clients Page
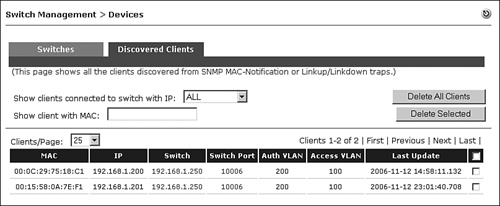
It is possible to delete an entry in the Discovered Clients page. However, this should rarely have to be done and should be used with care. Deleting an entry does not log out the client; it only removes the MAC address-to-switch port pairing. It will not affect a currently logged-in user. However, NAC Appliance Manager cannot set or change a client's VLAN if the client is not listed in the Discovered Clients list. An entry must exist in the Discovered Clients list for the Manager to determine which switch port a client resides on.
Online Users Page
When you are troubleshooting a client issue, the first place you usually start is the Online Users page. This page provides many of the details you will need to start to troubleshoot the issue. It is also the page you would use to log out or kick off a particular client. If a particular client is not found on one of the Online User pages, check the Discovered Clients page.
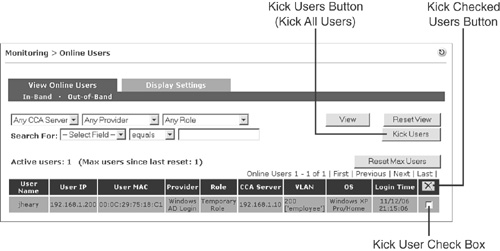
The Online Users page is broken up into two sections: one for in-band users and one for out-of-band users. The In-Band page shows all users currently authenticated and in-band. The Out-of-Band page shows only OOB users who are on their access VLAN (trusted side). This means that only users who have successfully authenticated and been certified will be shown here. Users in any other OOB state will be shown in the In-Band user pages. The pages of each are very similar. In fact, the only difference between them is that the OOB page has the switch and switch port information added. Figure 14-4 shows an example of an Online Users page for out-of-band clients.
Figure 14-4. Online Users Page for Out-of-Band Clients

The Online Users page in Figure 14-4 shows that one user is currently online in Out-of-Band mode. This page is helpful for tracking users by IP, MAC, or username. If a network security device, such as an intrusion prevention system (IPS), alerts on a certain IP address, you can use this page to determine whether the address represents a NAC Appliance user. If it does, you can use the Kick Users button to remove it from the network.
Figure 14-5 shows an example of an Online Users page for in-band clients. This shows the client in the Temporary role. All users in a Temporary or Quarantine user role display with a green background.
Figure 14-5. Online Users Page for In-Band Clients
Note
Even if you deploy your NAC Appliance solution in Out-of-Band mode, be sure to check the In-Band page because any users stuck in the certification process will be shown there. From a troubleshooting standpoint, the information given there for each user is very valuable. It usually helps you to isolate the issue or at the very least provides you with all the information you need to build a temporary bypass condition for the user. A temporary bypass should be created only as a last resort. A temporary bypass allows the client to avoid all the Clean Access checks, including authentication.
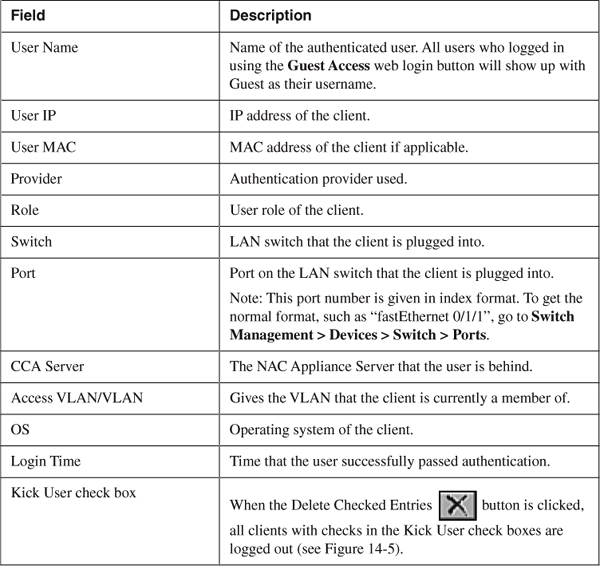
Table 14-3 provides descriptions for each of the fields shown in the Online Users page, IB or OOB, from left to right.
Table 14-3. Online Users Page Fields
Both the IB and OOB pages have the capability to filter the page view and search for online users based on criteria you select. The filter options are indicated in Figure 14-6.
Figure 14-6. Online User Page Filter and Search Criteria
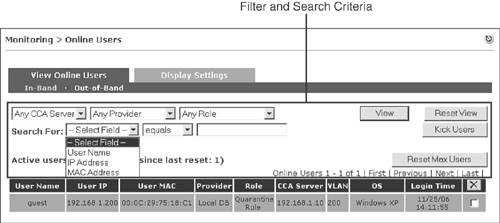
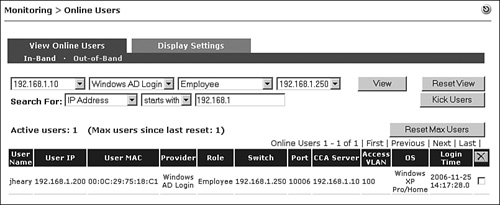
To change your Online Users page view, you can filter on NAC Appliance Server, authentication provider, and user role. To search the online user database, you first choose a search type: client IP address, MAC address, or username. Then you pick an operator, such as equals, starts with, ends with, or contains. Finally, you enter the text or string to search for. For example, Figure 14-7 shows the OOB Online Users view restricted using both view and search criteria. The view shown is filtered using the following criteria:
- NAC Appliance Server = 192.168.1.10
- Provider = Windows AD Login
- User role = Employee
- Switch = 192.168.1.250
- Only IP addresses starting with 192.168.1
Figure 14-7. Online Users Page Filter and Search Example
The Kick Users button will log out only users displayed on the screen. This means that you can use the search and view filters to narrow down the users who you want to log out. Unlike the ![]() button, which removes only those users with checked boxes, the Kick Users button removes all users on the page regardless of their check box status.
button, which removes only those users with checked boxes, the Kick Users button removes all users on the page regardless of their check box status.
You can customize the fields that are displayed on the Online Users page by going to the Monitoring > Online Users > Display Settings page shown in Figure 14-8. This page has two sections: In-Band and Out-of-Band.
Figure 14-8. Display Settings Page
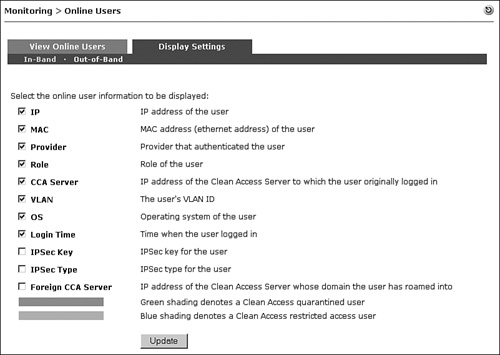
Note
The IPsec and roaming features are deprecated features and will be removed from NAC Appliance in a future release.
Event Logs
The NAC Appliance Manager event logs can be useful troubleshooting and auditing tools. The Manager's event logs can be found under Monitoring > Event Logs. There are three tabs here: View Logs, Logs Setting, and Syslog Settings.
The View Logs page presents all the events generated by the Manager, with the most recent events at the top. You can customize the view by changing the search criteria as shown in Figure 14-9.
Figure 14-9. View Logs Page

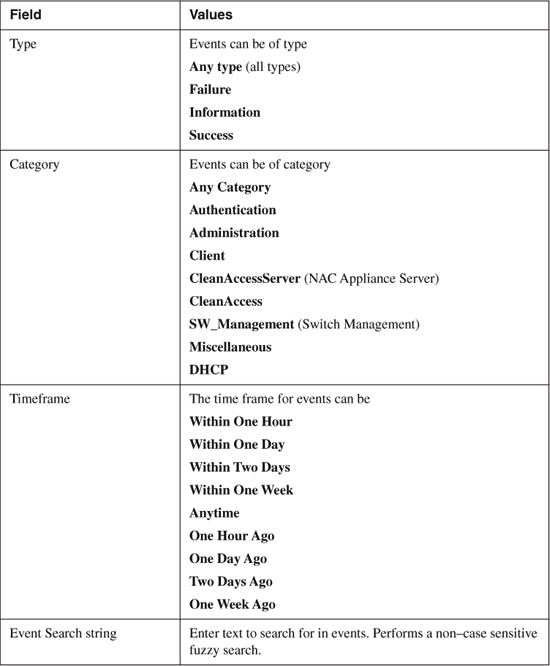
The search criteria available are described in Table 14-4.
Table 14-4. Event Logs Search Criteria
Deleting an event from this page permanently deletes the event from NAC Appliance Manager.
The events are shown below the search criteria and are separated into four columns: Type, Category, Time, and Event. The values for the Type column are represented by the following different colored flags ![]() :
:
- Red flag Failure event. Indicates an error or failed operation, such as an authentication failure.
- Green flag Success event. Indicates a normal condition or successful operation, such as a successful authentication.
- Yellow flag Informational event. Indicates system performance and load information, including those reported by NAC Appliance Servers.
The Logs Setting page under Monitoring > Event Logs > Logs Setting has only one setting. The only setting is Maximum Event Logs. This setting specifies how many events should be kept in the Manager's event database. When full, the database will start to overwrite the oldest events first. The value defaults to a value of 30,000 and has a maximum value of 200,000 events.
To have your event messages forwarded to a syslog server, you must configure the parameters under Monitoring > Event Logs > Syslog Settings. The following three fields must be configured:
- Syslog Server Address This is the IP address of a syslog server.
- Syslog Server Port This is the User Datagram Protocol (UDP) port that the syslog server is listening on. The default is 514.
- System Health Log Interval This is the interval, in minutes, between system status events. This setting determines how frequently system status messages from NAC Appliance Manager and the NAC Appliance Servers are generated.
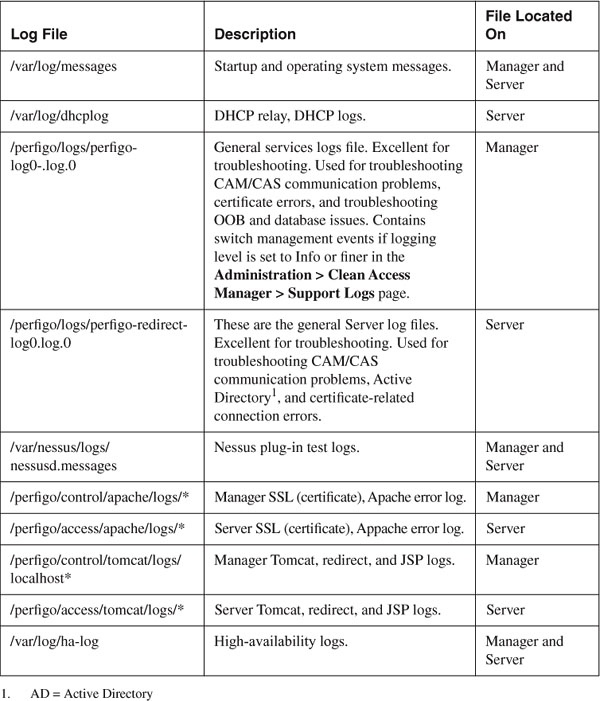
The event logs are stored in NAC Appliance Manager's database with the table name of log_info. The locations of other useful logs are shown in Table 14-5. These logs can be accessed via the Linux CLI or via the web GUI. On the Manager, navigate to Administration > Clean Access Manager > Support Logs and click the Download Technical Support Logs button. On the Server, open the direct access web GUI (https://<Server eth0 IP>/admin), navigate to Monitoring > Support Logs, and click the Download button. To change the logging level for these files, see the "Understanding and Changing Logging Levels of NAC Appliance" section that follows. The most important files for troubleshooting purposes are the files found in the /perfigo/logs directory on both NAC Appliance Manager and NAC Appliance Servers.
Table 14-5. NAC Appliance Manager and Server Log Locations
Understanding and Changing Logging Levels of NAC Appliance
NAC Appliance Manager and Server have three logging levels available for support logs. They are Severe (the default), Info, and All. These levels can be changed on the Manager using the Administration > Clean Access Manager > Support Logs page. They are changed on NAC Appliance Server by using the Monitoring > Support Logs page. This page can be accessed only by using the Server's direct access web console found at https://<server IP>/admin. Altering these settings changes the level of detail recorded in the support files found in the /perfigo/logs directory of both the Manager and Servers.
Note
Changing the logging level on the Support Log page does not affect the events shown in Monitoring > Event Logs.
In most cases, if you are troubleshooting a problem, it is recommended that you change the logging level to All. The All logging level should be used with care because it causes the log file to grow very quickly. In addition, the All logging level can use significant system resources. The logging level should be reset to Severe, the default, after troubleshooting has been completed. Logging settings will be reset to default values after a NAC Appliance reboot/restart.
To access the generated log events, you have two options:
- Open an SSH (Secure Shell) connection to NAC Appliance and use the Linux CLI. The files are stored in the /perfigo/logs directory.
- Download the support logs to your PC from the Manager by clicking the Download button shown in Figure 14-10, and from the Server by clicking the Download button shown in Figure 14-11.
Figure 14-10. Support Logs Configuration Page for NAC Appliance Manager

Figure 14-11. Support Logs Configuration Page for NAC Appliance Server

Figure 14-10 shows the Support Logs configuration page for NAC Appliance Manager.
Table 14-6 provides a description of the different log categories found on the Manager.
Table 14-6. Log Categories for NAC Appliance Manager
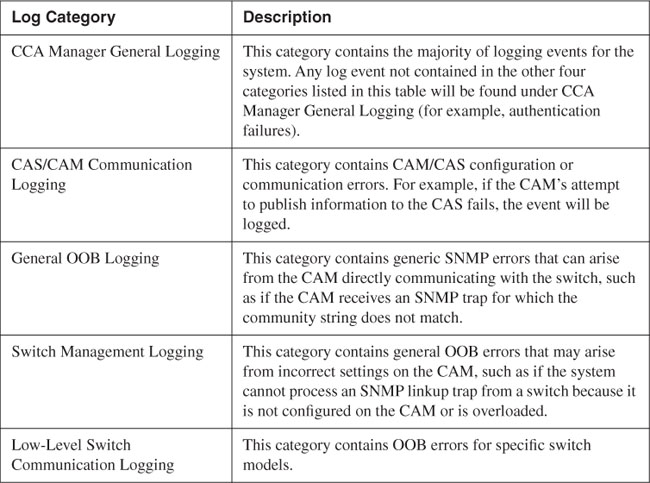
Figure 14-11 shows the Support Logs configuration page for NAC Appliance Server. You will notice that the logging categories on NAC Appliance Server differ from those found on NAC Appliance Manager. Understanding what is logged where will help you during troubleshooting.
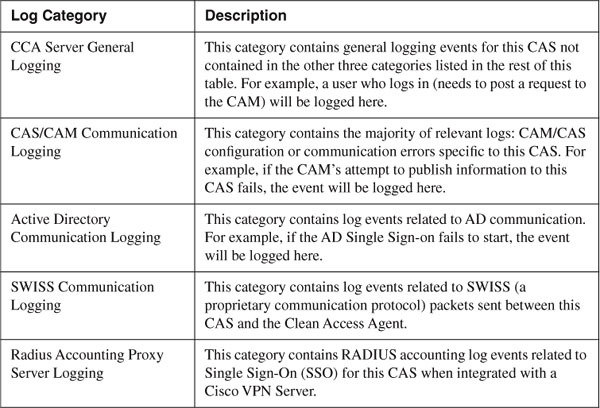
Table 14-7 provides a description of the different log categories found on NAC Appliance Server.
Table 14-7. Log Categories for NAC Appliance Server
SNMP
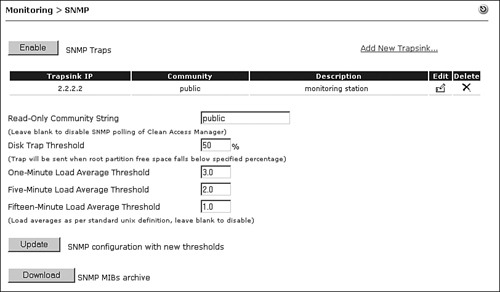
Most environments have an SNMP-monitoring tool, such as HP OpenView or SolarWinds, monitoring their network devices. This is done using a combination of SNMP polling and SNMP trap receiving. It is recommended to have your SNMP-monitoring tool poll and receive SNMP traps from NAC Appliance. This is done by configuring SNMP on NAC Appliance Manager under Monitoring > SNMP. Note that NAC Appliance supports only SNMP version 1 and SNMP is disabled by default. Clicking the Enable button next to SNMP Traps, shown at the top of Figure 14-12, enables both SNMP polling and traps on NAC Appliance Manager. Figure 14-12 shows an example of the SNMP configuration page.
Figure 14-12. SNMP Configuration Page
To configure SNMP polling, perform the following:
Step 1. Go to the Monitoring > SNMP configuration page.
Step 2. Enter a string value in the Read-Only Community String field. NAC Appliance Manager will respond to snmpget and snmpwalk requests sent with the correct community string. Leave the field blank to disable SNMP polling.
To configure SNMP traps, perform the following:
Step 1. Go to the Monitoring > SNMP configuration page.
Step 2. Click the Add New Trapsink link. A new configuration page opens. You can add multiple trap destination servers in this way.
Step 3. Enter the IP address of the receiving trapsink server.
Step 4. Enter the SNMP community string that all traps should be sent with.
Step 5. Enter an optional description of the trapsink server.
Step 6. Click the Update SNMP Trapsink Table button.
Step 7. Specify values for the following fields:
— Disk Trap Threshold (%) The default is 50%. An SNMP trap will be sent when the root partition's free disk space falls below the specified percentage.
— One-Minute Load Average Threshold The default is 3.0. An SNMP trap will be sent when the One-Minute Load Average exceeds the threshold specified. This is the same load value that you would find if you issued the uptime command from the Linux console of the Manager. For example, a value of 2.0 means that over a one-minute period, two processes were stuck waiting for system resources (CPU, disk, or network) to free up. If the value specified is exceeded, a trap is generated. Leave blank to disable.
— Five-Minute Load Average Threshold The default is 2.0. This setting is the same as One-Minute Load Average Threshold except that it monitors a five-minute period.
— Fifteen-Minute Load Average Threshold The default is 1.0. This setting is the same as One-Minute Load Average Threshold except that it monitors a 15-minute period.
Step 8. Click the Update button next to the SNMP Configuration with New Thresholds text.
When enabled, the SNMP module monitors the following processes:
- SSH daemon
- Postgres database
- Clean Access Manager
- Apache Web Server
An SNMP trap will also be sent when the following events occur:
- NAC Appliance Manager comes online.
- NAC Appliance Manager shuts down.
- NAC Appliance Manager becomes connected or disconnected to any NAC Appliance Server it manages.
- The SNMP service starts.
Understanding Monitoring of Web Login and Clean Access Agents
Several new monitoring pages become available to you when clients use the host posture assessment features, found under Device Management > Clean Access. These features provide insight into the certification process performed for each client. There are also reports that can be generated for auditing purposes. Given that the use of the posture assessment features is highly recommended for most deployments, you should familiarize yourself with their corresponding agent-monitoring pages. There are two main monitoring pages: the Certified list and the Reports page. This section will go into detail surrounding the best pages to use for troubleshooting, help desk support, and general auditing of clients using the posture assessment features through either the Clean Access Agent or web login.
Clean Access Agent Reports
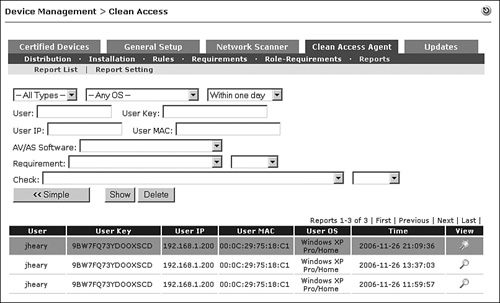
The Clean Access Agent Reports page is an indispensable resource for troubleshooting why clients who use the Clean Access Agent are failing certification. These reports are not available to web login clients. It also serves as a nice auditing and reporting tool. The Reports page shown in Figure 14-13 lists the agent reports. The report list includes the following information: username, user key, user IP, user MAC, user operating system, login time, and Report View icon. Reports from clients that have failed one or more required checks are highlighted with an orange background.
Figure 14-13. Clean Access Agent Reports Page
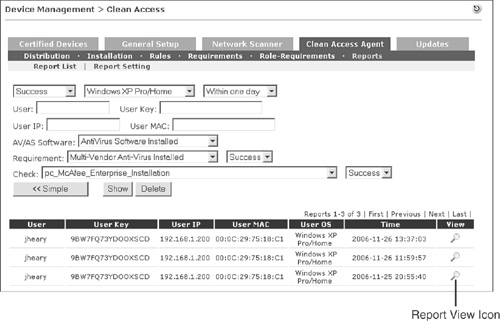
The search criteria shown allows you to customize the view to your needs. For example, a user calls the help desk reporting that he is failing some of the posture assessment checks and wants to know why. To speed things up, you perform a custom search like the one shown in Figure 14-14.
Figure 14-14. Customized Clean Access Agent Reports View
To find reports efficiently in environments with many clients, using custom views becomes a mandatory practice. You can also use the report search for auditing purposes. For example, you could run a search to find all users who failed the up-to-date antivirus (AV) software requirement. Or you could run a search to find all the users who have the corporate antivirus software installed but not active. Another common use is to search to find the number of users still failing an optional requirement. This will help you gauge what the potential impact might be if you were to start making the requirement mandatory. Ideally, you would like to have the majority of your users passing the requirement before you make it mandatory. This will help minimize the disruption to your user community and your help desk staff.
After you have found the report you would like to examine, click the Report View icon; it looks like the magnifying glass indicated in Figure 14-14. This opens the report, like the one in Figure 14-15, in a separate window.
Figure 14-15. Clean Access Agent Report View
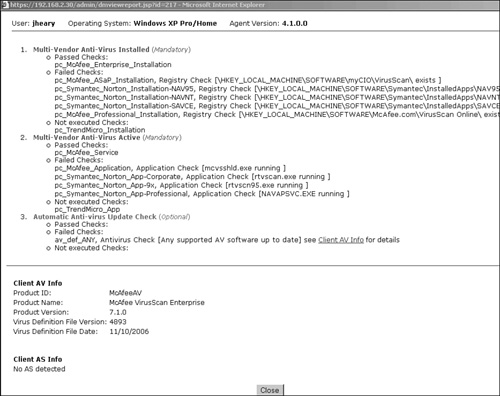
The Agent report contains the following information:
- At the top of the page:
— Username
— Operating system type
— Agent version
- In the middle of the page:
— Each requirement checked is listed in order. Green is used if the requirement passed, red if the requirement failed. The keyword Optional or Mandatory at the end of the requirement name indicates the enforcement level of the requirement.
— Under each requirement, the Passed, Failed, and Not Executed Checks that make up the requirement are listed. Failed Checks may be the result of an "or" operation. Checks found under Not Executed are typically there because they do not apply to the client operating system type.
- At the bottom of the page:
— Client AV Info: This information can be very valuable when troubleshooting failed antivirus requirements and checks.
— Client AS Info: This information can be very valuable when troubleshooting failed antispyware requirements and checks.
The report shown in Figure 14-15 shows the failed optional requirement called Automatic Anti-virus Update Check. This shows up in red on the interface. This is a requirement that checks to make sure the client has up-to-date AV software. As shown, the check looks for any supported AV software that is up to date.
If you look into this further to find out why the check failed, you see that the client AV info indicates that the client is running McAfee VirusScan Enterprise 7.1.0. The virus definition file version is 4893 with a date of 11/10/2006. Next compare this information against what NAC Appliance thinks the latest virus definition file should be to be up to date. To do this, go to the Device Management > Clean Access > Rules > AV/AS Support info page shown in Figure 14-16. This page allows you to search the NAC Appliance database to find the latest AV/AS product information. NAC Appliance frequently checks back with Cisco.com to make sure that this database is kept current.
Figure 14-16. AV/AS Support Info Page

At the bottom of the AV/AS support page, the latest virus definition version and date information are shown for the vendor selected. As you can see, the up-to-date version for All McAfee products is 4904 with a date of 11/24/2006. Because this version is newer than the one found on the client, 4893 with a date of 11/10/2006, the check failed.
Certified List
The Certified list found at Device Management > Clean Access > Certified Devices > Certified List shows all the clients that have successfully passed authentication, scanning, and agent certification (posture assessment). This list shows both Clean Access Agent and web login clients. To be in the Certified list, you must have passed user authentication, passed network scanning (if configured), and passed agent certification checks (if using a Clean Access Agent).
When a host reconnects to the network or logs in to NAC Appliance, NAC Appliance Manager checks to see if the host is already listed in the Certified list. If the host is on the list, network scanning (if configured for the user's role) is not repeated until the client leaves the list. However, Clean Access Agents still go through requirement checks regardless of whether they are on the certified list. The only process bypassed by devices on the certified list is network scanning. All other authentication and posture assessment processes happen normally.
If a certified client roams to another NAC Appliance Server and logs in, it will be forced to go through the certification process again. The Certified list is specific to individual servers. A device is certified only when logged in to the server it originally certified on. Given that scanning requirements can be configured to vary from server to server in a NAC Appliance deployment, forcing recertification ensures that the client is rescanned using the local server's policy.
The Certified list differs from the Online Users list in the way clients are added and removed. All clients that have passed authentication are added to the Online Users list. Only clients that have passed authentication and posture assessment are added to the Certified list. For example, a client in quarantine will show up in the Online Users list but not the Certified list. Clients manually removed from the Online Users list are not removed from the Certified list. Conversely, clients manually removed from the Certified list are also automatically removed from the Online Users list.
Another difference is that the Certified list relies on the client's MAC address, whereas the Online Users list relies on the client's IP address and login credentials. If the client's MAC address is not known to NAC Appliance, it cannot be added to the Certified list. This can be the case in some Layer 3 adjacency deployments of NAC Appliance.
The Certified List is a device list based on the host's MAC address. Because the list is not based on username, it is possible to have a host (unique MAC address) remain on the Certified list even though the user on the host changes.
For example, a shared PC using web login has several different users throughout the day logging in to the network and, therefore, logging in to NAC Appliance. If you want to perform a network scan of each PC only once a day, set the certified devices timer recurrence to 1 day. This will clear the Certified list once every 24 hours. The first person of the day to use the shared PC will be scanned, adding the device to the Certified list. Subsequent users will still have to be authenticated but will not be scanned because the host's MAC address is already registered in the Certified list. When the day ends, NAC Appliance Manager clears the list. On the next day, the process repeats itself. Remember that being on the Certified list affects only network scanner execution, not authentication or agent requirement checks; these are always performed.
Figure 14-17 displays the Certified list and the pop-up for device location. The device location pop-up is available only for OOB clients and is accessed by clicking the icon in the Switch column.
Figure 14-17. Certified List and the Pop-Up for Device Location
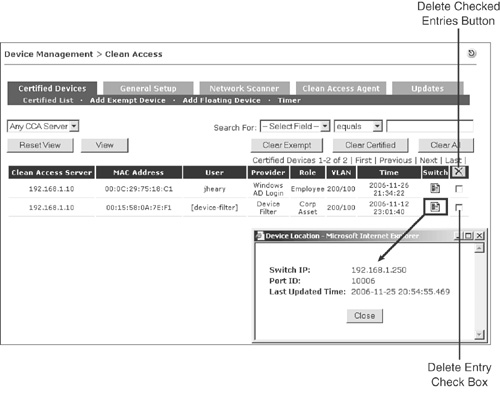
The Certified List page has the following components:
- Clean Access Server Shows the NAC Appliance Server that the client is behind.
- MAC Address The client's MAC address. If not known, 00:00:00:00:00:00 will be displayed.
- User For clients using Clean Access Agent, this column will always show the currently logged-in user. For web login, the username of the first user to log in with this device is shown. If Certify at Every Login is enabled for web login, this field will show the current user.
- Provider Authentication source or server used.
- Role The user's role.
- VLAN Relevant only for OOB clients. The format is authentication VLAN/access VLAN; for example, 200/100. For web login clients, only the access VLAN is shown; for example, /100.
- Time This field shows the time at which the original certification of the device took place. It does not show the time the last user logged in. For that information, you would use the Online Users page.
- Switch Relevant only for OOB clients. When the icon in this column is clicked, it pops up a dialog box showing the device's location. The switch IP, port ID (in index format), and last updated time are also shown.
Note
To match the index style port ID (10006) to its port name (FastEthernet 1/1, for example), go to the Switch Management > Devices > Switches page and click Ports next to the relevant switch.
- Delete Entry check box All checked devices will be cleared from the Certified list when the Delete Checked Entries
 icon is clicked.
Manually and Automatically Clearing the Certified List
If you want to ensure that users are periodically network scanned, you must remove the device from the Certified list. A device remains on the Certified list until
- The list or device is manually cleared by an administrator.
- The list is automatically cleared using the certified devices timer.
- The user logs out or disconnects from the network. The device is cleared only if the Require Users to Be Certified at Every Web Login feature is enabled for the user's role. Otherwise, the device remains on the certified list.
You can clear the Certified list manually or automatically. To manually clear the list, you have four options:
- Check the Delete Entry check box next to the devices you want to remove and click the Delete Checked Entries button.
- Clear all certified devices by clicking the Clear Certified button shown in Figure 14-17.
- The Clear All button clears both exempt devices and certified devices from the list. This will require you to re-enter any previously exempt MAC addresses using the Add Exempt Device page.
- Clear all exempt devices by clicking the Clear Exempt button shown in Figure 14-17. Exempt devices are manually added or added via the API interface of an external program. Devices on the Exempt list are not checked for Clean Access requirements.
Caution
If you manually or automatically remove a device that is connected using Out-of-Band mode, NAC Appliance will immediately change the device's switch port back to the authentication VLAN. As a result, if port bouncing is not enabled, the client will be left with a DHCP-obtained IP address relevant only for the access VLAN. It is then necessary to manually issue a DHCP release/renew on the client or wait for the DHCP lease to time out before the client can communicate and log in again. Therefore, a best practice is to clear the certified list only during nonpeak times, such as 1 a.m., weekends, or in emergency cases. This will be fixed in a future release of NAC Appliance. In-band clients do not have this issue, nor do clients in OOB when port bouncing is enabled.
To clear the Certified list automatically, you must create a certified devices timer as shown in Figure 14-18.
Figure 14-18. Creating a New Certified Devices Timer

The list will be initially cleared at the start date entered. It will be subsequently cleared according to the recurrence interval you configure. Table 14-8 describes the options found on the Timer configuration page (see Figure 14-18).
Table 14-8. Certified Device Timer Options

It is possible, and likely, that you will configure multiple device timers in your NAC Appliance solution. For example, you might configure a timer that clears the list once a month for the Employee user role and have a separate timer for the Guest user role that clears the list once a day. It is also very common to create a timer on a per Cisco NAC Appliance Server basis. Each timer is then set to clear on different days. This lessens the impact on the database and help desk, scales better, and creates a kind of rolling refresh effect.
Requiring Certification for Every Login
If you have a shared PC or a multiuser device, such as a VPN concentrator or wireless controller, and you want each user to be network scanned regardless of the device's presence on the Certified list, you have two options:
- Configure the device as a floating device.
- Check Require Users to Be Certified at Every Web Login on the Device Management > Clean Access > General Setup > Web Login page for the user role or roles considered necessary. This works only for web login clients.
For shared PCs using either the web login or agent method, it is recommended to enable the Require Users to Be Certified at Every Web Login feature.
Tip
Even though the feature reads and configures as if it works for only web login, it also works for Clean Access Agents configured to use network scanning. When configured, this forces every agent user to be recertified and network scanned at every login.
For non-PC devices, it is recommended that you use the floating device method. To configure a floating device, follow these steps:
Step 1. Navigate to Device Management > Clean Access > Certified Devices > Add Floating Device.
Step 2. Enter the MAC address, type, and description of the floating device. There are two types available: 0 and 1. Their descriptions are as follows:
— Enter a device with type set to 0 to allow it to be certified for only the duration of a single user session. After user logout, the device must be certified again by the next user.
— Set type to 1 to never exempt the device from certification. This is useful for nonuser devices that channel traffic from multiple users to the network, such as dial-up routers and VPN concentrators.
See Figure 14-19 for a sample configuration of the floating device page.
Figure 14-19. Sample Configuration of the Floating Device Page

Summary of the Behavior of the Certified List
Here is a summary of the characteristics of the Certified list. This summary includes details for its operation using both the Clean Access Agent and the web login.
- Clean Access Agents always perform posture assessment in the form of checks and requirements at every login.
- For network scanning, a device does not perform network scanning if already on the Certified list. However, if Require Users to Be Certified at Every Web Login is enabled, network scanning is always performed.
- For web login, if a device is already on the Certified list, subsequent users of the same host are not forced to recertify the device. This per-user role default behavior can be changed by enabling the Require Users to Be Certified at Every Web Login feature. Remember that every user is still required to pass a unique user authentication process. The preceding applies only to network scanning of the device the user is using.
- It only records the username of the client that originally performed the certification. It does not necessarily display the currently logged-in user. To find the currently logged-in user, go to the Online Users list.
- Clean Access Agent always sends the client MAC address to NAC Appliance. This ensures that a client using the agent will always show up in the Certified list regardless of whether it is Layer 2 or 3 adjacent to NAC Appliance Server.
- By default, web login does not send the client's MAC address to NAC Appliance. However, you can enable the optional web client to detect the client's MAC address and operating system. The web client is an ActiveX or Java applet that loads with the Web Login page.
- Manually removing a device from the Certified list also removes it from the Online Users list. However, removing a user from the Online Users list does not remove that user from the Certified list.
- When you remove an OOB client, the client's switch port is immediately moved back to the authentication VLAN. However, if port bouncing is not enabled, the client must manually issue a DHCP release and renew to obtain an IP address in the authentication VLAN. This will be fixed in a future release of NAC Appliance.
Monitoring the Status of NAC Appliance Manager and NAC Appliance Servers
NAC Appliance has several pages where you can obtain the status of the Manager and the Servers. This section will explore the most useful monitoring pages available to you. These pages can come in handy when troubleshooting issues or just monitoring performance.
Manager and Server Monitoring Using the Linux CLI
Both the Manager and Server run Linux operating systems. Specifically, they run Fedora Core 4 with a proprietary kernel. As a result, most of the built-in Linux monitoring commands are available to you via the CLI. If you want more information about the usage of a command, the manual pages are available to you, such as man netstat. You can access the CLI via an SSHv2 session to either the Manager or Server. Be sure to log in as root. The most useful CLI monitoring commands are as follows:
- ifconfig Displays the status and configuration information for all Ethernet ports. The interface is connected properly if it displays UP and RUNNING in the output and shows no packet errors; see Example 14-1 for an example. Note: A small number of packet errors is no cause for alarm.
Example 14-1. ifconfig Output Example
[root@NAC-Manager perfigo]# ifconfig
eth0 Link encap:Ethernet HWaddr 00:0C:29:92:C6:05
inet addr:192.168.3.10 Bcast:192.168.3.255 Mask:255.255.255.0
UP BROADCAST RUNNING MULTICAST MTU:1500 Metric:1
RX packets:180388 errors:0 dropped:0 overruns:0 frame:0
TX packets:321123 errors:0 dropped:0 overruns:0 carrier:0
collisions:0 txqueuelen:1000
RX bytes:18154301 (17.3 MiB) TX bytes:78289696 (74.6 MiB)
Interrupt:10 Base address:0x1080
- top Displays the CPU and memory utilization. It also displays the average load on the device. This command updates/runs continuously; to stop it, press Ctrl-c. If your users are complaining of slow NAC Appliance performance, this is an excellent command to run. It will show you the total system utilization as well as the processes using the most CPU and memory.
- netstat If used with the –rn arguments, it shows the routing table of the device, such as netstat –rn. If run with no arguments, it shows you all the TCP and UDP connections that are active. Under normal conditions, you should see at least two connections between the Manager and Server, similar to the ones shown in Example 14-2.
Example 14-2. netstat Output Example
[root@NAC-Manager perfigo]# netstat
Active Internet connections (w/o servers)
Proto Recv-Q Send-Q Local Address Foreign Address State
tcp 0 0 NAC-Manager:https nac-server.jheary.com:10285 ESTABLISHED
tcp 0 0 NAC-Manager:32861 nac-server.jheary.com:8995 ESTABLISHED
- cat/perfigo/build This command displays the current version of NAC Appliance.
Several other Linux monitoring commands are available, but these are typically the most used.
Manager and Server Monitoring Using the Web GUI
There are almost no pages devoted to monitoring NAC Appliance Manager itself in the web GUI. In fact, there are only two pages of note. The first one allows you view the active administrator sessions on the Manager, and the other allows you to obtain the Manager's version information. The Active Administrator Sessions page is located at Administration > Admin Users > Active Sessions. You can also set the auto-logout interval for inactive administrator sessions on this page.
To view the Manager's software version information, head to Administration > Clean Access Manager > System Upgrade. Along with the current version information is the list of upgrade logs and details.
NAC Appliance Server has a few more pages devoted to monitoring. These pages are found using the NAC Appliance Manager Web GUI. They are as follows:
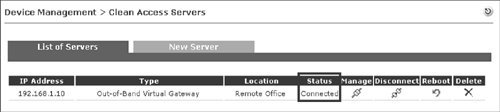
- Status page This page, shown in Figure 14-20, lists all NAC Appliance Servers configured to communicate to the Manager. Their current connection status is also shown. Under normal conditions, the page should display a status of Connected. If there is a problem, it will display Disconnected.
Figure 14-20. List of Servers Status Page
- Server Process Status page This page, shown in Figure 14-21, displays the status of several services. Of particular note is the Active Directory SSO service. If its status displays as Started, you have properly configured AD SSO and it is successfully communicating with its AD domain controller. If AD SSO is not working, this service shows a status of Stopped.
Figure 14-21. Server Process Status Page

- Server Version Info page To find the current version and the upgrade logs and details, go to Device Management > Clean Access Servers > Manage > Misc > Update.
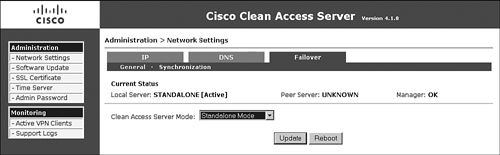
- Server Failover Status page This page, shown in Figure 14-22, shows the current failover state of the server, the status of its connection to the Manager, and its peer server's IP address. This page can only be accessed using the server's direct web access console (https://<server's IP>/admin).
Figure 14-22. Server Failover Status Page
Summary
This chapter covered three main topics: understanding the various monitoring pages and event logs, understanding monitoring of Clean Access Agents, and monitoring the status of NAC Appliance Manager and Servers. The material covered in each topic will assist you in the efficient monitoring and troubleshooting of your NAC Appliance deployment.