
Before building and using the LED photometer, we first need to figure out exactly which wavelengths of light each of our LEDs is sensitive to. Otherwise, we won’t be able to get good data with the photometer. Unfortunately, no LED datasheet that we’ve ever seen troubles itself with listing LED input wavelength, because LED manufacturers generally don’t think of their products as input devices. Fortunately, we can determine input wavelengths with a gadget we can build ourselves: the LED sensitivity detector.
Your mission, should you choose to accept it, is to determine the peak input wavelength for a series of LEDs. You will do this by shining every wavelength of visible light, from 350–700 nm, into each candidate LED, and measuring that LED’s responsive voltage. The LED that’s most sensitive to the wavelength is the one that produces the highest response voltage. Good luck.
How are we going to generate every visible wavelength of light to test our LEDs, from ultraviolet to infrared? If your answer is "use a full-spectrum LED," you’re correct. This special type of LED is called an RGB LED and it can output red light, green light, blue light, and any combination of those colors: the full ROY G. BIV. Since it’s beyond the scope of this book to go too deeply into the science of combining light to make different colors, suffice it to say that by mixing varying intensities of red, green, and blue light, just about any color can be reproduced. (Look very carefully at the pixels of your computer screen to see this in action.)
| Amount | Part Type | Properties/(Assembly Code) |
|---|---|---|
1 | Loudspeaker | (SPKR1) |
1 | TEST LED, 5 mm | 5 mm [THT]; (LED2) |
1 | RGB LED (com. anode, rbg) | 5 mm [THT]; pin order rgb; polarity common anode; rgb RGB (LED1) |
2 | 47 Ω resistor | Package THT; tolerance ±5%; bands 4; resistance 47 Ω; pin spacing 400 mil (R1 & R2) |
1 | 62 Ω resistor | Package THT; tolerance ±5%; bands 4; resistance 62 Ω; pin spacing 400 mil (R3) |
1 | Arduino UNO R3 | (Arduino1) |
1 | LCD screen | Character type 16 pins (LCD1) |
1 | Permanent marker in a dark color |
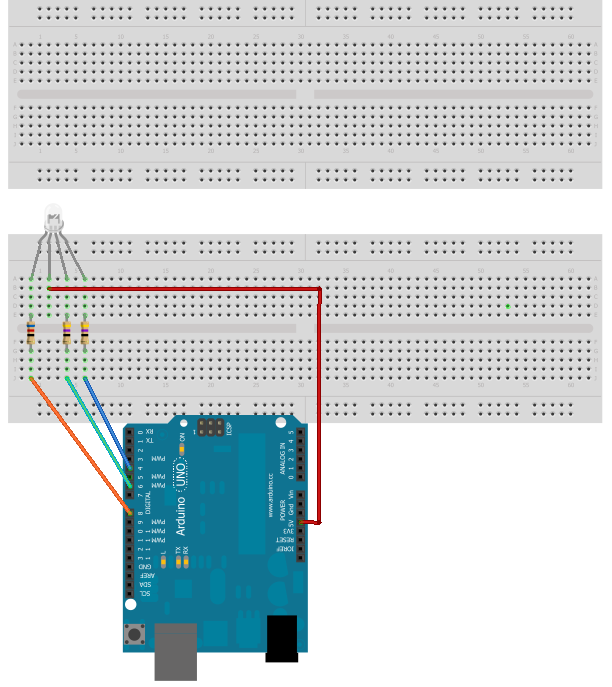
- Connect the RGB LED to Arduino. Most RGB LEDs are common anode, so follow the datasheet that came with your LED to connect the anode to the +5 pin on Arduino (Figure 4-1). The R, G, and B pins should be connected to Arduino pins 8, 6, and 4, respectively. For our RGB LED, the red cathode needed a 62 ohm resistor, while the green and blue cathodes needed a 47 ohm resistor. (Your values may vary.)
Note
When we say “connect an LED to Arduino” in these instructions, we intend for you to do this via a breadboard and jumper wires, as illustrated in the figures for each step. Given the amount of gadget handling involved in testing a bunch of LEDs, using a breadboard will save a lot of wear and tear on Arduino.
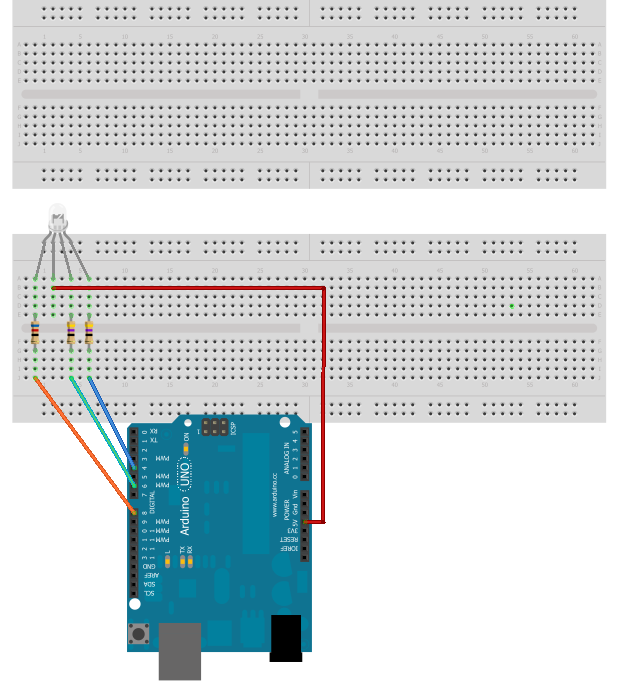
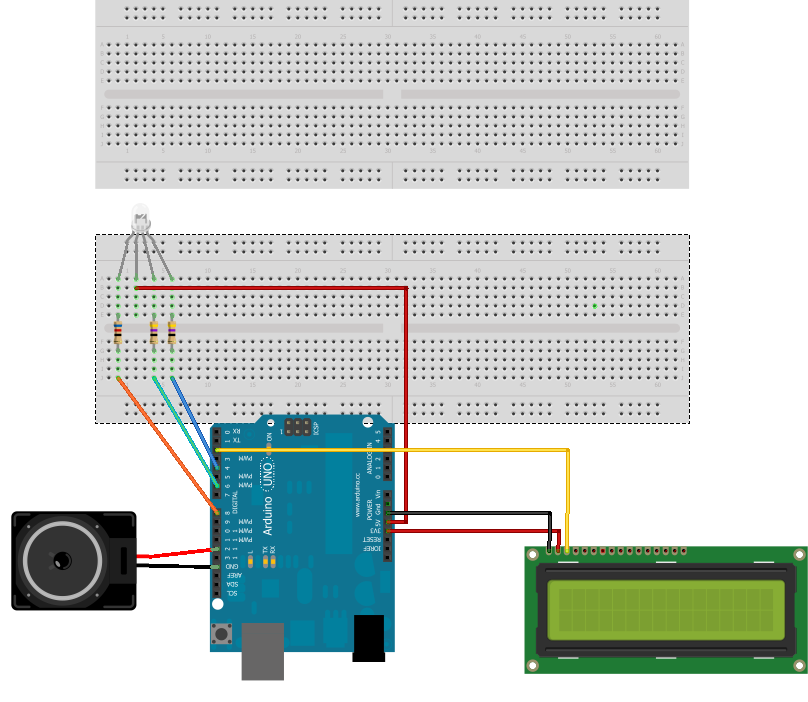
- Connect the LCD. Connect the common ground lead on the LCD (screen display) to the GND pin on Arduino. Connect the VCC lead on the LCD to the 3.3 power pin on Arduino. Connect the DATA lead on the LCD to Arduino pin 2 (Figure 4-2).
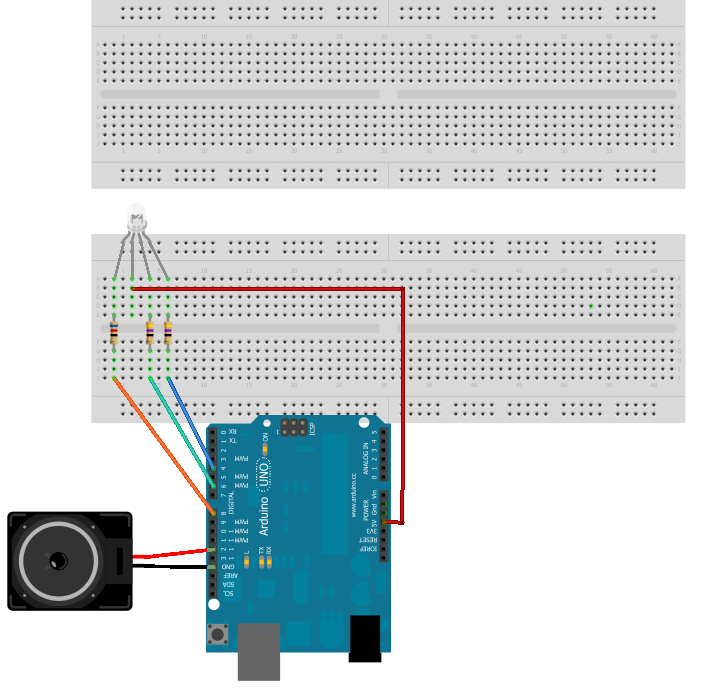
- Add an audio speaker for additional fun. Connect the speaker’s black wire to GND on Arduino, and the speaker’s red wire to Arduino pin 8. The schematic looks something like Figure 4-3.
- Load the sketch. Now we need a way to translate a wavelength of light into its red, green, and blue values. Fortunately, a scientist named Dan Brunton has developed a formula that will do just that. We programmed Brunton’s algorithm into the following Arduino sketch. After setting up all the components, running this code will cause the RGB LED to emit light from 350–700 nm, the range of visible light.
You can find this sketch in the AMWA GitHub repository.
 /**
 * Determining RGB color from a wavelength
 * The code is based on an algorithm from Dan Bruton's Color Science Page.
 * http://www.midnightkite.com/color.html
 * by Patrick Di Justo
 * 2012 08 28
 *
 **/

#include <EEPROM.h>
#include <SoftwareSerial.h>

//Set up the Liquid Crystal Display
#define LCDIn 3
#define LCDOut 2
SoftwareSerial mySerialPort(LCDIn, LCDOut);

//LCD Display buffers
char databuff[16];
char dispbuff[16];

// Variables needed for RGB calculations
float Gamma = 1.00;
int MaxIntensity = 255;
float fBlue;
float fGreen;
float fRed;
float Factor;

int iR;
int iG;
int iB;

//Our eyes can generally see light wavelengths between 350 and 700 nanometers.
//Here, we start the RGB Led with 350
int i = 350;

//RGB is plugged into these arduino digital pins
const int redOutPin = 8;
const int greenOutPin = 6;
const int blueOutPin = 4;

// LED to be tested is plugged into A0
int testPin = A0;

// variables to store the value coming from the sensor
int sensorValueTest =0;
int oldTest =0;
int peaknm =0;

//EEPROM start data
int addr=0;

//Music
int notelen = 90;
int dlx = 130;

void setup()
{
  pinMode(LCDOut, OUTPUT);
  pinMode(LCDIn, INPUT);

//Set the RGB LED pins to output

  pinMode(redOutPin, OUTPUT);
  pinMode(greenOutPin, OUTPUT);
  pinMode(blueOutPin, OUTPUT);


// Initialize the LCD display
  mySerialPort.begin(9600);
  mySerialPort.write(0xFE);
  mySerialPort.write(0x01);

  // test to see if the RGB LED works
  makeColor(i);
  analogWrite(redOutPin,255-iR);
  analogWrite(greenOutPin, 255-iG);
  analogWrite(blueOutPin, 255-iB);
  delay(5000);
}

void loop()
{

// set the RGB LED to a specific color
  makeColor(i);
  analogWrite(redOutPin, 255-iR);
  analogWrite(greenOutPin, 255-iG);
  analogWrite(blueOutPin, 255-iB);
  delay(500);

// read the sensitivity of the Test LED
  sensorValueTest= analogRead(testPin);

  if (sensorValueTest > oldTest)
  {
    oldTest = sensorValueTest;
    peaknm = i;
  }

// Display the values on the LCD
  sprintf(databuff,"CV:%3d Cnm:%3d",sensorValueTest,i);
  sprintf(dispbuff,"%-16s",databuff);
  mySerialPort.print(dispbuff);

  sprintf(databuff,"XV:%3d Xnm:%3d",oldTest, peaknm);
  sprintf(dispbuff,"%-16s",databuff);
  mySerialPort.print(dispbuff);


  writeData();
  i++;

  // If we've reached the upper limit of 700 nm, play a little melody
  if (i>700)
  {
    for (int f = 0; f<=100; f++)
    {
      tone(7,196,notelen);
      delay(dlx);

      tone(7,131,notelen);
      delay(dlx);

      tone(7,261,notelen);
      delay(dlx);

      tone(7,330,notelen);
      delay(dlx);

      tone(7,294,notelen);
    }
    delay(10000);
  }
}


void writeData()
{
  int quotient = i/256;
  int mod = i % 256;

  EEPROM.write(addr++,quotient);
  EEPROM.write(addr++,mod);

  quotient = sensorValueTest/256;
  mod = sensorValueTest % 256;
  EEPROM.write(addr++,quotient);
  EEPROM.write(addr++,mod);
}


void makeColor(int lambda)
{
  if (lambda >= 350 && lambda <= 439)
  {
    fRed    = -(lambda - (float)440.0) / ((float)440.0 - (float)350.0);
    fGreen = (float)0.0;
    fBlue       = (float)1.0;
  }
  else if (lambda >= (float)440.0 && lambda <= (float)489.0)
  {
    fRed        = 0.0;
    fGreen = (lambda - (float)440.0) / ((float)490.0 - (float)440.0);
    fBlue       = 1.0;
  }
  else if (lambda >= (float)490.0 && lambda <= (float)509.0)
  {
    fRed = 0.0;
    fGreen = 1.0;
    fBlue = -(lambda - (float)510.0) / ((float)510.0 - (float)490.0);

  }
  else if (lambda >= (float)510.0 && lambda <= (float)579.0)
  {
    fRed = (lambda - (float)510.0) / ((float)580.0 - (float)510.0);
    fGreen = 1.0;
    fBlue = 0.0;
  }
  else if (lambda >= (float)580.0 && lambda <= (float)644.0)
  {
    fRed = 1.0;
    fGreen = -(lambda - (float)645.0) / ((float)645.0 - (float)580.0);
    fBlue = 0.0;
  }
  else if (lambda >= 645.0 && lambda <= 780.0)
  {
    fRed = 1.0;
    fGreen = 0.0;
    fBlue = 0.0;
  }
  else
  {
    fRed = 0.0;
    fGreen = 0.0;
    fBlue = 0.0;
  }

  if (lambda >= 350 && lambda <= 419)
  {
    Factor = 0.3 + 0.7*(lambda - (float)350.0) / ((float)420.0 - (float)350.0);
  }
  else if (lambda >= 420 && lambda <= 700)
  {
    Factor = 1.0;
  }
  else if (lambda >= 701 && lambda <= 780)
  {
    Factor = 0.3 + 0.7*((float)780.0 - lambda) / ((float)780.0 - (float)700.0);
  }
  else
  {
    Factor = 0.0;
  }
  iR = factorAdjust(fRed, Factor, MaxIntensity, Gamma);
  iG = factorAdjust(fGreen, Factor, MaxIntensity, Gamma);
  iB = factorAdjust(fBlue, Factor, MaxIntensity, Gamma);
}

int factorAdjust(float C, float Factor, int MaxIntensity, float Gamma)
{
  if(C == 0.0)
  {
    return 0;
  }
  else
  {
    return (int) round(MaxIntensity * pow(C * Factor, Gamma));
  }
}- Select an LED to test. If you’ve purchased a large number of LEDs to test, they’re likely to arrive in individual plastic pouches. Neatly pull or cut open the plastic pouch containing the LED, take the LED out, and set the pouch aside; you’ll need it again soon (Figure 4-4).
- Connect the LED. Hook up the anode to Arduino analog pin 0, and the cathode to GND (Figure 4-5).

Note
As you test each LED, be careful to plug it into the breadboard with the proper polarity: anode to Arduino’s analog pin 0 and cathode to Ardunio’s GND pin.
Test the LED. For best results, enclose the test LED and the RGB LED in a single small, opaque tube, such as a piece of shrinkwrap tubing, a blackened soda straw, or even the opaque, sawed-off body of a ball point pen. Ideally, the two LEDs should be extremly close without actually touching. When everything is ready, turn on or reset Arduino.
Several things will happen. The RGB LED will start to glow, and the top line of the LCD will inform you that the RGB LED is currently displaying a particular wavelength of light ranging from 350–700 nm. At each wavelength, the test LED absorbs the light being put out by the RGB LED, and converts that to a voltage.
- Low voltage means that the test LED is not absorbing much light at that wavelength; in other words, the test LED is not very sensitive to this color. A higher voltage indicates that the test LED is more sensitive to this particular wavelength and is therefore creating more electricity from the light it absorbs.
- As Arduino works its way up the spectrum, it keeps track of the peak voltage the test LED puts out, and the particular wavelength that caused the peak voltage.
- You’ll know the test is complete when the counter reaches 700 nm, and Arduino plays a little melody.
- Note your results. Using the permanent marker, write your data—the peak voltage and the light wavelength that caused it—on the plastic pouch that you set aside in step four. Carefully remove the test LED from the gadget and slide it back into the pouch.
- Return to step five and hit the reset button on Arduino to repeat the sensitivity test with another LED.
In order to build an LED photometer that works properly, it’s very important to test each LED before you use it in the photometer. You need to know the particular wavelengths of light that your LEDs are detecting, because this impacts the types of gases you’ll be able to detect in the atmosphere, and how well you’ll be able to detect them.
Table 4-1 shows some values we got with a sample of LEDs from different manufacturers. Notice that while the LED peak input value is usually lower than the output value, that’s not always the case. LEDs at the blue end of the spectrum have input wavelengths almost exactly the same as their output wavelengths. As we move down the spectrum toward the red end, the distance between input and oputput wavelength grows, but not uniformly. For example, look at the two yellow LEDs giving off light with a wavelength of 592 nm. Their input values are exactly 20 nm different!
This explains why we said earlier that it is important to test your LEDs. You need to know exactly which peak wavelength your LEDs are absorbing.
Table 4-1. Frequencies of light for various LEDs by part number.
| Manufacturer | Mfgr Part Number | Color | Output nm | Input nm |
|---|---|---|---|---|
Jameco Valuepro | LVB3330 | Blue | 430 | 429 |
Avago Technologies | QLMP-LB98 | Blue | 470 | 471 |
Avago Technologies | QLMP-LM98 | Green | 525 | 498 |
Agilent | HLMP-CM39-UVCDD | Green | 535 | 505 |
Siemans Corporation | LG5469FH | Green | 565 | 507 |
Valuepro | LUY3833H | Yellow | 590 | 537 |
Valuepro | BVT-5E1TT4E | Yellow | 592 | 552 |
Jameco Valuepro | BVT-529TT8E | Yellow | 592 | 532 |
Valuepro | LVY3333/A | Yellow | 595 | 532 |
Valuepro | RL50-PY543 | Yellow | 595 | 517 |
Valuepro | LUE3333 | Orange | 620 | 625 |
Valuepro | UT9C13-86-UDC2-R | Red | 630 | 580 |
Jameco Valuepro | BVT-5E1QT4ER | Red | 634 | 555 |
Valuepro | RL50-PR543 | Red | 635 | 534 |