
CHAPTER 9
When Women Speak, Groups Listen—Sometimes: How and When Women’s Voice Shapes the Group’s Generosity
When Bill Gates was on his way to becoming the world’s richest man, he rejected advice to set up a charitable foundation. … Just three years later, Mr. Gates ranked third on Fortune’s list of the most generous philanthropists in America. In between he welcomed his first child: a daughter. Mr. Gates has reflected that two female family members—his mother, Mary, and his wife, Melinda—were major catalysts for his philanthropic surge. Mary “never stopped pressing me to do more for others,” Mr. Gates said …” “We should help everyone have a decent life.”1
WHEN WOMEN SPEAK, do men listen? Do women speak up for more generosity and cooperation? More generally, under what conditions do women influence others to the same extent as men, and do women create more generosity by frequently “pressing” men—and other women—to “do more for others”?2
In previous chapters, we have explored how group features affect the dynamics of the discussion, including speaking time for men and women, the content of the discussion, and patterns of interruptions. We now turn to the question of group decision making. Normative justifications for deliberation include its ability to consider principles of justice. As Thompson writes, “all [deliberative theorists] agree that to some extent the nature of justice should itself be the subject of deliberation” (2008, 508). In our research design, groups were asked to do exactly that—to discuss principles of just income distribution. Moreover, they were also instructed to reach a collective decision on the level of the minimum guaranteed income—one they would apply as a rule for society but that would also affect their own interests, specifically, the amount they would earn at the end of the experiment.3 In this chapter we explore how the conditions of deliberation affect the definition of justice adopted by both individuals and groups, and how these concepts of justice influence their concrete policy decisions about income redistribution.
As we documented in chapter 7, the preferences of women and men tend to differ with respect to redistributive policies.4 For example, women are more likely than men to be concerned about economic inequality in the United States; to be more supportive of government’s role in addressing economic distress and social needs such as health care; to prefer less room for the free market; and to embrace government spending on the poor, elderly, and children.
These gender differences in policy preferences are directly relevant to the subject of deliberation and decision making in our research design. At the beginning of the experiment, participants were told that they would be asked to discuss and arrive at a group decision about how to redistribute the money earned by group members during the study. Before they came together for the discussion, participants were introduced to four basic principles of income redistribution.5 They did not know the nature of the task they would be doing to earn income, to encourage them to think about the principles from the perspective of all different income levels.6 They were encouraged to think about the values they most prized and to consider the question of what is most fair or just. Moreover, they were instructed to make a decision that would apply to their group and to the society at large.
The handbook participants received prior to deliberation summarized each principle as follows:
1. Maximize The Floor Income: “Help Those Who Have The Least”
Value Statement: The most just distribution of income is most concerned with the poorest among us. Application: The higher incomes are taxed so that everyone receives at least 80% of the group’s average income.
2. Set A Floor Constraint: “Ensure Everyone Has Enough To Get By”
Value Statement: The most just distribution of income provides a safety net of guaranteed income no one can fall below. Application: The group must set a dollar amount for the floor, and all incomes above the floor will be taxed enough to raise everyone to that floor. If your group does not happen to produce enough to achieve the floor you set, we will reset the floor to be 80% of the average.
3. Set A Range Constraint: “Reduce The Extremes Of Rich And Poor”
Value Statement: The most just distribution of income increases equality by reducing the differences between the rich and the poor. Application: The group sets a dollar amount for the range. Money is redistributed from high incomes to low incomes until they fall within the set range. If incomes are already within the set range, no action is taken, even if the low income is below average, and as low as zero.
4. No Taxes Or Redistribution: “I Keep What I Earn”
Value Statement: The most just distribution of income best rewards those who produce the most. Application: Everyone keeps exactly what they earn, no more and no less.
Groups were asked to set a dollar amount for the floor or range, unless they chose no redistribution.
Each principle represents a different way of thinking about inequality and a different way of addressing it. The handbook offered participants some helpful information about the values associated with each principle, about how the principles would be applied to their earning from the income-earning work tasks they would perform during experiment, and about the concrete implications of each principle for those at all different income levels in society. After reading the handbook and walking through some examples of how each principle would be applied, participants were given a brief quiz to be sure they understood each principle thoroughly. Finally, each participant was asked to rank the principles in order of their private, individual preferences.
Prior to deliberation, there is a gender gap in preferences consistent in nature and size with the gap documented in other studies.7 For one, women are much less likely than men to favor the least generous principle: no taxes or redistribution. Second, although the most popular principle among both men and women is setting a floor, women favor this at significantly higher rates than men.8 The gender differences in support for the other two principles—maximizing the floor and setting a range—are small and not statistically significant. Deliberation does not change this pattern (as the bottom half of chapter appendix table A9.1 shows).
Aside from replicating the typical gender gap among national samples and on issues of public policy, these results also replicate the “real world” in another important sense. They show that before and after deliberation, the most commonly preferred principle was setting a floor. This is also the principle ultimately chosen by nearly 90% of the groups.9 That nearly every decision ultimately settled on the actual system of redistribution in capitalist systems is further testament that our participants were thinking the same way that citizens do about how the political system should approach redistribution. That is, they were guided by the principle that the worst-off should get some protection from utter destitution, but that otherwise, individuals keep what they earn.
An example from a majority-rule group with four women illustrates these patterns well. In this exchange, which occurs early in the discussion, several group members chime in to state their views about the principles. Two women in the group begin by arguing for setting a floor, comparing it to the minimum wage and adding that they like the principle because they want to preserve some role for “personal incentive.” A man responds that he favors no redistribution because it rewards merit and gives an incentive to “do something great in society.” The first woman pushes back, though, to point out that equality of opportunity is not yet a reality and that this fact needs to play a role in the group’s choices.
0:07:14.8 |
Woman A: I like the floor constraint because it’s just like the minimum wage, but yeah, still. As long as, as long as it’s not high, it still has personal incentive. |
0:07:28.0 |
Woman D: Yeah, I agree with that. I thought the setting a range constraint can be a little bit too extreme sometimes and I thought the same about the maximizing the range income. And I really like the floor constraints. I didn’t like no tax redistribution. Didn’t think that was fair— |
0:07:48.1 |
Man C: My opinion was actually for no redistribution because that’s what I consider to be fair. ’Cause you’re getting money based on your performance. If you perform well then somebody’s taking money away from you. I mean even if I were in the lowest income bracket I don’t want to be taking money away from someone else who’s actually earned it. ’Cause the difference between being rich because your dad was rich and being rich because you’ve actually done something great in society. And I don’t believe we should be taxing the people who just make the most money because they’re actually doing something useful. It’s something that’s been happening in our society. We see them as needing to help the poor. |
0:08:26.6 |
Woman A: You know, I think the only problem with that is that that’s assuming that our society is completely just and it’s completely based on capitalism. Which if we’ve lived in a completely capitalist system and everyone were given an equal opportunity thing, then yes I would be all for it. But, I mean I think—go all the way and say that it’s completely determined by chance or it’s completely determined by ability. |
Discussions like these can be found throughout our transcripts. The participants state their preferences, explore the reasons for and against each alternative, and ultimately converge on a principle that they consider to be “most just.” In what follows, we analyze the patterns of these deliberations and collective choices.
WHEN ARE WOMEN THE FIRST TO ARTICULATE A PREFERENCE?
We begin by asking who sets the agenda—that is, who weighs in first to articulate a preference about the principles under discussion. Previous studies have shown that agenda setters can have a strong effect on group choices—especially when those agenda settings are high-status members of the group (Dubrovsky, Kiesler, and Sethna 1991; Hoffman 1978; McGuire, Kiesler, and Siegel 1987). Given its potential influence, this agenda setting represents an important form of power (Bachrach and Baratz 1962). So one measure of women’s standing in the group is their willingness to speak up first and communicate what they wish the group to choose. We created a variable indicating who set the agenda for the group by being the first to publicly advocate for a principle. We asked coders to read each transcript and find the first moment when any member of the group indicated his or her support for one of the principles of redistribution.10 If our interaction hypothesis is correct, then we should find that women are more willing to articulate the first preference and thus attempt to set the agenda where the combination of decision rule and gender composition gives them increased authority.
The results confirm this expectation about the women’s attempts to set the agenda. Where women’s status is lowest—as the gender minority under majority rule—they articulate the first preference in the discussion in only 12.5% of the groups; the same minority under unanimous rule articulates the first preference in 37.5% of the groups. As the gender majority, however, women set the agenda in approximately 60% of the groups, regardless of rule. But rule does matter even when women are the large majority: in four-female groups, women set the agenda 75% of the time under majority rule, but only 50% of the time under unanimity. Chapter appendix table A9.2 shows that the strong interaction effect between gender composition and decision rule persists in the presence of controls.11 The likelihood of having a female agenda setter increases under unanimity as the number of women in the group increases (see the positive and significant coefficient for Number of Women in chapter appendix table A9.2).12 Under both decision rules, women are more likely to be agenda setters as the number of women in the group increases, but the interaction term shows that the difference-in-differences is significant; in other words, the effect is larger under majority rule than under unanimity.
If our argument about empowerment is correct, the conditions that elevate women’s status in the group should also increase the likelihood of the group actually choosing the agenda setter’s preference.13 The number of gender-mixed groups where a woman was the first to express her preferences is limited in some of the conditions, preempting a definitive statistical test, but the data suggest that women are more successful at persuading the group to support the principle they first espoused in the conditions where they are most empowered. When women are the majority, female agenda setters are more successful under majority rule (78%, N = 9) than under unanimity (50%, N = 10), and this difference is marginally significant.14 In addition, as the interaction hypothesis predicts, when minority women are empowered by unanimity rule, the group chooses the female agenda setter’s preference every time (100%, N = 6), as compared to only half the time under majority rule (50%, N = 2). Put differently, the power of numbers helps women under a rule that favors numbers (78% of majority-female groups versus 50% of minority-female groups), while it does not help when the rule favors minorities (50% of majority-female groups versus 100% of minority-female groups under unanimity). The results thus suggest not only that women are more likely to set the agenda but may also be more successful in doing so in conditions where the combination of rule and gender composition favors them.
WHEN IS WOMEN’S CONFIDENCE IN THEIR VIEWS ENHANCED?
Another way to analyze the empowering effect of a discussion on women is to see whether it increases their confidence in their own mind. As we explained in chapters 2 and 3, one of the difficulties women experience in the world of public affairs is that they are not confident that they are competent enough to influence others. And in chapter 6, we saw that women’s predeliberation confidence influenced their patterns of participation. In addition, we reported in chapter 8 that negative feedback during discussion affects women particularly negatively. A discussion can be deemed equalizing in part if it succeeds in increasing women’s certainty that their opinions are valid. To the extent that women encounter a respectful and engaged response during discussion, they may become more certain that their views have merit. That in turn could create a felicitous feedback loop in the future, where women may be more ready to put their views forward for others to consider.
In the predeliberation survey, immediately after asking participants to rank the principles, we also asked them how sure they felt about their rankings. Five response options were provided, ranging from “very unsure” (coded 1) to “very sure” (coded 5).15 We then asked the exact same question, this time about their opinion after deliberation. We expect that conditions that empower women during discussion will increase their certainty about their own preferences (which, for the most part, do not change). These expectations are borne out in the data: the settings where women are more empowered are the settings that increase women’s certainty after discussion. Table 9.1 presents the OLS regression coefficients from our familiar model interacting decision rule and gender composition, with controls for experimental location, egalitarianism, number of egalitarians in the group, the interaction of egalitarians and rule, and predeliberation certainty over one’s preference ranking of the four principles, separately for women and men. Predicted values from Models 1 and 3 are in figure 9.1.
Before describing the results, we note that the conditions have no effect on predeliberation certainty. That means that any effect of the conditions on postdiscussion certainty occurred because the conditions produced different types of discussion.16 After deliberation, women exhibit a pattern fully consistent with our interaction hypothesis. Under majority rule, women are more certain of their views in groups with many women than in groups with few women. But under unanimous rule, a woman in the gender majority is less certain than a woman in the gender minority.17 In line with our expectations about the protective effect of unanimity, women in groups with few women are significantly more certain of their postdeliberation views under unanimity than minority women in groups using majority rule.18
Table 9.1: Effects of Experimental Conditions on Male and Female Certainty about Postdeliberation Preferences, Mixed-Gender Groups Only

Note: Individual-level analysis. Cluster robust standard errors in parentheses. *** p < 0.01, ** p < 0.05, * p < 0.1, two-tailed test.
In other words, the more equal women’s status in the group, the more standing and authority women have, the more that group discussion boosts women’s confidence in their postdeliberation preference. As further evidence that this result comes from women’s position of authority, men’s sense of certainty after the discussion has little relation to the experimental conditions. We note, too, that in the case of certainty, women are best off with unanimous rule and few women. That condition produces the most certainty of all, and moreover, it is the only mixed-gender condition where women’s certainty equals men’s (comparing the two panels in figure 9.1).19

Figure 9.1. Certainty about postdeliberation redistribution preferences, by gender and condition. Note: Predicted values from Models 1 and 3 of table 9.1.
As we saw in earlier chapters, women are more likely than men to respond to the group’s signals about the worth of their views. Consistent with that notion, women are more likely than men to rely on group discussion—and specifically, their authority within it—to draw conclusions about the legitimacy of their preferences.
HOW NUMBERS AND RULES AFFECT THE EXPRESSION OF PREFERENCES
To this point, we know that the experimental conditions affect women’s confidence in their opinions in ways that are consistent with our expectations about empowerment or inclusion. With respect to the actual decisions made, we know that most groups implement most women’s preferred principle, but this does not tell us that women are empowered to affect the outcome because men tend to prefer the same principle. We know, too, that women are more likely to set the agenda by being the first to articulate a principle for the group to choose in the conditions where women are more empowered. But the groups quickly agreed on a principle, and it was very often one that both men and women initially tended to favor. This leaves us with additional questions about how often and with what effect women articulate preferences for generosity toward the poor.
Fortunately, we have a second outcome to examine. When groups chose to set a guaranteed minimum income, or poverty line, below which no one would be allowed to fall, they had to make an additional decision: what, exactly, would that minimum income be? Groups had complete freedom to set the floor at a level as generous, or stingy, as they wished.20
Unfortunately, we did not privately ask each individual’s preferred floor amount prior to deliberation, but we do have data on the individual’s expressed preference for the floor. We asked coders to comb through each transcript and to identify every expression of endorsement for a specific guaranteed income.21 While some participants kept their preferences very close to the vest and never publicly commented on any floor amount, a majority of our participants (237 out of 470) did make one or more explicit endorsements.22 This is clearly not a perfect substitute for the privately expressed preferences of each participant before discussion. It tells us nothing about the preferences of those who never declared their preferred minimum incomes, for example, and it may be affected by the discussion that preceded the statement. But this measure does give us a sense of what those participants who did speak up were willing to publicly champion. And in that sense, it is a good reflection of how the groups collectively explored the issue of assistance to the poor. Moreover, our interest is in the conditions that foster, or inhibit, this precise type of action—the willingness to take a public position. So while we cannot use this variable to assess women’s private preferences, we can use it to measure the effects of empowering conditions on women’s willingness to advocate for generous assistance to the poor for the purpose of affecting the group decision.
Before we address the issue of women’s empowerment, we pause to note the general effect of the rule. We have reason to believe that the conditions may affect how much participants speak about their preferences. Specifically, we began by arguing that rules are more than the means to aggregate preferences. Rules breed norms of interaction, and unanimous rule in particular holds out the promise of inclusion and cooperation. Evidence for this proposition was presented in chapter 5, where we found that unanimous rule elevates the group’s talk time. If the rule elevates individual participation, we would observe not only more talk, but also that more people express their preferences under that rule.
And that is what we find. Under unanimous rule, participants in mixed-gender groups speak up more often for their preferred principle or their preferred poverty line, by a statistically significant margin.23 Relatedly, a basic difference of proportions test reveals that more individuals express at least one preference about the floor under unanimity than under majority rule.24 In sum, individuals are not only more likely to speak but also to express preferences for or against a principle under unanimity than under majority rule. The rule draws individuals into the conversation in a substantive way, where they disclose their preferences about the issue under discussion—and tend to do so more often. And all of these patterns apply to women, specifically, as well as men.25
Of course, we are interested not only in whether a preference was expressed but also what those preferences are. Our hypothesis is that the experimental conditions affect the generosity of public endorsements. Consistent with our interaction hypothesis, we find that in mixed-gender groups, the experimental conditions have a substantial effect on the magnitude of the floor preferences expressed by both men and women (analyzed separately).26 Table 9.2 presents the familiar interaction model. The dependent variable is the maximum floor amount endorsed—that is, the deliberator’s most generous preference.27 Data are analyzed at the level of the individual and include controls for individual-level and group-level egalitarianism.28 As the table shows, the basic interaction is large, strongly significant, and in the same direction for both men and women. Both genders expressed support for less generous minimum incomes in groups where women held less power because of the combination of rule and gender composition—majority-rule groups with few women or unanimous rule with many women—and supported comparatively more generous minimum incomes in majority-rule groups with many women or unanimous groups with fewer women.29
Figure 9.2 shows the predicted values that emerge from Models 1 and 3 of table 9.2. As the figure shows, the effects of women’s status on women’s public generosity are substantial. Under majority rule, for example, a woman’s largest endorsed floor is predicted to rise by almost $10,000 as the number of women in the group increases from one to four, moving from just under $21,000 to almost $31,000—nearly a 50% increase. To put this in perspective, $21,000 was the poverty line set by the federal government for a family of four at the time of the study, so $31,000 represents an increase of nearly half the actual income guaranteed to poor families by the federal government. Group-level averages provide further support for these results: in mixed-gender, majority-rule groups with few women, women’s average maximum floor endorsement exceeds $25,000 in only one group. In mixed-gender, majority-rule groups with many women, by contrast, women’s average endorsed floor exceeds $25,000 in 60% of groups. The conditions thus have a profound effect on the floor amounts groups debate.
Table 9.2: Effect of Experimental Conditions on Maximum Endorsed Floor Amount by Gender, Mixed-Gender Groups Only

Note: Dependent variable is maximum endorsed floor amount in thousands of dollars. Individual-level analysis. Cluster robust standard errors in parentheses. *** p < 0.01, ** p < 0.05, * p < 0.1, two-tailed test.
The predicted effect of numbers on men under majority rule is not quite as steep, but is still substantial. Under majority rule, a man’s generosity moves from about $22,000 in groups with only one woman to nearly $28,000 in groups with four women—an increase of nearly 30% over the federal government’s poverty line. At the group level, the average man’s floor endorsement is $22,000 or less in over half of the groups in which men predominate, but never less than $22,000 when women are more numerous. Thus both women and men advocate for meaningfully increased support for the poor when they deliberate in majority-rule groups populated predominantly by women rather than men.30

Figure 9.2: Maximum endorsed safety net, by gender, mixed-gender groups only. Note: Predicted values from Models 1 and 3 of table 9.2.
Under unanimous rule, the effects of gender composition run in the opposite direction, as our interaction hypothesis predicts. With that rule, the average woman’s generosity decreases by $2,000 as the number of women increases from one to four. The negative effect of women’s numbers on men is even more dramatic: nearly $8,000. Taken together, these results show that where women have more equal status—unanimous rule with few women, or majority rule with many women—both men and women tend to endorse more generous floor amounts.31
The interaction continues to hold at the group level, where the dependent variable is the average poverty line endorsed by women in the group, including in the presence of a variety of additional controls. Those include the number of egalitarians in the group, the interaction of egalitarians and rule, the group’s median predeliberation warmth of feeling toward the poor, the number of group members preferring maximum redistribution, and the number of members preferring no redistribution prior to discussion.32
Thus across multiple models with many different potential controls, the result is the same: the conditions where deliberators endorse more generous floor amounts are the same conditions in which we earlier found other indicators of women’s empowerment. That is, groups where women are empowered by rule or numbers, and where women took up more floor time, talked about vulnerable populations, were more warmly received, and were seen and saw themselves as more influential, are also groups where women and men advocate explicitly for more generous policy for the poor.33
We can further parse these relationships by bringing speaking time into the equation, asking what preferences the most talkative men and women advocate and how those differ from the statements of those who talk less. One implication of our interaction hypothesis is that when women are empowered, they should use their greater floor time to express more generosity toward the vulnerable populations they tend to favor. To explore this possibility, we used a slightly different analytic strategy: we regressed the person’s expressions of generosity on their proportion of talk, on an indicator of their gender, and on the interaction between the two, separately in each of the experimental conditions. We present the results for majority-rule conditions in chapter appendix table A9.4. Under unanimous rule (not shown), the relationships we discuss below for majority rule are muted for both men and women.34
Matching our expectations, we find that under majority rule the relationship between the average woman’s talk time and her generous expressions is larger in groups with many women than in groups with few women.35 Figure 9.3 presents the model’s predicted values for men and women in majority-rule groups, with the x-axis in the figure representing participants’ Proportion Talk. It shows that in groups with few women, women at all levels of talkativeness endorse similar—and low—levels of generosity. That is, when women have little authority, the relationship between their talk time and preferred floor amount is small and not statistically different from zero or from the pattern we see for men.
In groups with a majority of women, however, the relationship is positive and large; women who talk more advocate for much more generous policies toward the poor. To be sure, even those women who talk least in this condition tend to advocate floor amounts that are at least the equal of those advocated by the most talkative women in majority-rule groups with few women. But as the right-hand panel of the figure shows, the most talkative women advocate minimum incomes that are nearly $10,000 higher than that.36 In other words, when they are empowered, nearly all women use their floor time to endorse a relatively generous safety net, but those who talk the most leverage their standing to advocate for dramatically increased levels of financial assistance for the poor.
Now we come to a possible dark spot in what so far has been a sunny story of women’s empowerment. Women’s elevated status in the group does not mean that men simply parrot women’s preferences, especially among those men who hold the floor the longest. In fact, in majority-rule groups where women are empowered by their numbers, the most talkative men are estimated to endorse guaranteed minimum incomes that are about $6,000 lower than those endorsed by the least talkative men.37 Although these predicted values still tend to be slightly higher than what talkative men advocate in majority-rule groups with few women, the key point is that the relationship between talk time and generosity is not the same for men and women when women are empowered. Evidence for this conclusion is the statistically significant interaction term in Models 3 and 4 of chapter appendix table A9.4.38 Thus the increase in generosity among men that we saw in figure 9.2 must be somewhat qualified. While some men do match women’s generosity to the poor in majority-rule groups with many women, the most talkative men in these groups push back against the much higher guaranteed incomes advocated by the most talkative women. When the decision rule gives women more overt power because of numbers, the main message from men in these groups is one of resistance to women’s preferences.39

Figure 9.3. Relationship between speaking time and expression of safety net generosity, majority rule/mixed gender groups only. Note: Predicted values from Models 2 and 4 of chapter appendix table A9.4.
While this is bad news for women’s empowerment, it is potentially good news for deliberative democracy. In conditions that empower women, women’s voice rises, but that sound does not drown out men. To the contrary, the debate is sharpened. Deliberators take the floor to define the alternatives clearly and to make their preferences known on more of the key choices before the group.
A more precise test of how the conditions might empower women’s expression of preferences is the extent to which women publicly express support for principles other than their privately disclosed first choice (or the extent to which they publicly oppose those same principles). A woman who is more empowered would be less likely to endorse a principle other than her favorite, and more likely to publicly oppose it. And that is exactly what we find in table 9.3.40 The interaction between the number of women and majority rule decreases the number of times women publicly support principles other than their first preference. That is, women’s empowerment reduces women’s preference falsification. Women’s empowering conditions also increase women’s frequency of opposing their disfavored principles. The example at the beginning of the chapter highlights how such empowerment looks in practice: a woman in a majority-rule group with many women pushes back when a man articulates his preference for no taxes or redistribution.
Figure 9.4 shows the predicted values from Model 1 of table 9.3. Under majority rule, the least empowered women endorse disfavored principles nearly 1.5 times, on average, while the most empowered women do so only rarely. When women are not empowered, the rate of endorsing principles other than their most preferred is nearly six times greater than when they are empowered. That is, figure 9.4 underscores, again, just how disempowered women are when they are few under majority rule. They are far more likely than other women to endorse principles they did not prefer. It is not simply a matter of women remaining quiet because their voices are not needed. Instead, when women do speak up, they are more likely to express a viewpoint with which they privately disagreed prior to the discussion.
The effect of the conditions on men is quite different. While majority rule prompts minority women to speak up in favor of principles they did not prefer, it prompts minority men to speak up against principles they did not prefer. Specifically, men are most likely to oppose their disfavored alternatives under majority rule with many women. In that sense, minority status disempowers women but empowers men. Turning to the majority-rule groups with many women, both genders more freely express opposition to principles that do not rank as their most preferred. Again we see that conditions that most empower women do not detract from men’s voice, to the benefit of a deliberative airing of opinions.
To sum up, women’s public expression of generosity toward the poor is substantially affected by the conditions of deliberation at the heart of our experiment. In conditions that prompt women to speak more and to discuss women’s distinctive issues more often, and where women come to be seen as more influential members of the group and receive more positive interjections, they also advocate more generosity to the down and out. They are more likely to express support for higher minimum guaranteed incomes, are less likely to speak on behalf of principles that are not their first preference, and are more likely to oppose those disfavored principles. In other words, in the conditions when women are more empowered, women influence the conversation, turning it more frequently to women’s distinctive issues, endorsing more generous approaches to redistribution, and aligning their public expressions of generosity with their private preferences.
Table 9.3: Endorsement of or Opposition to Principles Other Than Most Preferred
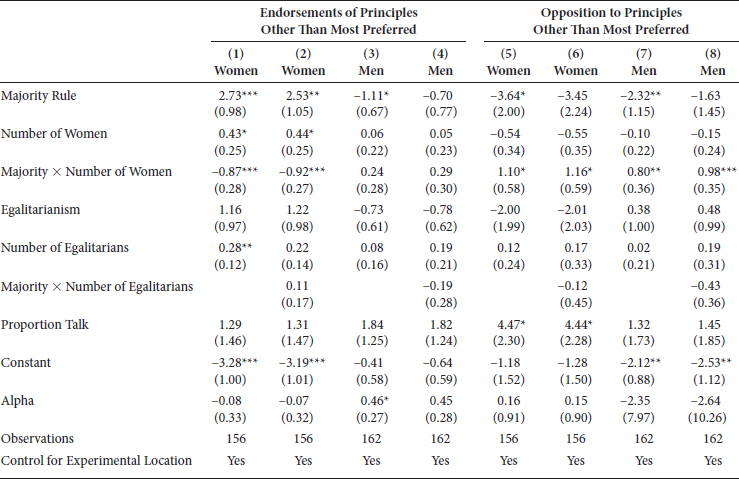
Note: Entries are negative binomial regression coefficients. Individual–level analysis. Cluster robust standard errors in parentheses. *** p < 0.01, ** p < 0.05, * p < 0.1, two-tailed test.

Figure 9.4. Endorsement of redistribution principles other than their most preferred, women only. Note: Predicted values from Model 1 of table 9.3.
Men are less profoundly affected by the interaction of decision rule and gender composition, but they are not wholly insensitive to it. Under unanimous rule, men support lower minimum guaranteed incomes as the number of women in the group increases; men are more generous when surrounded by few rather than by many women. Under majority rule, increasing the number of women leads to more expressions of generosity among both men and women. However, the most talkative men in these majority female groups resist the extremely generous safety net that the most talkative women in those same groups advocate. In addition, even when controlling for talkativeness, men in these groups are more likely to articulate their own views—they express opposition to principles they dislike and embrace the principle of no redistribution. Stepping back to consider both genders and across the experimental conditions, we find that empowering conditions increase women’s advocacy for the poor, with some mixed effects on men, including evidence that some men resist the call for increased generosity when women are empowered.
WHEN DO WOMEN INFLUENCE GROUP DECISIONS?
Although what women say is an important indicator of their attempt to influence, what the group chooses to do after hearing women’s voices is the ultimate measure of women’s actual influence. Full representation entails not only speaking for a view but also seeing that view through to implementation. We thus turn to the final outcome: the group’s decision. Our question is whether the measures of women’s empowerment, documented in earlier chapters, in turn have an effect on what the group decides. Do women’s elevated talk time, their more frequent talk of care issues, their experience of more positive engagement while speaking, and their expressions of preferred generosity translate into different group decisions? Specifically, did the conditions that empower women in these ways affect the group’s generosity toward the poor?41
Figure 9.5 presents the predicted minimum guaranteed income for each experimental condition (with dummy variables for each condition and a control for site).42 The figure shows, first, that among mixed-gender groups, increasing women’s descriptive representation under majority rule moves group decisions in the direction of more generous redistribution of income to the poor. All-female groups tend to be much more generous than all-male groups, with the average difference exceeding $7,000. A simple regression model of all majority-rule groups confirms that the guaranteed minimum income is significantly higher—more than $4,000 higher—in majority female than minority female groups (p < 0.05, one-tailed test, chapter appendix table A9.5).43 This substantial effect of numbers persists when controls for the number of egalitarians in the group are included. In groups deciding by unanimous rule, however, there is no statistically significant difference in generosity between majority- and minority-female groups, though female enclaves were much more generous than any mixed-gender condition (chapter appendix table A9.5). When we restrict the analysis to mixed-gender groups only, we find modest evidence of our predicted interaction between gender composition and decision rule. The interaction of rule and the number of women is marginally significant at p < 0.10 (one-tailed test; chapter appendix table A9.6, Model 1) and remains positive and marginally significant (p < 0.07) with controls for the number of egalitarians and the interaction of decision rule and the number of egalitarians (chapter appendix table A9.6, Model 2).44

Figure 9.5. Group’s chosen minimum guaranteed income for safety net, by experimental conditions. Note: Estimated values include controls for experimental location.
While figure 9.5 has the virtue of displaying the actual amounts in each specific combination of numbers and rule, figure 9.6 paints a clearer picture of the conditions’ effects by fitting a regression line through each trend. That figure also shows the effect of the conditions after controlling on the number of egalitarians and the interaction of egalitarians and rule (predicted from the linear, interactive model in chapter appendix table A9.6, Model 2).45 The figure shows that while the effect is modest, there is in fact a clear interaction between rule and composition among mixed-gender groups. Groups choose a more generous safety net under majority rule as the number of women rises. Under unanimity, the effect of numbers reverses. Thus, as anticipated by our interaction hypothesis, women interacting with men do best as a numerical majority only under majority rule, and unanimous rule is the better rule for minority women but not for majority women.
By what mechanism do the conditions affect the generosity of the group’s chosen safety net? We saw earlier that the conditions affect the generosity women express, and now we ask whether that generosity affects the group’s decision, holding constant men’s expressed generosity.46 Chapter appendix table A9.7 (panel A) shows that indeed, the more generous are women’s stated preferences for the safety net, the higher is the group’s safety net, even after we account for the effect of experimental location, of egalitarians, of predeliberation preferences for principles, of predeliberation attitudes toward the poor, and of the direct effect of the conditions.47 Specifically, in mixed-gender groups, as the average woman’s endorsed poverty line increases by $1,000, the group’s chosen safety net rises by approximately $400–500 (with a similar effect from the average man’s endorsement). Thus when we consider simultaneously the effects of the average woman’s and the average man’s stated preferences for the safety net, we find that in general, women have a substantial effect regardless of what men say.48 This is a significant indicator of the power of women’s voice, and a main avenue for women’s instrumental influence over the group decision.

Figure 9.6. The interaction of decision rule and group gender composition on group’s safety net, mixed-gender groups only.
Most of our analyses to this point have focused on the effect of the average woman or man in the group, for reasons outlined in earlier chapters. But when it comes to group decisions, we also want to know about the total effect of men and women. A group decision may rest not only on the average but also on the collective, or the aggregate. One way to account for this aggregated women’s voice is to weight the average woman’s expressed preference by a measure of women’s total proportion of the conversation. By doing so, we can see how much influence women (or men) have as a whole on the ultimate group decision. Relying on this measure makes sense in particular given that as chapter 5 demonstrated, the conditions have a large effect on women’s talk. We thus computed a measure of the total “volume” of women’s (or men’s) expressed preferences by multiplying the average woman’s maximum endorsed safety net (or the average man’s) by the total proportion of the conversation taken by all women (or men) in the group.
Regression analysis shows that this measure is strongly associated with the group’s safety net, including in the presence of controls (see panel B of chapter appendix table A9.7).49 The greater the total volume of generous endorsements, the greater is the group’s chosen floor amount, even after controlling for the effects of the experimental conditions.50 In fact, in the presence of the most stringent controls (Model 5), women’s volume of generosity matters while men’s has no effect. When women take up more of the discussion in order to express a generous preference, they shift the group’s eventual decision toward generosity. Thus, by some estimates women have more influence than men—but only if they take up a good deal of floor time and speak for generosity. This finding refutes any doubt about the meaning of our earlier finding about women’s tendency to speak less than men: women’s relative quiescence matters.
The most direct test of women’s influence, however, is what happens when men’s and women’s endorsed preferences diverge. Specifically, the question is what effect women have when they advocate for a more generous safety net than men do. To find out, we defined generous support as a poverty line above the median endorsement for all participants in the study and created variables indicating whether or not men and women in each group were, on average, above or below that median, and whether they expressed any preference for a floor. We then created dummy variables indicating every possible combination of men’s and women’s average preferences—women endorse generous floor amounts but men endorse low floor amounts, women endorse low floor amounts but men endorse high floor amounts, both men and women endorse high floor amounts, men endorse low floor amounts and women say nothing, and so forth. The excluded category in the model thus captures groups where both men and women endorse low floor amounts.
Do women have their way when they publically disagree with men’s low generosity? The answer is no. Table 9.4 shows that the coefficient on this dummy, while positive, is far from significant.51 The other notable finding in table 9.4 is the effect when men speak for low generosity and women articulate no preference; that coefficient is no different from 0, indicating that when men advocate low generosity, women’s silence is equivalent to their agreement. Thus silence is a risky strategy for women who prefer more generous support for the poor; it is unlikely they will find themselves in groups where men, on average, take up the banner of a more generous safety net. If women prefer to increase support for the poor, then they will often need to speak up.
Table 9.4: Women’s Preference Expression and Group Generosity toward the Poor, Mixed-Gender Groups Only

Note: Group-level analysis. Dependent variable is the group’s chosen minimum guaranteed income, in dollars. Standard errors in parentheses. *** p < 0.01, ** p < 0.05, * p < 0.1, two-tailed test.
These results provide insight into the effects of disagreement ignoring women’s status, but more relevant is whether that status moderates those effects. Because female-empowering conditions move men’s expressions toward women’s, and male-empowering conditions move women’s toward men’s, we do not have sufficient groups where women and men disagree to allow us to separate out the effect of disagreement within each of the experimental conditions. However, we can approximate such an analysis by again incorporating total speaking time. Our core argument is that women carry more influence when they have more authority. One indicator of that authority, as we showed in chapter 5, is speaking time. Therefore, we can examine whether women’s high or low speaking time changes the effect of women’s disagreement on the group’s safety net. To do so, we restrict the analysis to groups in which men and women disagreed. For this analysis we cannot use the dummy defined previously because we run out of groups. Therefore, we define disagreement as groups where women’s average endorsed safety net was at least $2,000 higher than men’s. We also categorize the groups as high or low in women’s speech by dividing them at the median of women’s total share of the group’s talk time in mixed-gender groups (the median of women’s share of the group talk is 40%). We find that this disagreement between men and women translates into more generous group decisions only when women take up 40% or more of the total group conversation.52 In other words, women can leverage their preference for a more generous safety net into a more generous group decision, but only when they are active deliberators, accounting for a large portion of the total conversation. When women and men disagree, quiescent women carry no influence.
By implication, we can now see the full negative impact of women’s quiescence, documented in chapter 5. There we found that a token woman under majority rule takes less than 20% of the group talk. That rate clearly falls in our “low” speech category, since it is less than half of the median speaking rate for women. Recall too that in these same groups, men are almost invariably likely to endorse low generosity. Putting these findings together, we arrive at a stark picture of women’s powerlessness: in majority-rule groups where women typically account for much less than 20% of the conversation, any expression of generosity women might articulate will have no influence.
Together, the multiple results we have reviewed here lead us to suspect that the effect of the conditions on the group’s eventual outcome is mediated by the preferences expressed during deliberation. The interaction of women’s numbers and the rule affects the generosity of expressed preferences, the extent of the gender disagreement in that generosity, and the group’s eventual generosity. Furthermore, we found that when we include expressed floor preferences in the model, the effect of the conditions on the floor decision is dramatically muted, and the effect of endorsed preferences is strong and significant, whether we include the average preferences or the total volume of preferences (see chapter appendix tables A9.4 and A9.8). A formal mediation model confirms a significant indirect effect of the experimental conditions on the group’s floor, working through the preferences expressed during discussion.53 In sum, women’s status in the group, as set by the experimental conditions, substantially affects what participants advocate for, including the extent to which men’s and women’s distinct perspectives are fully articulated, and those statements in turn drive the group’s eventual decision.
DOES TALK OF CARE ISSUES CHANGE THE GROUP’S DECISION?
If women’s endorsements of more generous poverty thresholds can affect the group’s outcome in conditions where women are empowered, do other aspects of the conversation influence the decision as well? In previous chapters, we explored the effect of the conditions on talk of care issues. Now we ask whether talk of care issues also affects the group decision about generosity toward the poor.
There is reason to think so. For one, children are far more likely to live in poverty than adults.54 Thus to the extent that poverty policy is more generous to the poor, children will especially benefit. So people concerned with the needs of children, as women tend to be, may well be more interested in a generous minimum income for the poor, which allows a higher standard of living, and the more that the discussion focuses on the needs of children and their care, the higher the poverty line will move. In addition, all the referents on which care issues focus—children, families, the vulnerable, and the poor—tend to be viewed favorably or sympathetically (Gilens 1999); so the more they are discussed as beneficiaries of assistance, the more generous the assistance is likely to be.55
To explore these issues, we follow an approach similar to our earlier analysis of preference endorsements, this time looking to the measure we employed in chapter 7 as our key indicator of women’s voice on issues of distinctive concern to them: the ratio of care to financial issues. As we explained there, care issues are references to children, family, the needy, or the poor, and financial issues refer to words like salary or taxes. For each mixed-gender group, we computed a ratio for the average woman and the average man in the group.56 We then created a dummy variable indicating whether or not each ratio was above or below the overall median ratio for all groups in the sample. Then we created an indicator for all four of the possible combinations of the ratios—women with a high ratio of care to financial issues and men with a low ratio of care to financial issues, women with a low ratio and men with a high ratio, both men and women with a high ratio, and both men and women with a low ratio.
Our chief interest is whether women’s focus on care issues affects the group’s decision about floor amounts when men voice a different priority. And as in our earlier discussion of preference expressions, we also want to know whether this effect is moderated by the amount of time women hold the floor. For this reason, we add an interaction between the dummy variables and women’s total Proportion Talk during the discussion. The excluded category in the model is groups where both genders had a low ratio of care to financial issues. The results can be found in table A9.9, and control on the effects of egalitarian composition and its interaction with rule, and on whatever other effects are produced by the conditions. Chapter appendix table A9.9 shows that even when men fail to focus on care issues, women can move the group toward greater generosity by speaking more about the poor, children, and families and less about taxes and other financial issues. But this effect is conditional: it only occurs when women’s voices account for more of the conversation. Predicted values from Model 2 of the table clarify the effect of women’s total Proportion Talk in groups where women’s ratio is high but men’s is low. Where women take up only 20% of the conversation, the group’s chosen floor amount is about $18,170, but when they hold the floor for 80% of the group’s discussion, the predicted floor rises to $28,270, an increase of nearly 56%.57 The total volume of women’s speech is critical to whether or not the content of speech has a liberalizing effect on group decisions.58 For their distinctive concerns to affect the group’s outcome in the direction of greater generosity, women must do the very thing they tend not to do when their standing is low: they must speak up.59
The evidence thus leads us to conclude that the content of discussion affects group outcomes in two ways: through the safety net amounts endorsed by group members and through the group’s focus on care issues instead of financial issues. But women’s overall willingness to speak up matters, too. When women do not hold the floor sufficiently, talk of generous safety nets, of the poor, of children, or of families has little effect.
We pause here for a caveat. Because women’s volume of care talk and volume of expressed generosity are each caused by the conditions, and are intercorrelated with each other (and with other features of discussion explored in previous chapters), identifying which measure contributes most to the outcome effect is challenging. The experimental conditions have multiple, simultaneous effects on a host of variables, all of which are connected to each other, so we are not arguing that one of our measures of discussion content necessarily carries a bigger causal effect than the other.
Nonetheless, our experimental design allows us to say that the interaction of decision rule and gender composition affects many aspects of the group’s dynamic and the content of discussion, and that ultimately—whether directly or through the mediators we presented—these conditions causally affect the group’s decision. When the conditions equalize women’s status, the gender gap in floor time and influence decreases, positive reinforcement to female speakers increases, the group talks more about issues of distinctive concern to women, and women articulate more generous preferences and preferences that are more distinct from those of men. Group-level factors affect group norms of how group members interact and what they say. Both the norms of interaction and the substance of the conversation thus move in directions that are favorable to women. And in the experimental conditions where these dynamics are more likely to occur, groups make decisions that involve more substantial support for the vulnerable populations that women tend to want to benefit.
CONCLUSION: HOW THE CONDITIONS OF DELIBERATION SHAPE ITS OUTCOMES
In this chapter, we have shown that discussion under conditions that elevate women’s status affects who sets the agenda, shapes the expression of women’s and men’s preferences, helps women to become more certain of their views about the proper ways to redistribute income, and, ultimately, affects the group’s eventual decision. Our deliberating groups tended to agree on the basic principle that should guide redistribution, and the large majority chose to guarantee a minimum standard of living—a system much like the safety net now in place in their country and around the world.60 Yet among these many groups, we find considerable disagreement about the magnitude of that minimum income. This is no surprise when we consider that in politics, the fundamental principles are set and rarely discussed, with broad agreement on the basic notion that government should help the poor in some way and that government should tax citizens at least to some extent. The real disagreement occurs on how much government should help.
And women’s status in the group affects their engagement in that disagreement, and the consequences of that engagement for the group choice. We find that the conditions that empower women profoundly influence deliberators’ public endorsements of generosity. When women are empowered—and especially in majority-rule groups with many women—they are more likely to endorse a higher amount of minimum guaranteed income. This preference is consistent with women’s more general inclination toward generous government intervention on behalf of the poor and the vulnerable. In addition, when women’s standing is higher, women’s preference falsification decreases and their willingness to argue against less preferred alternatives increases. In those female-empowering groups, women’s expressed preferences for a generous safety net, and their increased talk of women’s distinctive issues, ultimately translate into group decisions that set a higher guaranteed income for the poor, even though in those settings the most talkative men raise their voice for less generosity in turn.
Settings that empower women also increase women’s confidence in their own opinions. As we saw in previous chapters, confidence is a key barrier to women’s equal participation. Now we can see that conditions that raise women’s status in the group alleviate the problem of confidence in part by strengthening women’s internal compass about the proper course to follow. Consistent with the interaction hypothesis, unanimous groups with few women and majority groups with many women are much more certain than women who find themselves in the least empowered condition—majority rule with few women.61
Finally, the results have implications for our finding from chapter 5, that status equalizes women’s talk time with men in the group. There, we saw that women’s relative quiescence is associated with lower perceived influence. Now we can see that women’s quiescence also carries a concrete, instrumental penalty for women, and for the groups that women tend to want to assist. In groups where women are least likely to speak, they are also most likely to express no preference and least likely to focus on vulnerable populations such as children, and this in turn has independent effects on group decisions, rendering them far less generous.
Thus we see that the interaction of gender composition and decision rule affects multiple aspects of the group’s functioning. We cannot understand group deliberation or women’s empowerment by focusing only on one of those aspects at the exclusion of the others. If we only examined preferences and group outcomes, we would fail to understand how the preferences convert to the outcome. If we only examined the group decision, we would fail to understand how the setting empowers women. It is only by exploring the combination of the volume of speech, the content of comments, the mismatch between the person’s views and what they say, and the group’s ultimate decision that a more complete picture of the influence of group-level conditions emerges. And in order to understand how authority shapes discussion and group decisions, all of this must be done by comparing the behavior of groups who walk in with more authority to those who come with less authority.
The results have implications not only for women’s empowerment but also for deliberation. From the perspective of designing good deliberation, majority rule where women are few functions badly. This conclusion may not be immediately obvious, because of a potentially misleading finding. We found that in this condition, women speak up for principles of redistribution that they disfavored before discussion. At first glance, this might appear to indicate open-mindedness, and thus, a desirable deliberation. However, the problem with this interpretation is that this seeming open-mindedness occurs only among women, and then, only where their status is lowest. It does not occur among men where they are the minority (or anywhere else). If a discussion prompts support for disfavored views only among disempowered social groups under conditions that also exhibit various markers of their disadvantage, then that type of open-mindedness is not a feature of good deliberation but of disempowerment. The implication is that expressions of open-mindedness cannot be taken as features of good deliberation universally, or even frequently. If they are not reciprocal between empowered and disempowered groups, then they are a red flag for inequality and for its corrupting influence over deliberation.
In addition, the conditions that most empower women—majority rule with many women—also produce a good deliberative exchange. There, not only are women most likely to articulate preferences, and to articulate generous preferences, men are also most likely to articulate their own, less generous preferences. The result is a fuller, more robust engagement of deliberators with each other. Discussion includes more elements of debate, with the felicitous side effects—diverse alternatives receive a hearing and the group can then make more informed choices.
As previous chapters demonstrated, when deliberation is not structured with the explicit goal of addressing social inequality, it produces significant social inequality. Although the goal of deliberation is to create equality within discussion, the way that deliberation is conducted has a good deal to do with its ability to achieve that goal. As the theorist Dennis Thompson writes, “For many deliberative theorists, one of the main points of deliberative democracy is to expose inequalities to public criticism and create less unjust conditions in the future” (Thompson 2008, 509). Deliberative democracy in practice, however, not only fails to expose inequalities and injustices but also worsens them, on multiple dimensions. When women are not set up to have equal influence in discussion, not only do they emerge with less authority but also other groups, such as the poor and vulnerable, are worse off as a result. Gender inequality within discussion produces a cascade of inequalities for many vulnerable groups in society.
We have now seen that conditions that empower women produce a whole set of consistent effects. Women speak more, discuss issues of distinctive concern to women more often, receive more positive affirmations while speaking, are viewed as more influential and view themselves as more efficacious, express their more generous preferences more often, and ultimately shift the group decision. But all this happens in an artificial setting. We now turn to a very different setting to see what we can learn there.
1 The first quote is from Adam Grant, “Why Men Need Women: It’s Not What You Think,” New York Times Sunday Review, July 21, 2013, 6. The last sentence comes from Bill Gates’s interview with 60 Minutes, May 12, 2013, http://www.cbsnews.com/video/watch/?id=50146683n.
2 Several studies find an effect from a rising number of female relatives on men’s policy preferences. Of particular note is Ebonya Washington’s finding of a daughter’s effect on male congress members’ liberal votes, especially but not exclusively for reproductive rights (2008). The number of women in the household matters, and not just becoming the father of a daughter; among fathers of two children (either sons or daughters), there is a bigger effect of having two daughters over one daughter than in having one daughter over no daughters. Similarly, among fathers of three children (sons or daughters), we see a bigger effect from having three over two daughters than from having two daughters over one daughter. The results are specific to daughters—they are not caused by having sons. The effects do not apply to female congress members, but those null results may be due to these women holding more liberal attitudes already. They do apply to male members of either party. Other studies confirm the pattern. Parents who have only daughters are more likely to support profemale policies than those with daughters and sons, and fathers of mixed-gender offspring are more so than fathers who only parent sons (Warner and Steel 1999). For example, in an experiment using an allocation game, men who gave more generously to anonymous partners were 40% more likely to have had sisters (but not brothers) than men who did not allocate generously (Van Lange et al. 1997).
3 We sometimes call this minimum guaranteed income the group’s “safety net” or “poverty line” or “floor amount.” For stylistic purposes, we use all four terms interchangeably.
4 The most recent survey data confirm these conclusions. For example, a 2012 Pew Research Center survey found large differences between men and women in support for more social services. This result is consistent with a gender gap in views of the role of government in Pew Center surveys over the last decade: women are much more likely than men to favor increased government intervention focused on more services for those who might be struggling. Specifically, the most recent Pew Center survey finds that women favor more government help for the elderly, children, and poor people at much higher rates than men, with the gender gaps ranging between 9 and 11 percentage points. And in terms of government priorities, close to 60% of women cited helping the poor and needy as a top priority for government, compared to less than half of men. For an overview of all findings, see http://www.people-press.org/2012/03/29/the-gender-gap-three-decades-old-as-wide-as-ever/.
5 For details, see chapter 4 and the online appendix.
6 In the original experiment designed by Frohlich and Oppenheimer (1992), this uncertainty about the work task at the time of deliberation was meant to simulate the Rawlsian “veil of ignorance,” that is, participants could not be sure whether they were likely to earn a lot or a little, to encourage them to consider the most just principle. The principle of maximizing the floor was meant to parallel Rawls’s notion of justice as providing the greatest benefit to the least well off. These connections to Rawls are not important for our purposes.
7 The top half of table A9.1 shows the individual-level distribution of preferences before discussion.
8 The size of the predeliberation gender gap in preferences for no redistribution and for setting a floor is similar to the gap in other studies of redistribution preferences: 10–15 percentage points for each of the two principles (each difference is significant at p < 0.02 in a regression model that includes controls for experimental location).
9 The principle of setting a floor had the highest average predeliberation ranking in 84% of groups. (Predeliberation preferences include ties in which two principles were equally highly ranked by group members. Ties occurred in four groups.) Given the small number of groups choosing a principle other than the one they preferred prior to deliberation, it is difficult to draw any firm conclusions about the conditions under which such change occurs. We find some evidence, however, that such change is more likely to occur in majority male groups than in majority female groups, but again, such conclusions are only tentative.
10 Of the participants who were the first to speak up, only 22% did not advocate the same principle they preferred privately. While small, this slippage could have a variety of causes, including uncertainty or ambivalence about the initial preference, strategic action, or social pressure. Women are slightly more likely than men to express the same preference both privately and publicly (83% of women and 73% of men, though this difference falls short of statistical significance, p = 0.23, two-tailed difference of proportions test). The conditions did not affect the slippage among men or women. A probit regression of a dummy variable indicating whether the participant’s private preference matched his or her public expression on our linear, interactive model yields no effect for decision rule (p = 0.67), for gender composition (p = 0.68), or for the interaction between the two (p = 0.60).
11 In some groups, participants were somewhat reluctant to begin talking, and if this was the case, the moderator was instructed to ask participant A to begin the conversation. (Because the participants were randomly assigned to a letter for the purposes of seating around the table, the choice to begin with participant A was essentially random.) If participant A articulated his or her preference in response to the researcher’s question, this could muddy our measure of agenda setting. However, even if we remove all groups in which participant A spoke first and was the first to articulate his or her preferences, the same strong interaction between decision rule and gender composition is present (for the interaction term of this model, p < 0.03, one-tailed test).
12 Results do not change if we substitute controls for liberalism and the interaction of liberalism and rule for egalitarianism and the interaction of egalitarianism and rule (not shown).
13 Later we will take up our more central, and general, prediction—that whether they are agenda setters or not, women are more likely to move the group decision in the conditions where women are empowered.
14 Comparing the effect of rule in groups where women are a majority, z = 1.25, p = 0.10, one-tailed difference of proportions test. Our argument does not require that women be agenda setters to be empowered, and our point here is narrow: women are more likely to be agenda setters when they are empowered, and those agenda setters are more successful when women’s standing increases.
15 Both men and women were more certain of their preferences after discussion, with both genders’ levels of certainty increasing by more than half a point on the 5-point scale. Women increase from an average of 3.37 before deliberation to 3.90 afterward (p < 0.01), and men moving from 3.53 to 4.09 (p < 0.01). Both prior to and after deliberation, men expressed somewhat more certainty about their preferences than women. The gender differences are significant at p = 0.10 prior to deliberation and p = 0.01 afterward (two-sample unpaired difference of means tests).
16 A regression of predeliberation certainty on our linear interactive model shows that none of the coefficients in our interactive model are significant at conventional levels, and the direction of the point estimates is often different from what we find in the postdeliberation models.
17 These patterns are identical in models that use the participant’s change in certainty as the dependent variable. In addition, as seen in Models 2 and 4 of table 9.1, the results for a fully saturated model that includes interactions between majority rule and the number of egalitarians in the group are also nearly identical. Controls for age, education, and income make no difference in the model (not shown). Substituting liberalism for egalitarianism, the general trends are similar, though the change in certainty under majority rule is smaller when liberalism is the control (see online appendix table C9.6).
18 Predicted values from the model show that the difference in certainty across decision rules is significant at p < 0.02 (two-tailed) for groups with one woman or groups with two women. These differences in predicted values hold in models that control for liberalism instead of egalitarianism.
19 In female enclaves, levels of postdeliberation certainty are slightly higher than women’s certainty in mixed-gender groups with many women, but pooling both decision rules, those small differences are not significant. As table 9.1 indicates, male certainty is not affected by the experimental conditions.
20 Indeed, perhaps the principle’s attractiveness to so many groups can partly be attributed to its ability to allow this considerable flexibility.
21 Intercoder reliability analysis shows that in the set of statements that both coders agreed were preference statements, agreement about the nature of the statements (that is, which principle it supported, and the amount) was nearly perfect: Support for Maximum Redistribution, 100% agreement, Krippendorff Alpha = 1.00; Support for No Taxes, 100% agreement, Krippendorff’s Alpha = 1.00; Support for a Range Constraint, 98.6% agreement, Krippendorff’s Alpha = 0.92; Support for a Floor Constraint, 94% agreement, Krippendorff’s Alpha = 0.87; Amount of Floor Constraint, 94% agreement, Krippendorff’s Alpha = 0.85. Given the difficulty of determining whether a statement is an expression of a preference from the group transcripts, coders did not always agree with each other about whether a statement was a preference expression, but of all coding judgments made, coders achieved agreement about preference expression and the content of the expression about 93% of the time.
22 Some participants did not endorse floor amounts because the group chose a different principle and did not need to discuss guaranteed incomes. Other participants endorsed principles, but not specific poverty thresholds. In the sample as a whole, only 9% of the sample never endorsed either a principle or floor amount at any time during the group discussion.
23 Counting the number of times a participant advocated a principle of any kind, we find for all groups an average of 2.6 times for unanimous rule and 2.3 times under majority rule, t = 1.73, p < 0.05, one-tailed; for mixed-gender groups: Unanimity: 2.7, Majority 2.1, t = 2.70, p < 0.01, one-tailed. These results are similar for the total number of statements a participant made either for or against any principle. For all groups: Unanimity: 3.18, Majority, 2.68, t = 2.45, p < 0.01, one-tailed. For mixed-gender groups: Unanimity: 3.18, Majority, 2.46, t = 2.93, p < 0.01, one-tailed. These relationships remain strongly significant in an OLS regression model that includes controls for Proportion Talk (to control for overall talkativeness) and experimental location. These same patterns hold when we examine men and women separately. These results apply only to decision rule; we find no evidence of an interaction between decision rule and gender composition.
24 With all groups, the percentages are: Unanimity: 54.2%, Majority: 46.5%, z = 1.66, p < 0.05, one-tailed. These numbers are very similar when we examine mixed-gender groups only: Unanimity: 50.9%, Majority 41.9%, z = 1.60, p < 0.06, one-tailed. When we control for overall talkativeness by adding Proportion Talk to the regression model; however, these patterns are still in the same direction, but fall short of significance (p = 0.15, one-tailed test). Both male and female enclaves seem to function similarly to unanimous rule in generating widespread preference expression in the group, so that participants in enclaves are more likely to express preferences than those in mixed-gender groups (z = 2.45, p < 0.01, one-tailed) across both decision rules.
25 Across the sample as a whole, women are no more or less likely than men to make a statement of any kind (online appendix table C9.2, Models 1 and 2), and among participants who made any statements about their preferences, women made the same number of statements as men (online appendix table C9.2, Models 3 and 4).
26 When we pool all conditions, women tend to endorse much more generous floor amounts than men. Whether we examine the individual’s first stated preference, their maximum stated preference, their minimum stated preference, or their last stated preference, women on average favor more generous redistribution of income to the poor than men. These gender differences are strongly significant and amount to guaranteed minimum incomes that are between $3,000 and $3,400 per year higher than those endorsed by men, or a 13% increase from the average amount endorsed by men (online appendix table C9.3). Controls for experimental location are needed because participants in the East Coast location tended to choose higher floor amounts than those in the Mountain West location.
27 Results are essentially the same if we use other measures, such as the first endorsed preference or the minimum endorsed preference. We chose maximum floor amount endorsed because this gives us a sense of exactly how generous toward the poor men and women were willing to be. Results do not change if we substitute controls for liberalism and number of liberals in the place of egalitarianism and number of egalitarians (see online appendix table C9.7), nor do they change when we add controls for age, education, or income (not shown).
28 The key interaction term remains similar in magnitude and in significance in a fully saturated model that also interacts decision rule with the number of egalitarians in the group (see Models 2 and 4 of table 9.2). In addition, controlling for the number of college grads or the number of group members above the median in age or education makes no difference to the findings, either on their own or in interaction with decision rule (not shown).
29 In enclaves, women’s expressed preferences also diverge markedly from men’s, averaging between $5,700 and $6,900 more (p < 0.05, two-tailed; see online appendix table C9.3).
30 The federal poverty line is technically known as the “poverty guidelines,” and it is set yearly by the federal government to determine eligibility for various federal programs that assist the poor. In 2007, the year of the study, the level for a family of three was $17,170, and the poverty guideline for a family of four was $20,650. See http://aspe.hhs.gov/poverty/07poverty.shtml regarding the facts in this note. We did not inform the participants of the actual poverty guidelines because we wanted to observe their own decisions without bias toward the status quo.
31 Online appendix table C9.5 shows the effect of the conditions when we pool male and female members of the group. The effects hold not just for the individual’s most generous expressed preference, but also the first floor amount endorsed by the individual, the minimum floor amount endorsed, or the last floor amount endorsed. The differences across the conditions are substantial. In majority-rule groups with one woman, the predicted maximum floor amount endorsed by individuals is approximately $21,797 (from Model 3 of table A9.5). But in majority-rule groups with four women, the predicted maximum floor amount endorsed by the deliberators is $29,815—a difference of about $8,000. That is a nearly 40% increase. In unanimous-rule groups, the number of women has the opposite effect. Using group-level data instead of individual-level data (pooling men and women in each group), with the group’s average maximum floor as the dependent variable, the interaction between decision rule and group gender composition is significant at p < 0.05 (one-tailed).
32 The results are found in chapter appendix table A9.3. Results persist when we use controls for the number of liberals and the interaction between rule and the number of liberals or between rule and demographic characteristics such as age, education, or income (not shown). When we explore the group-level patterns for men (not shown), the interaction between decision rule and gender composition remains marginally significant, except when controls for the number of deliberators favoring no redistribution is included.
33 These findings are especially noteworthy because of our experimental approach, with random assignment to group conditions. Recall that our randomization checks showed that the groups were essentially equivalent in terms of multiple different demographic characteristics. We can be confident that the differences in expressed preferences across the conditions are not the result of selection bias, with some groups having very different types of deliberators than others.
34 Under unanimous rule, interactions between talk time and the experimental conditions are not statistically significant.
35 Figure 9.3 shows the predicted values that emerge from Models 2 and 4 in table A9.4.
36 The difference in the predicted values for the low and the high ends of the scale is significant at p < 0.01, two-tailed.
37 There is some uncertainty around the point estimates, however. For men, the difference between the predicted values at each end of the scale is significant at p < 0.12, one-tailed test.
38 Results are identical if we include controls for liberalism and the number of liberals or if we control for the participant’s age, education, and income (not shown).
39 Male resistance to women’s preferences in ways that are not moderated by speaking time can also be seen under unanimous rule with respect to a different aspect of the discussion: advocacy of no taxes or redistribution. In the sample as a whole, men are more likely than women to favor this principle: nearly 17% of men expressed support for no redistribution at least once during the conversation, compared to less than 7% of women. But again, the experimental conditions matter. Under unanimous rule, women express the least support for this principle in groups with few women—the groups where their standing is greatest with that decision rule. But for men, the effect works in the opposite direction: they are most likely to endorse no redistribution in unanimous groups with few women. Evidence for these patterns can be found in table C9.1 in the online appendix. Men press their desire for the least generous principle in the unanimous-rule groups where women’s standing is greatest.
40 As the table shows, patterns remain the same—and if anything become slightly stronger—in fully saturated models. Results are identical with controls for liberalism (see online appendix table C9.8), and adding controls for age, education, and income or for group-level measures of the number of group members who are college graduates or the number of group members above the median in income or education makes no difference to our key gender interaction (not shown).
41 One challenge of this analysis is how to translate the differing principles into a single, comparable metric of generosity. For groups that selected the principle of setting a floor, this is simply the dollar amount the group chose as an acceptable minimum standard of living. Similarly, the single group that chose no taxes or redistribution was assigned a dollar amount of $0, consistent with that principle. We assigned groups that chose to “maximize the floor” (N = 5) a minimum income of $35,000, which is the 90th percentile of the amounts chosen by the “set a floor” groups. Finally, the six groups that chose to “set a range” were assigned imputed floor amounts in proportion to the gap they preferred between rich and poor. For example, groups that chose a very low gap ($0) were assigned high floor amounts ($35,000), again using the 90th percentile rule. The patterns we report below are similar whether we use only those groups that actually set a floor or whether we add the groups that chose other principles.
42 According to the US Census Bureau’s Cost of Living Index for 2010, our East Coast site had the highest state-level cost of living in the nation, while our Mountain West site was slightly below the national average. Consistent with these differences, East Coast participants tended to set minimum guaranteed incomes that were approximately $6,500 higher than those chosen by participants in the Mountain West. For this reason, our controls for experimental site are especially important for this analysis. When we analyze the effect of the conditions on the two sites separately, however, the patterns are very similar (see chapter appendix, figure A9.1).
43 This result holds if we substitute the number of liberals in the group for the number of egalitarians. See online appendix table C9.9. In addition, the effect of gender composition is strong and significant if we add group-level controls for the number of college graduates or the number of group members above the median in income or age (not shown).
44 Substituting a control for the number of liberals and the interaction between rule and number of liberals dampens the results slightly. The basic pattern of results is very similar (as can be seen in online appendix figure C9.1), but the interaction term is not significant (p = 0.12, one-tailed). However, tests of the predicted values show that just as in models with controls for egalitarianism, the difference across decision rules is marginally significant when the number of women is low. In addition, the interaction is significant with controls for the number of liberals if we use a dummy variable for majority women in the group instead of the linear indicator of the number of women (see online appendix table C9.9). In general, we can say that the results for the group’s decision are slightly less statistically robust when we control for liberalism instead of egalitarianism, but the general pattern is unchanged. Results are also similar if we add controls for the number of college graduates and the number of participants above the median age or income (not shown).
45 Predictions hold constant the number of egalitarians in the group at the sample median (three).
46 The clearest explanation for the group’s eventual decision is what preferences are actually expressed during the group deliberation period; for all groups, the correlation between the group’s decision and the maximum endorsed poverty threshold by men and women is 0.83 for women and 0.85 for men.
47 This analysis is limited to groups where both women and men endorsed a safety net preference. Because of those data limitations, we cannot reliably disaggregate by experimental condition. We have already shown, however, that the conditions profoundly affect the level of safety net endorsements. Thus even if the relationship between endorsements and group decisions is positive across all conditions, the overall effect is likely to vary with condition. Results are essentially identical if we substitute controls for the number of liberals in the group (not shown).
48 We cannot draw a causal inference here, of course, since expressed generosity is endogenous and we have not controlled on all the possible correlated predictors.
49 Results are robust to using controls for the number of liberals instead of the number of egalitarians and to controls for the number of group members above the median in age or education and the number of college graduates (not shown).
50 Groups where women or men did not endorse a safety net preference were assigned a volume of 0. We also computed a second measure of the total “volume” of women’s preference expressions by multiplying each woman’s (or man’s) maximum endorsed safety net amount by the total number of preference expressions made by that woman (or man), then summing for all women (or men) in the group. We find that this measure has no significant relationship to the group’s chosen floor amount, though the coefficients are in the expected direction.
51 The other effects are not much relevant to the main questions. Also, when men do not take a position but women do, the group is likely to set a more generous safety net, indicating that men lose influence when they are silent and women are expressive, just as women do when they are silent and men are expressive. In addition, controls for the number of liberals instead of the number of egalitarians make no difference to the findings reported above, nor do controls for other group-level demographic characteristics, such as the number of group members above the median in age or income or the number of college graduates (not shown).
52 In groups with preference disagreement where women take less than 40% of the conversation, the average floor amount is $21,833. In groups where women collectively account for more than 40% of the conversation, the average floor amount is $28,375, a difference that is significant at p = 0.057, one-tailed. These results hold in regression models that control for the experimental location and the number of egalitarians in the group. The opposite trend occurs when men prefer more generous floors and women do not, though the difference in the generosity of the group decision is not statistically significant (p = 0.167, one-tailed).
53 Whether the mediator is the average expressed preferences for the group as a whole, for women only, mediation models (Imai, Keele, and Tingley 2010) show a large and significant average causal mediation effect (p < 0.05), with the interaction of decision rule and gender composition affecting average preferences, which in turn affect generosity. For the “total volume” of preferences measure, the pattern is slightly different, but we still find evidence of mediation. For that measure, the direct effect of gender composition is more important than the interaction of composition and rule, but we still find evidence of mediation, with gender composition affecting volume, which in turn affects generosity (average causal mediation effect is significant at p < 0.05). For the measure of preference divergence, the formal test of mediation is not significant, however.
54 http://www.census.gov/hhes/www/poverty/data/incpovhlth/2009/pov09fig05.pdf and http://www.census.gov/prod/2011pubs/p60-241.pdf.
55 See chapter 7 for documentation and explanation of our claims about care and financial issues.
56 Groups in which the ratios are undefined are excluded from this analysis, but as we indicated in chapter 7, imputing values for those groups does not change the basic pattern of results.
57 A Wald test shows that this difference is significant at p = 0.05 (one-tailed). Predicted values from Model 1 yield very similar results. In addition, the model shows that these effects obtain no matter what the behavior of men. And when both men’s and women’s ratio of care to financial issues is low and women take 80% of the conversation, the predicted floor is $20,280 (predicted from Model 2 in table A9.9.) Additional analysis (not shown) demonstrates that the patterns are unchanged when controls for men’s and women’s preference expression (the same variables seen in table 9.4) are included in the models or when we substitute the number of liberals for the number of egalitarians or when we substitute group-level demographic controls for age, education, and income.
58 We also find similar results by using women’s average Proportion Talk instead of their total talk in the model. When we use the average measure, predicted values from the model show that when women have a high ratio of care to financial issues but men do not, an increase from Proportion Talk of 0.10 (severe underrepresentation) to 0.20 (equality) moves the group’s floor decision from $17,150 to $29,790 (this difference is significant at p = 0.02, one-tailed, predicted from model with controls for experimental conditions).
59 Coefficients from the model may at first glance indicate that, paradoxically, when women’s ratio is low and men’s is high, more talk by women leads to more generosity. However, predicted values from the model show that the rise in the generosity of group floor decisions as women’s Proportion Talk increases is small, and the difference between groups with low and high Proportion Talk is not statistically significant (p = 0.23, one-tailed).
60 There are gender gaps in preferences about principles, but they mostly boil down to the fact that a minority of men wish for no taxes and no redistribution, while very few women prefer this principle.
61 See figure 9.1. Certainty is highest under unanimous rule with few women, lowest under majority rule with few women. Among groups with many women, certainty is the same no matter the decision rule.