
Appendixes
CHAPTER 4 APPENDIXES
Appendix A: Methodological Issues in Existing Studies
We lack conclusive results about the effects of gender composition in part because of methodological problems. Here we discuss each problem in turn.
First, many studies that examine small group situations do not disentangle gender composition from individual gender. This can be seen in the large literature on jury decision making (Devine et al. 2001), which rarely examines gender differences apart from gender composition effects.1 While lawyers and consultants may believe that demographic characteristics strongly shape jury preferences, little systematic evidence exists to support this belief. A comprehensive assessment of the jury literature suggests, first, that “few if any juror characteristics are good predictors of juror verdict preferences,” and that those few tend to have “weak and inconsistent effects” (Devine et al. 2001, 673). The recent review by Cornwell and Hans seconds this conclusion.2 Only a handful of studies examine the effects of gender composition specifically on men and women (for example, Golding et al. 2007, on which we elaborate in chapter 7).3
Second, many studies examine only a few groups (Devine et al. 2001). This is a common problem in empirical studies of deliberation. Not only does the small number of groups hamper the study of gender composition, it also prevents the study of any feature of the group, including its discussion—presumably the very process of interest in our understanding of deliberation (Myers and Mendelberg 2013).4 Studies set in natural settings, such as legislatures, often include too few groups. For example, Kathlene’s pioneering study of gendered hearings uses twelve hearings (1994), and Mattei analyzed one committee (1998).
Third, even if a study includes many groups, it may not have much variation in its gender composition. For example, the emerging literature on judicial panel effects typically includes only a few groups that are not all male (for example, 84% of the panels in Farhang and Wawro’s 2010 study are all male).
Fourth, studies of officeholders examine only a few of the possible effects of gender composition, missing the chance to understand how the process of deliberation ties to outcomes. Some studies of officeholders focus on interruption patterns in hearings but not on other effects (Kathlene 1994; Mattei 1998). Many other studies examine the views of legislators (for example, Reingold 1992). Still others examine bill sponsorship, amendments, votes, and policy outcomes but not the process of communication that may shape these actions (Swers 2002). While no one study can do everything, what is needed is a holistic approach in which male and female individuals are situated within groups, and the characteristics of both the individuals and the groups are analyzed. We trace the process of interaction, showing how all this leads to various group decisions and affects individuals afterward. We need to understand the outcomes of group-level decisions and the dynamics that helped to shape those outcomes.
Fifth, existing studies are missing some types of analysis altogether. No study has rigorously examined the issue agenda as it takes shape during actual discussion. No study has examined systematically the effects of gender composition on speech participation or communication dynamics. We need to know more about the varied forms of women’s participation and representation, and how gender composition and decision rule affect each in turn.5
Sixth, even when studies have enough groups and enough variance in gender composition, they suffer an additional problem: the gender composition in the group may be correlated with other factors. The findings on the effects of enclaves, reported in chapter 3, illustrate the problem. Groups with many women are likely to be groups assembled to address women’s issues. That is, groups with more women may have set women’s topics to begin with, and this could be why they attracted more women. Our question is whether numbers lead to issues; we cannot answer this with groups whose issues lead to numbers.
There are a number of other ways that gender composition could be confounded by other causal variables. Some aspect of the locale may act as a confounding factor. For example, women’s level of engagement in politics may shape the presence of women in decision-making groups and women’s level of voice and influence in those groups. The activities of women’s organizations and women’s movements may increase the number of women present and the participation and representation by those women. Nonpolitical traits of the town or country may also confound the story of gender composition.6 Without random assignment of individuals to gender composition, we do not know if the effects we observe for gender composition are actually due to town size, for example.7 Similarly, groups with more women may be smaller. Smaller groups may be more inclusive of their members. Or perhaps people feel obligated to speak more when there are few other members.8
A case that has garnered considerable scholarly attention illustrates the value of using controlled experiments to make sure that factors that coexist with our treatment variable do not interfere with its effects. As we discussed in chapter 1, the Indian constitution empowers villages to make official, binding decisions governing themselves. Some view these remarkable meetings as “among the most widespread deliberative spaces in regular and routine use within a system of government in human History” (Ban and Rao 2008a, 20). It is no wonder that several studies have attempted to study whether these meetings succeed in producing more democratic decisions, including more egalitarian ones. And indeed, some studies find that in Indian villages constitutionally required to set aside one-third of village council seats for women, the decisions tend to be more aligned with the preferences of women and more oriented toward the common good of the village. In these villages, female leaders pursue policies more aligned with female preferences and more oriented to the common good (Chattopadhyay and Duflo 2004). But other studies find no such effect (see Ban and Rao 2008b for a summary). That is, quotas for women sometimes produce less democratic processes and outcomes. In some quota villages, women’s preferences are less likely to be mentioned in the discussion than in nonquota villages (Ban and Rao 2008b, 19).
Why do these studies reach conflicting conclusions? It is difficult to know for sure, but the contradiction in these findings may be due to the inability to fully account for other features of the deliberation and its institutional context. For example, the presence of higher-level officials at the meeting may be an important moderator variable that either allows or inhibits women’s distinctive voice (Ban and Rao 2009). When high officials are present at the meeting and intervene to ensure women’s participation in the discussion, women’s presence can shape the discussion. If other factors interact with women’s descriptive representation—with the percentage of women present—then a research design has to assess these factors accurately. That is exactly why a controlled experiment such as ours is needed. Using such a design can help resolve the mystery of contradictory findings from observational studies that cannot allow investigators the control they need.
Groups with more women may draw a particular type of man, and a particular type of woman, and these types may cause the effects we attribute to gender composition. Perhaps men who are more egalitarian are repelled by settings where men predominate, especially if those settings originate in a history of male chauvinism. Perhaps feminist women are more likely to reject these settings as well. That would create a spurious correlation between gender composition and gender egalitarian conversations. The effects we might attribute to gender composition may actually be produced by the fact that the individuals have more egalitarian views about gender. This association could work in the opposite direction instead. That is, perhaps women who feel more anxious than most women do when in mixed gender groups opt out of those mixed gender groups and into safer environments composed predominantly of women. Women who join groups with few women, conversely, may be more confident than most women. That might mute the effects of increasing numbers of women on levels of women’s self-assertion during discussion. That is, there are many ways in which gender composition may be correlated with factors that cause or detract from more gender egalitarian interactions and outcomes in groups.
Seventh, the findings for gender composition reported in chapter 3 rest on respondents’ reports of the gender composition of their organizations and of their own behavior. However, people are notoriously bad at canvassing their memory and providing accurate reports of their experiences or behaviors (Krosnick 1999).9 Not everyone answers these questions, and people who do reply may be different from those who do not.10
Two recent studies illustrate the challenge of self-reporting for even the highest quality observational work. For example, Gastil et al. 2010 found that “the frequency with which jurors speak up does not, in turn, reinforce their post-service sense of political efficacy” (Gastil et al. 2010, 144–45). This conclusion is not consistent with our results and may be due to different methodological choices. Gastil and colleagues studied naturally occurring juries, and their high level of external validity thus comes at the price of lower control over measurement. That study thus was not able to measure speaking directly, as our study did, but rather had to measure speaking frequency by the participants’ own self-report. Similarly, Jacobs, Cook, and Delli Carpini (2009) relied on self-reports removed in time from the actual discussion to assess the experiences of deliberators. The reported features and contents of the deliberation may be colored by the positive or negative attitudes of the deliberators toward some aspect of the experience.11 Thus our choice of research design provides an advantage in the ability to use clean, controlled measures of key aspects of the discussion and its structures, and this choice has important consequences for our ability to draw valid conclusions.12
All this trouble with observational studies of gender and gender composition, and we have not even begun to spell out the problems with studies of decision rule.
First, there is the problem of endogeneity. For example, Mansbridge suggests that two types of groups tend to choose unanimous rule. One type is the group with a severe, long-term, and core conflict. The other type is its opposite—groups such as Quakers or small New England towns where people have strong social ties expect to interact frequently over a long future horizon and assume that everyone shares similar long-term core interests (1983). If so, then the implication is that unanimous rule is not random. It is a purposeful, deliberate choice, one meant to address particular conditions and needs. Here again we face the dangers of endogenous predictors. Is the group using a unanimous rule because it is already inclined to want to include everyone, including women? Are groups with many women more oriented to inclusion and thus likely to use unanimous decision rules? We do not know, and so we cannot be sure that we are capturing the effects of decision rule rather than the effects of gender composition, or the effects of preexisting common interests, or the effects of strong social ties in the community (if not in the group itself). Put differently, if we want to know the effects of decision rule, we need to separate it out from the many factors that could be driving it and also driving the outcomes we examine.
As with studies of gender composition, the dependent variables have problems. And so do the independent variables. Game-theoretic studies of decision rule, now numerous, are highly stylized, involving such decisions as whether the group has been assigned a jar with more red than more blue balls. It is quite a leap to infer from the tendency of players who drew blue balls to choose the red jar when operating under unanimous rule that jurors are more likely to convict the innocent in a criminal trial. Similarly, these studies attempt to study deliberation through highly stylized simulations, such as taking a straw poll electronically (for a critique see Myers 2011).13 These problematic features can be seen in prominent studies in political science, such as Guarnaschelli, McKelvey, and Palfrey (2000).14 There are often good reasons for this choice. For example, Landa, Dickson, and Hafer (2008) set up a stylized deliberation consisting of sending or receiving numbers. This allowed the investigators to measure precisely the extent to which subjects conform to, or deviate from, a well-defined standard of Bayesian rationality. That standard yields specific predictions about the information that rational people should be sending to others and using in their decisions. This trade-off is defensible, but we choose to make it in the other direction and study more naturalistic forms of speech and interaction. We accept the sacrifice that this entails in the ability to measure deviations from rational individual behavior, since that is not our main research question.
The other way in which variables have been limited in the study of decision rule is that the outcome is almost always a decision in a criminal case (Diamond, Rose, and Murphy 2006, 209). Reaching a binary choice on guilt or innocence is far different from reaching a choice in a scale involving, say, money (Schkade, Sunstein, and Kahneman 2000). Juror’s demographic characteristics, such as race but also gender, may have particular and narrow effects when the decision is focused on the fate of one person, and that person’s gender or race is salient in the facts of the case. For example, a recent review of gender and juries concludes that from the pioneering studies by Hastie, Penrod, and Pennington (1983) and Davis et al. (1977) and onward, the “‘safest generalization’ about gender differences is that women are more likely than men to find the defendant guilty in a rape case” (Fowler 2005, 21). In addition, psychology studies tend to report robust effects of unanimous rule on length of discussion, but little else (Diamond, Rose, and Murphy 2006; Hans 2001).
In general, rare is the study that inquires about the effects of rule on equal participation or representation of social groups. No study has looked at the interaction of gender composition and decision rule. So for example, when Cornwell and Hans (2011) report finding no interaction between gender composition and individual gender in self-reported juror participation, we do not know if this is because they studied groups using unanimous rule and whether they would find differently among groups using majority rule.
Finally, both rule and composition studies are hampered by their lack of access to actual discussion. As noted above, game-theory studies tend to use a pale shadow of discussion, in the form of a straw poll. Many other studies rely on surveys of jurors, as the comprehensive review by Devine et al. noted (2001; see, for example, Mills and Bohannon 1980; Cornwell and Hans 2011). We have reason to wonder about the validity of juror’s self-reports about discussion, such as their level of participation in it. Self-reported level of participation in jury discussion is likely to be biased in any number of ways. People are notoriously bad at accurately remembering and reporting their past behavior. A juror may not be noticing how much they are participating and thus be unable to accurately report that level later. This problem is exacerbated by question and response wordings that ask the respondent to report behavior in general terms. A question such as “how much did you participate in the jury deliberation” is not specific enough to capture the quantity of interest, which is the person’s percentage of the group’s floor time or of its total speaking turns. This question wording problem cumulates when using vague response options such as “a great deal” (Cornwell and Hans 2011). These wordings are likely to be plagued by a great deal of measurement error that compounds the problem of faulty recollection. Along with faulty memory, these self-reports are likely to be biased upward by social desirability. The good citizen is supposed to participate in deliberation, so that those who participate at relatively low levels are unlikely to report doing so. Furthermore, people who participate less but who do not wish to acknowledge doing so may create nonrandom measurement error in the variable. If women are more dutiful than men, they may be more prone to mis-remember and report inflated participation out of a sense that they should be participating. Finally, there is likely to be bias from selective nonresponse, or from different interpretations of the meaning of “a great deal” or of “participate.” What seems to be “a great deal” of participation to one juror might be “only a little” to another and vice versa.
A seemingly appealing way to remedy the problems with observational studies of composition is to use natural experiments. In this design, the researcher notices that actual political actors have randomly introduced an increase in gender composition to some decision-making groups and not others. Or better yet, increased gender composition is imposed on one set of groups but not another. We measure the difference from before to afterward, and we contrast that prepost difference with the absence of difference among the untreated groups. If the process of assigning groups is random, then the researcher can conclude that any differences between the treated and untreated groups can only be due to the differences in gender composition. While this method has important strengths, it is often not as good as random assignment under controlled conditions. That is because in the real world, naturally occurring random assignment is often not really random (Sekhon and Titiunik 2012).15 Sekhon and Titiunik make a point of highlighting this problem in particular in the case of gender composition. A number of studies have attempted to use the seemingly random application of gender quotas for elected representatives to locales in India, for just the type of causal inference we have described. However, as Sekhon and Titiunik show, the real world is sufficiently messy as to call into serious question the ability to substitute natural experiments for random assignment to gender compositions under controlled conditions.
No study is likely to remedy every methodological problem, and some of the studies we have cited here are among the best, most pathbreaking works in their respective disciplines. Nonetheless, when it comes to the specific questions that animate our research—questions about the effects of group-level factors on what happens during deliberation, what outcomes emerge from group decision making, and how participants feel about it afterward—a controlled experiment with a sufficiently large number of groups offers a uniquely helpful way to find answers.
Appendix B: Question Wording for Key Pre- and Postdeliberation Survey Measures
RANKING OF PRINCIPLES OF DISTRIBUTION:
Pre- and Postdeliberation Preferences for Distributive Principle
—“Rank the following 4 principles of distributive justice according to your personal preference.”
Response Options: Maximize the Floor Income, No Taxes or Redistribution, Set a Floor Constraint, Set a Range Constraint
Pre- and Postdeliberation Certainty about Ranking
—“How do you feel about your ranking of these principles?”
Response Options: Very Unsure, Unsure, No Opinion, Sure, Very Sure
Predeliberation Measures
EGALITARIANISM INDEX:
—“If people work hard they almost always get what they want.” (Reverse coded)
—“Even if people try hard, they often cannot reach their goals.”
—“This country would be better off if we worried less about how equal people are.” (Reverse coded)
—“Relative equality of wealth is a good thing.”
—“Any person who is willing to work hard has a good chance at succeeding.” (Reverse coded)
—“It is not really that big of a problem if some people have more of a chance in life than others.” (Reverse coded)
—“If people were treated more equally in this country we would have fewer problems.”
—“Our society should do whatever is necessary to make sure that everyone has an equal opportunity to succeed.”
—“Most people who fail should not blame the system; they have only themselves to blame.” (Reverse coded)
Response Options: Strongly Agree, Agree, Neutral, Disagree, Strongly Disagree
CONFIDENCE INDEX:
—“I feel that I have a pretty good understanding of the important political issues facing us today.”
—“Sometimes politics and the government seem so complicated that a person like me can’t really understand what is going on.” (Reverse coded) —“I am capable of participating effectively in group discussions about important political issues.”
—“I am frequently frustrated by my inability to express my opinions to others.” (Reverse coded)
—“In general, I do better on most things than most people.”
—“I am confident in my abilities, even when confronting tasks I haven’t done before.”
Response Options: Strongly Agree, Agree, Neutral, Disagree, Strongly Disagree
COMFORT WITH DISAGREEMENT:
—“I feel uneasy and uncomfortable when people argue about politics.”
Response Options: Strongly Agree, Agree, Neutral, Disagree, Strongly Disagree
EMPATHY:
—“I easily put myself in the shoes of those who are in discomfort.”
Response Options: Strongly Agree, Agree, Neutral, Disagree, Strongly Disagree
Postdeliberation Measures
INFLUENCE:
—“Who was the most influential member of your group during the group discussion? (Indicate using the letter on the nameplate in front of the group members.)”
Response Options: A, B, C, D, E
—“How satisfied or dissatisfied are you with your group discussion?”
Response Options: Very Dissatisfied, Somewhat Dissatisfied, Neither, Some-what Satisfied, Very Satisfied
MY VOICE WAS HEARD:
—“I feel like my voice was heard during the group discussion.”
Response Options: Strongly Agree, Agree, Neutral, Disagree, Strongly Disagree
MY OPINIONS WERE INFLUENTIAL:
—“My opinions were influential in shaping the group discussion and final decision.”
Response Options: Strongly Agree, Agree, Neutral, Disagree, Strongly Disagree
DIFFICULTY OF GROUP WORK:
—“Group work made everything slower and harder to accomplish.”
Response Options: Strongly Agree, Agree, Neutral, Disagree, Strongly Disagree
DIFFERENT PERSPECTIVES WELCOME:
—“All different perspectives were welcome in our discussion.”
Response Options: Strongly Agree, Agree, Neutral, Disagree, Strongly Disagree
FEW DOMINATED:
—“A few people dominated the discussion.”
Response Options: Strongly Agree, Agree, Neutral, Disagree, Strongly Disagree
ACCOMPLISHMENT:
—“I feel like I accomplished more because I worked with other people.”
Response Options: Strongly Agree, Agree, Neutral, Disagree, Strongly Disagree
LIBERALISM / CONSERVATISM:
—“On most political matters do you consider yourself to be …”
Response Options: Strongly Conservative, Moderately Conservative, Neither/Middle-of-the-Road, Moderately Liberal, Strongly Liberal

Figure A5.1. Proportion Talk, by gender and experimental condition.
Table A5.1: Equality of the Distribution of Proportion Talk
|
(1) |
(2) |
Majority Rule |
12.7 |
70.3*** |
|
(10.7) |
(25.2) |
Number of Women |
0.4 |
11.2** |
|
(2.3) |
(5.2) |
Majority × Number of |
–8.1** |
–18.2*** |
Women |
(3.5) |
(7.3) |
Number of Egalitarians |
1.3 |
0.7 |
|
(2.5) |
(3.8) |
Majority × Number of |
1.7 |
–5.0 |
Egalitarians |
(3.2) |
(5.0) |
Constant |
40.9*** |
1.2 |
|
(7.6) |
(18.1) |
Observations |
64 |
45 |
R-squared |
0.14 |
0.19 |
Control for Outlier |
Yes |
Yes |
Control for Experimental |
Yes |
Yes |
Location |
|
|
Note: Group-level analysis of mixed-gender groups only. In Model 1, all mixed gender groups are included; Model 2 is based only on groups with at least two women. Standard errors in parentheses. *** p < 0.01, ** p < 0.05, * p < 0.1, one-tailed test.
Table A5.2: Effect of Rule and Composition on Feeling That “My Voice Was Heard” during Group Discussion, Mixed-Gender Groups Only
|
Women |
Men |
Majority Rule |
–0.12* |
0.05 |
|
(0.08) |
(0.05) |
Number of Women |
–0.04*** |
0.03** |
|
(0.01) |
(0.01) |
Majority × Number of Women |
0.06*** |
–0.04* |
|
(0.02) |
(0.02) |
Egalitarianism |
0.02 |
–0.07 |
|
(0.07) |
(0.08) |
Number of Egalitarians |
–0.00 |
0.02 |
|
(0.01) |
(0.01) |
Majority × Number of Egalitarians |
–0.00 |
–0.01 |
|
(0.02) |
(0.02) |
Constant |
0.89*** |
0.81*** |
|
(0.07) |
(0.04) |
Observations |
157 |
163 |
R-squared |
0.06 |
0.09 |
Control for Outlier |
Yes |
Yes |
Control for Experimental Location |
Yes |
Yes |
Note: Individual-level analysis. Cluster robust standard errors in parentheses. *** p < 0.01, ** p < 0.05, * p < 0.1, one-tailed test.
Table A5.3: Determinants of the Gender Gap in Influence with Interactions between Decision Rule and Controls, Mixed-Gender Groups Only
|
(1) |
(2) |
Majority Rule |
0.492 |
0.738 |
|
(0.918) |
(1.184) |
Number of Women |
0.309* |
0.256 |
|
(0.201) |
(0.213) |
Majority × Number of Women |
–0.721*** |
–0.684** |
|
(0.301) |
(0.310) |
Number of Egalitarians |
–0.197 |
–0.083 |
|
(0.235) |
(0.264) |
Majority × Number of Egalitarians |
0.335 |
0.193 |
|
(0.282) |
(0.320) |
# Favoring Maximum Redistribution |
–0.032 |
–0.375 |
|
(0.258) |
(0.476) |
Majority × Number Favoring Max Redistribution |
|
0.493 |
|
|
(0.570) |
# Favoring No Redistribution |
0.080 |
0.231 |
|
(0.238) |
(0.405) |
Majority × # Favoring No Redistribution |
|
–0.233 |
|
|
(0.505) |
Constant |
0.738 |
0.553 |
|
(0.766) |
(0.948) |
Observations |
64 |
64 |
R-squared |
0.175 |
0.190 |
Control for Outlier |
Yes |
Yes |
Control for Experimental Location |
Yes |
Yes |
Note: Dependent variable for both models is Gender Gap in Influence. Group-level analysis. Standard errors in parentheses. *** p < 0.01, ** p < 0.05, * p < 0.1, one-tailed test.

Figure A6.1. Effect of liberalism on Proportion Talk by condition, mixed-gender groups only.
Table A6.1: Mean Characteristics across Conditions, Women Only

Appendix A
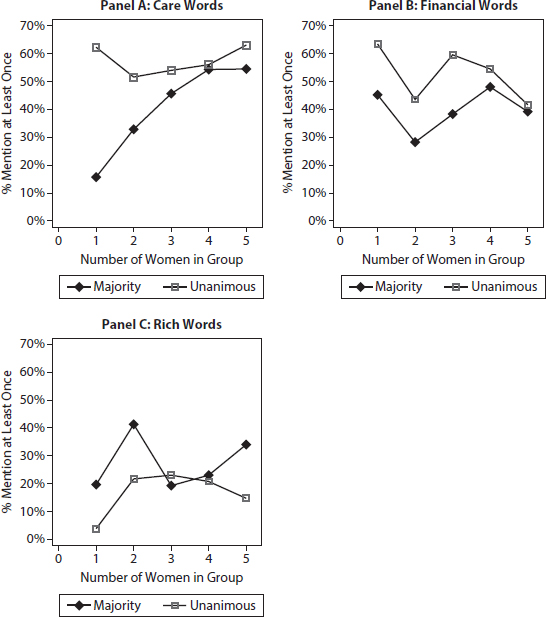
Figure A7.1. Mention of words among women, by rule (predicted values).

Figure A7.2. Effect of composition on individual women’s Frequency and Mention of care issues, majority rule (predicted values).

Table A7.1: Regression Models Generating Predicted Probabilities of Mention/Frequency (for Figures 1, 2, 4, 5, 6, A1, A2, C7.1)


Note: Individual-level analysis. Cluster robust standard errors in parentheses. Excluded category is 1-woman groups in all models. Empty cells in probit analyses indicate conditions under which there was no variation within a subgroup. *** p < 0.01, ** p < 0.05, * p < 0.10, two-tailed test.
Table A7.2: Regression Models Generating Predicted Probabilities of Mention/Frequency for Summary Measure of Care and Financial Issues


Note: Individual–level analysis. Cluster robust standard errors in parentheses. Excluded category is 1-woman groups in all models. Empty cells in probit analyses indicate conditions under which there was no variation within a subgroup. *** p < 0.01, ** p < 0.05, * p < 0.10, two-tailed test.
Table A7.3: Frequency of Care Issue Mentions among Women: Replication of Linear Model with TM
|
(1) |
(2) |
Majority Rule |
–1.474*** |
–1.476*** |
|
(0.415) |
(0.473) |
Number of Women |
–0.026 |
–0.026 |
|
(0.112) |
(0.113) |
Majority Rule × Number of Women |
0.399*** |
0.398** |
|
(0.137) |
(0.152) |
Egalitarianism |
–0.101 |
–0.101 |
|
(0.441) |
(0.445) |
Number of Egalitarians |
0.008 |
0.007 |
|
(0.090) |
(0.116) |
Majority Rule × Number of Egalitarians |
— |
0.001 |
|
— |
(0.138) |
Constant |
1.605*** |
1.606*** |
|
(0.417) |
(0.433) |
Observations |
157 |
157 |
R-squared |
0.107 |
0.107 |
Control for Experimental Location |
Yes |
Yes |
Note: Dependent variable for both models is Frequency of Care Issues. Individual-level analysis. Cluster robust standard errors in parentheses. *** p < 0.01, ** p < 0.05, * p < 0.10, two-tailed test.
Appendix B: Dictionaries Used for Content Analysis Words associated with “poor” (LIWC)
*A downloadable .txt file with all words from these dictionaries is available at the authors’ websites.
poor* |
penniless |
poverty |
poverty-stricken |
those in need |
in financial trouble |
people in need |
alms |
person in need |
bankrupt* |
someone in need |
economically dependent |
somebody in need |
financially dependent |
lower class |
down-and-out |
less fortunate |
guttersnipe* |
homeless |
mendicant* |
hungry |
pauper* |
hunger |
poverty |
have-not |
street person |
have-nots |
street people |
people on welfare |
suppliant* |
person on welfare |
vagrant |
those on welfare |
vagrants |
people who need economic |
ward of the state |
assistance |
wards of the state |
those who need economic |
indigent* |
assistance |
those who are lacking |
person who needs economic |
low socioeconomic status |
assistance |
food stamps |
people who need help |
destitute* |
those who need help |
low earner |
person who needs help |
the bottom |
needy |
low income |
in need |
lower income |
those who have less |
lowest income |
people who have less |
don’t have a home |
person who has less |
starve* |
beggar* |
hardship |
hard up |
impoverish* |
hard-up |
indigence* |
indigent* |
privation* |
dead broke |
penniless* |
Words associated with “needy” (LIWC)
safety net |
in the streets |
get by |
minimum standard of living |
die* |
bare minimum |
eat* |
minimum wage |
starve* |
you can live |
survive* |
able to live |
in the street |
struggle* |
Words associated with “salary” (LIWC)
salary* |
|
wage |
|
wages |
|
paid |
|
earn* |
|
Words associated with “family” (LIWC)
family |
relatives |
families |
household* |
parent* |
brother |
mother* |
brothers |
father* |
sister |
kin |
sisters |
Words associated with “children” (LIWC)
child* |
eighteen-year-old |
kid |
adolescent* |
kids |
baby |
young |
babies |
youth |
youngster* |
young adult |
infant* |
young adults |
juvenile* |
student* |
kiddie* |
18 year old |
little ones |
18 year olds |
minors |
18-year-old* |
newborn* |
boy |
|
teen* |
girl |
toddler* |
boys |
tot |
girls |
tots |
|
Words associated with “tax” (LIWC)
taxpayer* |
those who pay taxes |
tax-payer* |
people who pay taxes |
tax payer |
person who pays taxes |
tax payers |
tax |
those who pay tax |
taxes |
people who pay tax |
taxation |
person who pays tax |
|
Words associated with “rich” (LIWC)
rich |
person with means |
elite |
of means |
wealthy |
rolling in it |
CEO* |
rolling in the dough |
affluent |
upper class |
people who are loaded |
at the very top |
those who are loaded |
nouveau riche |
person who is loaded |
upper crust |
someone who is loaded |
high earner |
moneyed |
highest level person |
monied |
at the top |
of independent means |
doing extremely well |
of substantial means |
highest bracket |
people with means |
making the most |
those with means |
|
Words Used in TM Analysis Care (TM)
care |
kids |
education |
need |
enough |
poor |
family |
poverty |
food |
school |
help |
welfare |
dollar |
pay |
dollars |
tax |
earn |
taxes |
earning |
work |
incentive |
working |
job |
|

Figure A8.1. Disposition summary statistics (raw).


Figure A8.3. Proportion of speaking turns that gave or received positive or negative interruptions (raw). Note: Along the x-axis “U” represents men and women in unanimous-rule groups; “M” for majority-rule groups; stratified by number of women in the group.
Table A8.1: Elaborated Proportion of Positive or Negative Interruptions, Mixed-Gender Groups Only

Note: Individual-level analysis. Cluster robust standard errors in parentheses. *** p < 0.01, ** p < 0.05, * p < 0.10, two-tailed test.

Figure A9.1. Guaranteed minimum incomes, by site, mixed-gender groups only.
Table A9.1: Individual-Level Distribution of Redistribution Preferences before and after Deliberation (%)
|
Women (N = 232) |
Men (N = 238) |
Predeliberation Preferences |
|
|
Maximize Floor |
12.5 |
8.8 |
No Redistribution |
9.9 |
21.0 |
Set Floor |
65.5 |
54.2 |
Set Range |
11.6 |
15.6 |
Postdeliberation Preferences |
|
|
Maximize Floor |
6.0 |
7.6 |
No Redistribution |
4.3 |
14.7 |
Set Floor |
81.9 |
66.0 |
Set Range |
6.9 |
10.1 |
Note: Two respondents did not offer predeliberation preferences, and six respondents did not answer the questions about their postdeliberation preferences.
Table A9.2: Effect of Experimental Conditions on the Likelihood of Having a Female Agenda Setter, Mixed-Gender Groups Only

Note: Cell entries are probit coefficients. Dependent variable is a dummy variable indicating whether or not the group’s agenda setter was a woman. Group-level analysis. Standard errors in parentheses. *** p < 0.01, ** p < 0.05, * p < 0.1, one-tailed test.
Table A9.3: Effect of Experimental Conditions on Average Maximum Endorsed Safety Net Amount by Women, Group-Level Analysis, Mixed-Gender Groups Only

Note: Dependent variable is the average maximum endorsed safety net endorsed by women in the group. Observations for models with average feeling thermometer toward the poor are lower because some groups were not asked about their feelings toward the poor prior to deliberation. Group-level analysis. Standard errors in parentheses. *** p < 0.01, ** p < 0.05, * p < 0.1, two-tailed test.
Table A9.4: Effect of Speaking Time and Gender on Expressions of Safety Net Generosity, by Gender Composition, Mixed-Gender/Majority Rule Groups Only

Note: Dependent variable is maximum endorsed floor amount in thousands of dollars. Coefficients are expressed floor amounts in thousands of dollars. Individual-level analysis. Cluster robust standard errors in parentheses. *** p < 0.01, ** p < 0.05, * p < 0.1, two-tailed test.
Table A9.5: Effect of Majority Female Groups on Group’s Safety Net Generosity, by Decision Rule, All Groups

Note: Dependent variable is the group’s chosen minimum guaranteed income, in dollars. Enclave groups included. Group-level analysis. Standard errors in parentheses. *** p < 0.01, ** p < 0.05, * p < 0.10, one-tailed test.
Table A9.6: Effect of Gender Composition and Rule on Group’s Safety Net Generosity, Mixed-Gender Groups Only
|
(1) |
(2) |
Majority Rule |
–6,090.44* |
–1,512.40 |
|
(3,915.68) |
(4,626.93) |
Number of Women |
–732.22 |
–1,223.25 |
|
(1,005.94) |
(1,021.95) |
Majority Rule × Number of Women |
1,908.78* |
2,353.05* |
|
(1,443.28) |
(1,539.33) |
Number of Egalitarians |
|
2,164.19** |
|
|
(1,107.80) |
Majority Rule × Number of Egalitarians |
|
–2,128.49* |
|
|
(1,427.36) |
Constant |
24,462.51*** |
20,835.46*** |
|
(2,883.25) |
(3,383.33) |
Observations |
64 |
64 |
R-squared |
0.26 |
0.31 |
Control for Experimental Location |
Yes |
Yes |
Note: Dependent variable is the group’s chosen minimum guaranteed income, in dollars. Group-level analysis. Standard errors in parentheses. *** p < 0.01, ** p < 0.05, * p < 0.10, one-tailed test.
Table A9.7: Relationship between Endorsed Preferences and Group’s Safety Net Generosity, Group-Level Analysis, Mixed-Gender Groups Only

Note: Group-level analysis. Dependent variable is the group’s chosen minimum guaranteed income, in dollars. Analysis restricted to groups in which men and women endorsed a poverty line. Some groups were not asked prior to deliberation about their feelings toward the poor. Standard errors in parentheses. *** p < 0.01, ** p < 0.05, * p < 0.1, two-tailed.

Note: Group-level analysis. Dependent variable is the group’s chosen minimum guaranteed income, in dollars. Groups in which no women or men endorsed a minimum income amount have a volume of 0. Some groups were not asked prior to deliberation about their feelings toward the poor. Standard errors in parentheses. *** p < 0.01, ** p < 0.05, * p < 0.1, two-tailed.
Table A9.8: Effect of Endorsed Preferences, Gender Composition and Rule on Group’s Safety Net Generosity, Mixed-Gender Groups Only

Note: Dependent variable is the group’s chosen minimum guaranteed income, in dollars. Group-level analysis. Standard errors in parentheses. *** p < 0.01, ** p < 0.05, * p < 0.10, one-tailed test.
Table A9.9: Relationship between Care Issues and Group’s Safety Net Generosity
|
(1) |
(2) |
Men Low Ratio/Women High Ratio |
–12,960.90** |
–17,433.66*** |
|
(5,314.14) |
(5,788.18) |
Women’s Total Proportion Talk |
–10,959.83** |
–14,961.96* |
|
(5,411.67) |
(8,442.27) |
Men Low/Women High × Women’s |
25,850.63*** |
31,773.79*** |
Total Proportion Talk |
(9,571.47) |
(10,154.88) |
Men High Ratio/Women High Ratio |
166.80 |
–3,778.57 |
|
(5,483.41) |
(5,981.58) |
Men High/Women High × Women’s |
7,793.34 |
13,716.25 |
Total Proportion Talk |
(10,852.94) |
(11,530.66) |
Men High Ratio/Women Low Ratio |
–10,051.59** |
–12,358.46** |
|
(4,305.76) |
(4,627.25) |
Men High/Women Low × Women’s |
18,657.81* |
21,737.39** |
Total Proportion Talk |
(9,256.76) |
(9,659.98) |
Majority Rule |
|
–7,407.16 |
|
|
(5,381.98) |
Number of Women |
|
–637.89 |
|
|
(1,681.74) |
Majority Rule × Number of Women |
|
2,774.47 |
|
|
(1,921.29) |
Number of Egalitarians |
906.80 |
1,225.85 |
|
(834.68) |
(1,191.21) |
Majority × Number of Egalitarians |
|
–951.64 |
|
|
(1,608.11) |
Constant |
24,232.95*** |
28,743.74*** |
|
(2,818.50) |
(4,207.92) |
Observations |
52 |
52 |
R-squared |
0.45 |
0.50 |
Control for Experimental Location |
Yes |
Yes |
Note: Dependent variable is group’s chosen minimum guaranteed income, in dollars. Group-level analysis. Standard errors in parentheses. *** p < 0.01, ** p < 0.05, * p < 0.1, two-tailed test.
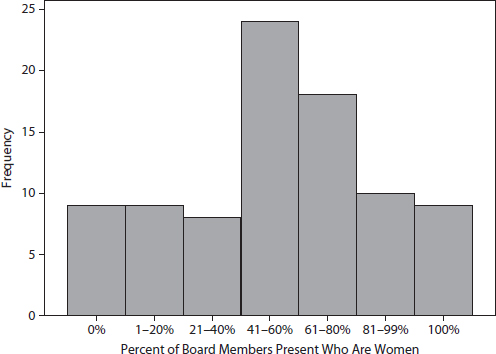
Figure A10.1. Distribution of school boards, by gender composition.
Table A10.1: Equality Ratio, by Gender Composition and Female Leadership

Note: Boards with a minority of women are those in which fewer than 50% of attending members are women. Standard errors in parentheses. *** p < 0.01, ** p < 0.05, * p < 0.1, one-tailed difference of means test.
Table A10.2: Determinants of Female Chairs
|
(1) |
(2) |
Proportion Women |
3.00*** |
2.87*** |
|
(0.62) |
(0.57) |
Size of Board |
|
–0.25 |
|
|
(0.22) |
Board Experience (median years) |
|
0.07 |
|
|
(0.07) |
# of College Graduates on Board |
|
0.08 |
|
|
(0.20) |
Public Comment at Meeting |
|
0.05 |
|
|
(0.47) |
Urban Area |
|
0.08 |
|
|
(0.31) |
Superintendent Is Female |
|
0.72*** |
|
|
(0.25) |
# of Students Enrolled |
|
0.10 |
|
|
(0.20) |
Budget per Student |
|
–0.35 |
|
|
(0.80) |
Length of Meeting |
|
0.05 |
|
|
(0.11) |
South |
|
–0.33 |
|
|
(1.03) |
West |
|
0.32 |
|
|
(0.39) |
Midwest |
|
0.26 |
|
|
(0.49) |
Constant |
–1.75*** |
0.81 |
|
(0.36) |
(8.00) |
Log pseudolikelihood |
–39.71 |
–31.11 |
Observations |
69 |
63 |
Control for Outlier |
No |
No |
Note: Entries are probit coefficients. Dependent variable is dichotomous indicator of whether board chair is female. Group-level analysis. Cluster robust standard errors in parentheses (cluster by state). *** p < 0.01, ** p < 0.05, * p < 0.1, one-tailed test.
Table A10.3: Ratio of Proportion of Turns Taken by Women to Proportion of Women Attending, Civic Dialogue Groups
|
(1) |
(2) |
Proportion Wome |
–0.40** |
–0.52*** |
|
(0.11) |
(0.05) |
Total # of Speaking Turns |
|
–0.00** |
|
|
(0.00) |
Male Facilitator |
|
–0.08*** |
|
|
(0.01) |
Constant |
1.22*** |
1.34*** |
|
(0.07) |
(0.04) |
Observations |
22 |
22 |
R-squared |
0.41 |
0.53 |
Note: Dependent variable is equality ratio for women. Individual-level analysis. Cluster robust standard errors in parentheses (cluster by group location). *** p < 0.01, ** p < 0.05, * p < 0.1, one-tailed test.
1 For example, the oft-cited study of jurors by Mills and Bohannon studied individual, not group, characteristics (1980). A classic study of jury decision making found that men initiated 40% more comments than women but did not separate gender differences from gender composition (Hastie, Penrod, and Pennington 1983, 141–42; see also Kirchmeyer 1993; Diamond, Rose, and Murphy 2006). Similarly, we know that women are still less likely to be elected jury foreperson, but not if this varies with gender composition (Cornwell and Hans 2011, 671). A much-cited study, reporting that men composed about 40% of jurors but were chosen as the jury foreperson 90% of the time, rests on eighteen juries (Ellsworth 1989, 213, cited in Sanders 1997). See Hickerson and Gastil (2008) for a study that does attempt to estimate and examine the effect of the gender composition of juries.
2 Cornwell and Hans write that “previous research on juries has been limited in its ability to contextualize jurors’ participation because of a lack of variation in, or information about, case- and jury-level characteristics” (2011, 672).
3 Of particular note is the dearth of studies investigating the impact of group composition in a controlled setting rather than in field studies where jurors are interviewed after the fact, sometimes much later, and in which the number of juries is often small (Devine et al. 2001, 673; as an example, see Cornwell and Hans 2011; Hickerson and Gastil 2008).
4 This comes from the general focus on the individual and the indifference to the group level of analysis. In fact, in some studies of deliberation, we do not know how many groups are included because the unit of analysis is the individual and the number of groups deemed irrelevant (see Karpowitz and Mendelberg 2011; and Myers and Mendelberg 2013, for a review).
5 Again, Kathlene’s study illustrates the problem. This study is a wonderful, pathbreaking investigation of detailed speech acts in the Colorado state legislature. But Kathlene (1994) relies on twelve hearings that vary simultaneously in gender composition, female chair holding, whether the bill deals with women’s issues, whether the bill’s sponsor is female, and so on. In other words, while there are bits and pieces of analysis, some executed brilliantly with a small number of cases, some big pieces are missing, and so far we lack a complete picture of the different types of effects.
6 Or, take for example the finding that the more women, the less corruption. We do not know if the women decreased corruption or if less corrupt places are more likely to draw women into politics. A similar criticism applies to the effect of gender composition in countries or their subunits. Chattopadhyay and Duflo put it this way (2004, 1410): “For example, Dollar, Fisman, and Gatti (2001) find a negative correlation between representation of women in parliaments and corruption. Does this mean women are less corrupt, or that countries that are less corrupt are also more likely to elect women to parliament? Besley and Case (2000) show that worker compensation and child support enforcement policies are more likely to be introduced in states where there are more women in parliament, after controlling for state and year fixed effects. But they explicitly recognize that the fraction of women in parliament may be a proxy for women’s involvement in politics, more generally.”
7 The number of women on town councils grows steadily with the city’s size, from an average of one out of five or six for cities under 25,000, to an average of five out of fourteen in cities over one million (Nelson 2002, 2–3).
8 Bryan found in Vermont that the smaller the meeting size, the higher was women’s share of speech participation; while the size of this effect is small, it nevertheless raises the more general worry about a conflation of size and gender composition. Jury studies find that size can matter in various complex ways (Cornwell and Hans 2011). If gender composition correlates with group size, we cannot tell whether it is size or gender composition that drives the effects we see.
9 The respondent’s thought process may be something along these lines: “Did I express an opinion at a meeting? Or did I speak but not actually offer an opinion? I’m really not sure.” This type of response may be hard to provide with accuracy. Given the demands that a long survey interview imposes on the person’s mental resources, the typical respondent may not be up to doing the mental work needed to sift through their memories (Schwarz and Oyserman 2001). In addition, the questions depend on respondents’ own assessment of what is “mixed-gender” or “mostly” or “few” members of the same sex. It is possible that some people who belong to 60% female organizations call that “mixed gender” while others call that “mostly” female, or that many members of 25% female groups think of those as mixed gender rather than as “few” women, for example. And, perhaps women who feel included and active in their organization are more likely to categorize or call it “mostly” female, while those who feel less included or active are likely to call it “mixed gender.” Thus we can see how random measurement error, or systematic error, could creep into the key variable of gender composition.
10 For example, in a study of gender differences in jury influence, Mills and Bohannon found that women were less likely to report that they were chosen as foreperson and that they influenced the jury; however, these results could instead be produced by the possibility that the more influential women were simply less likely to reply to the survey. These difficulties with a survey based on self-report, and those we detail in chapter 4, apply to analysis of descriptive representation more generally, not just to the enclave hypothesis.
11 For example, their finding that respondents reported satisfaction with moderators’ elicitation of various opinions may be influenced by the fact that over 90% of respondents agreed with the group’s outcome (Jacobs, Cook, and Delli Carpini 2009, 77 and 78, respectively). Other surveys of deliberative experiences share the problems of self-reports (Ryfe 2002).
12 In addition, that study did not measure, and thus cannot account for, the structure of deliberation, including the group’s gender composition, so that their finding of no differences by the person’s gender (or race, class, or other status characteristics) does not tell us whether gender matters under the conditions that we find it does (Gastil et al. 2010, 158–59).
13 In game-theory experiments, where much work has been done on decision rules, researchers typically recruit a small number of subjects and then cycle them through various groups. For example, Guarnascheli, McKelvey, and Palfrey (2000) use forty-eight subjects. This heavy use of a within-subjects design can be quite problematic (Morton and Williams 2011). For example the effect of any given condition may depend on prior exposure to other conditions and might have no effect without such exposure. Randomly varying the order of treatments cannot tell us if the order has an effect without a sufficiently large number of cases (Morton and Williams 2011).
14 Game-theoretic experiments yield mixed results on the question of whether people behave strategically during deliberation. Contrast, for example, Guarnaschelli, McKelvey, and Palfrey (2000) against Landa, Dickson, and Hafer (2008). The latter conclude that many subjects “overspeak” when their incentives dictate silence: “While our subjects do respond to strategic incentives, they nonetheless come closer to the normative ideal of a free ‘exchange of arguments’ than Bayesian-rational predictions would expect. It is particularly striking that this should be the case even in a highly stylized experimental environment, in which individuals’ outcome-based interests can be quite clearly discerned.”
15 Field experiments improve on natural experiments but suffer the problems of noncompliance, contamination of one condition by the effects of another, subjects dropping out before the study is done, and more. While they have important advantages over controlled studies, they are not with-out big trade-offs. Ideally a research program will use some controlled experiments together with an element of natural or field experimentation.