Heijunka, Planning and Scheduling, Sequencing Activities, Mixed Model
Takt–Flow–Pull
In Lean, there is a saying, which is takt … flow … pull, which is short for implementing a Lean system. This system requires one to:
1. Understand the customer demand and that everything starts with the customer. Once we know the customer demand and our available time, we can calculate our takt time.
2. Establish flow within the factory (or service company) from raw materials to finished goods/shipping in accordance with the beat of the takt time.
3. Create a pull system with synchronized linkage to our customer and supply chain. As they use our parts, they let us know in real time, which then triggers an order at our workshop. The orders at the workshop then trigger orders throughout our supply chain. This system embodies JIT, jidoka, and the respect for humanity-based Lean culture.
We have already discussed takt time and one-piece flow production. This chapter discusses other concepts that tie to takt time, flow production, and pull systems.
Build to Order versus Push Production versus Pull Systems
In “build to order systems,” the products are not made until an order is received. Most companies use some type of enterprise resource planning system. Within that system is a master schedule and an MRP, or some type of shop floor control system. These systems consolidate requirements, order materials, and then release scheduled orders based on lead-time offsets. “Lead-time offsets” are the lead times put into the system for the supplier, receipt, inspection, manufacture, etc. This creates what we call a “push-type system.” In this system, MRP (based on the planner’s review and approval) is the “trigger” for the order. The work orders are released and then scheduled in the various work centers in the shop.
If the company triggers each order based on the shipment of a previous order where the shipment creates the trigger, this is considered a pull system. If the pull is from finished goods, then it is not a true “build to order” system, but it is still considered a “pull system.”
Heijunka: Pull Scheduling–Production Leveling–Level Loading
It is important to follow production leveling, (also known as production smoothing) or in Japanese, “heijunka,” which translated means “a plain, flat level,” a “standard level,” and “change.” Level loading is a technique for reducing the mura waste, and is vital to the development of production efficiency in the Toyota Production System and Lean manufacturing. The general idea is to produce intermediate goods at a constant rate and to allow further processing to be carried out at a constant and predictable rate.
Peak Demand
Sometimes we need to look at peak demand when determining capacity and how to set up the line. We need to make sure that we can handle peak demand whenever it would occur. We see this phenomenon more in hospitals, for instance, arrivals by hour to the emergency room, but we also encounter it in factories and service industries. Internet-based orders peak at certain times during the day, or seasonality can affect demand as well. We generally look at peak demand either daily or hourly and determine the takt time and line constraints accordingly.
Mixed Model Production
Production-Smoothing Example
A key concept for level loading is production smoothing, which involves taking the production schedule and averaging it into daily or even hourly demand. Let’s review an example. Let’s say an automotive company uses a press to make parts for multiple vehicles. This concept of leveling the weeks’ worth of production into smaller daily lots is called heijunka or production smoothing (see Figure 21.1). For instance, if we have a weekly demand for part A of 1000 pieces, part B of 750 pieces, and part C of 250 pieces, we can perform a mathematical equation of dividing each part quantity by five (to obtain the daily demand). For part A, this means we need to produce a quantity of 200 pieces per day (1000 ÷ 5), part B 150 pieces per day (750 ÷ 5), and part C 50 pieces per day (250 ÷ 5).
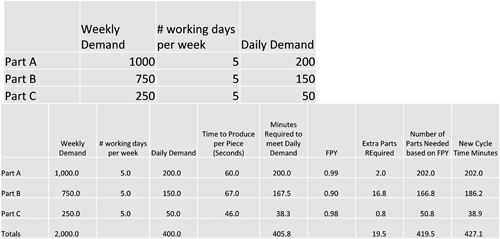
Figure 21.1 Production-smoothing example—calculating daily machine time based on FPY. (Source: BIG Archives.)
When we implement heijunka for a press, line, or a plant, we have to routinely review the assumptions and ensure that the actual performance meets the planned assumptions. If not, then we have the choice of either correcting the variance by problem-solving and implementing corrective actions, or as a last resort after we have exhausted our improvement opportunities, we then adjust our assumptions.
Production Sequencing
In manufacturing production sequencing is utilized to level out production of various or “mixed” models (see Figure 21.2). This concept allows Toyota to run multiple car types down the same line one model after another. This can be accomplished only with flexibility built into the layout, equipment, utilities, and people. The idea behind this concept is to schedule products evenly to avoid batches of products coming in at one time. In some areas of companies, this is easy to do, and in some areas, it may be nearly impossible to do. This mixed model concept could be interpreted as running multiple types of a product family at the same time. To properly sequence activities within an operation, one must understand the order of the activities and, in most cases, the information flow. The process-flow analysis gives us these data, and then we combine it with the “amount of demand” and “type of demand” in products or services to determine the sequence. Figure 21.3 shows a sequencing worksheet.

Figure 21.2 Converting monthly scheduling to sequencing schedule. (Source: BIG Archives.)
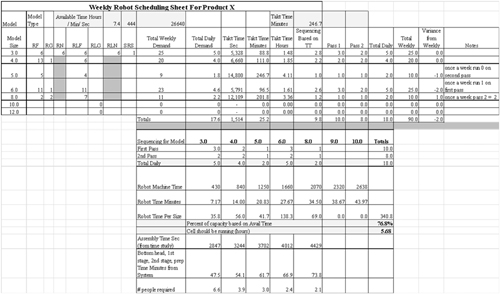
Figure 21.3 Sequencing worksheet. (Source: BIG Archives.)
Changeovers
We must compare the batch flows to the Lean flows. Let’s assume that there are six people on the line when batching. Whenever a model changes over, the rest of the line keeps running while the first station changes over. This is the same for the second station as it changes over and so on. The definition of internal setup for a line like this is from the last piece completed on the last station to the first good piece of the next lot out of the last station. An all-encompassing measure of changeover for a mixed model cell (not counting preparation) would be from last good piece to first good piece at the last station.
When changing over a one-piece flow line, we must dry up the line each time. During the initial changeovers, no one knows what to do. The first station changes over and then the other five team members have to wait for the other stations to change over. This time adds up and reduces line capacity and output. The key here is to focus on quick changeovers for the Lean cell. The setup should be videoed and reviewed with all the operators and opportunities to externalize as many tasks as possible looked for, just like we would in a machine setup.
Mixed Model Matrix
This figure shows what we call a mixed model matrix. On the left side are all the different operations the product might see (see Figure 21.4). On top (x axis) is each of the model types. Then in each box is the cycle time per model per operation. When the operations are summed up for each model, it yields the total labor time (TLT). This can then be divided by the number of operators to figure out the average cycle time and output per hour and per day.

Figure 21.4 Mixed model matrix example. (Source: BIG Archives.)
Establishing Flow: Order Staging Rack in Place
Once the Lean line is implemented, it is important to make sure that you are working on what is really needed. The first step is to set up a work order scheduling rack (see Figure 21.5). Some people refer to this as a heijunka rack; however, this is a misnomer; we are in effect starting to level load the workshop.

Figure 21.5 Heijunka Box examples. (Source: BIG Archives.)
Scheduling Board Rules
Once the Lean line is implemented, it is important to make sure that you are working on what is needed. An initial step to setting up heijunka is starting with a visual scheduling system.
1. Planning will provide a weekly schedule to the team leaders.
2. Planning will walk the floor with the team leader two times a day to review the progress of the work orders from the shipping area to final assembly, to welding, to machining, and to raw material.
3. Planning will put the work orders in the visual work order boards on the appropriate day based on the start date.
4. Planning may change the work order schedule only if the work order has not been pulled from the work order scheduling board. Once a work order is started in the cell, it may not be stopped to start another.
5. No work orders are to be put in the scheduling board queue if they have part shortages.
6. The planner and team leader are responsible to make sure that the parts are available when needed for final assembly and the staging areas with no shortages.
7. Planning is responsible to create a visual queue at each machine to show what work order is in process and to determine a way to label the work in process with the appropriate work order number.
Pitch
Pitch is the time required to supply a standard pattern of parts to a line. Pitch is calculated by multiplying the takt time (or cycle time) by the number of pieces in the pattern of parts needed for the line, which is normally a shipping box or container size.
We often use a heijunka, or sequencing box, as a visual control to know when or how we are doing according to the plan. These boxes generally have slots that represent time. It could be hours within a day or days within a month. The box is typically stored in the shipping area where the pull is started from finished goods (see Figure 21.6).
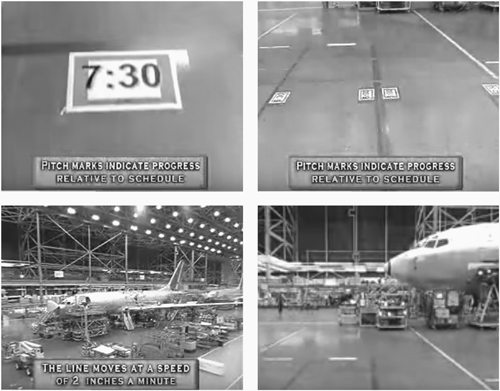
Figure 21.6 Pitch marks for Boeing 737 line indicate progress relative to schedule. (Source: https://www.youtube.com/watch?v=-y0U1Qux9EA&list=PL0C5BB2A293DCD7DE.)
Capacity and Load
When determining capacity and the load on the factory, there are certain calculations we must consider. Many times, the load is based on machining hours or percent of a work center that is scheduled. Our first calculation is of excess capacity.
|
|
What if load exceeds capacity? If load exceeds capacity, then we must review each machine and determine if we can offload to another machine, look at speeds and feeds, look at setup times and overall equipment effectiveness. We may have to investigate adding a shift or working over lunches and breaks. We also sometimes use a group-tech matrix to find “families” or groupings of parts, which allows us to increase capacity by reducing the number of changeovers.
Shop-Floor Scheduling without Using the MRP System
One of the first things we do is turn off the shop floor control sections of MRP when we implement kanbans. In Figure 21.7 one can see a simple pull system installed at final assembly. This system was designed with no kanban cards. Everything was triggered using visual controls (i.e., outlined squares on the floor, shelf gas gauges, and two-bin systems). Once a unit goes to final assembly, it pulls from the paint kanban, the paint kanban pulls from the welding kanban, which pulls from the machine shop kanban, which pulls from the raw material kanban, which sends a signal back to the supplier to replenish. We also had 80% of their materials set up on VMI (vendor-managed inventory).

Figure 21.7 Simple visual pull scheduling system from final assembly utilizing kanban at a plant in Baltimore, MD (1998). (Source: BIG Archives.)
What We Find: The Evils Created by “Demonstrated Capacity”
“Demonstrated capacity” occurs when companies or departments use their actual daily or weekly demonstrated output totals as a measure of what they can produce, versus scientific methods such as time and motion study. Time studies show what they should really be producing. We find many companies have metrics based on “demonstrated capacity,” including government and healthcare sectors. A sure sign of this phenomenon is when you ask the supervisor how he or she knows what can be produced each day, and they tell you, “I know from experience.” In the past, companies worked to standards set by true time and motion industrial engineers. Today we often work based on non-scientifically derived standards and on observation.
■ Implement in phases.
■ Consider using finished goods kanban if factory or process cannot produce make to order.
■ Develop level loading strategy, internal and external.
■ Review sales strategies; does it make sense to offer a discount or price break anymore?
■ Get sales/marketing on board. They must understand the system and the need for real information (i.e., no more “padding” delivery times).
■ Whenever you make more than you need, it prevents you from making what is really needed.
■ Eliminate buffers, reduce inventory, and change MRP lead-time offsets after you have proven you can meet customer demand.
■ Develop failure modes effects analysis or risk-mitigation strategies for each process/machine.
■ Keep scheduling systems as simple as possible or no one will follow them.
■ Work the excess WIP off starting closest to the customer.
■ Remember, if you dry up the line, you will lose output the next cycle.