Lean Machine Shops and Job Shops
What We Find
Machine shops vary as much as the work they handle. Some machine shops have fairly steady demand products but most are job-shop type environments where lot sizes can run from one piece to hundreds. Most feel Lean doesn’t, or can’t apply to them. However, with rare exceptions they are almost always wrong. We have yet to find a machine shop where no Lean principles could be applied. In a worst-case scenario, one could still apply 5S, total productive maintenance (TPM), setup reduction, visual controls, material flow, and heijunka to most machine-shop environments. Even job shops in most instances can set up cells.
Where to Start? Group-Tech Matrix
In most machine shops, the best place to start is with a group-tech matrix (Figure 19.1). The group-tech matrix will work regardless of the number of parts or lot sizes involved. The goal of the group-tech matrix is to determine what, if any, families exist and to what extent of the parts they will cover. We have created group techs with 30 parts and some with thousands of parts. The first step is to determine if most of the parts follow the same process steps or use the same equipment or are subjected to the same operations in a similar order. Some parts may skip certain machines but they can still work in the cell. Most shops can set up at least one, and normally more, cells. Parts that don’t fit any cells or simply will not flow one-piece or small-lot are relegated to what we call the misfit or model-shop cell.

Figure 19.1 Group-tech matrix example—with Xs. (Source: BIG Archives.)
The group tech may start with Xs where a part runs across a machine or operation. We can then turn the Xs into machine-run cycle times for each part (Figure 19.2). If you multiply these times and the average daily demand, it will immediately provide an idea of the loading hours on each machine. As the project progresses, the same matrix can be used to develop the kanban lot sizing for each part (Figure 19.3).

Figure 19.2 Group-tech matrix with average daily demand multiplied by the machine run time with the total hours per day required to run the parts (without setups). (Source: BIG Archives.)
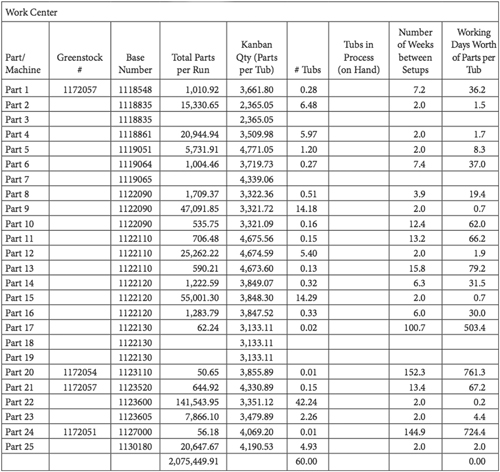
Figure 19.3 Same chart with kanban analysis. (Source: BIG Archives.)
The People Doing the Job Know Best … Sometimes
There is a term called warusa kagen, which refers to things not yet problems, but are still not quite right. They are often the starting point of improvement activities because if left untended they may develop into serious problems. Many times we hear the saying, the people doing the job know best how to do it. It is usually the operators who first notice warusa kagen, and who therefore are on the front line of improvement. While this saying is mostly accurate, there are exceptions. For instance, some machinists know how to do the job on their machine but don’t really understand everything the machine (or the programming) can do. Many times we have found that a simple call to the machine manufacturer (if they are still around) can provide solutions or options that no one knew existed.
Process-Flow Analysis
Once we do a group-tech matrix and determine a cell can be created, we do a process-flow analysis (PFA) on the part(s) in the cell to make sure we have the steps in the correct order (Figures 19.4 and 19.5). Many times routers will have steps in a different order for similar parts. We have found that this is normally due to different engineers designing the routers. Most times the steps can be changed on routers to put them in the same order. A PFA and point-to-point diagram (cell layout with point-to-point part travel paths drawn on it) are the best tools to double-check that you have the right equipment/machines in the cell and they are in the right order. The leanEdit* software-analysis tool supports machining analysis as well as transactional processes.

Figure 19.4 We ran the data through a pivot table and then sorted it multiple ways to see if we could find a family of parts. (Source: BIG Archives.)

Figure 19.5 Machining analysis from group-tech matrix. (Source: BIG Archives.)
Work-Flow Analysis
Just like when we analyze assembly operators, we can use the same tools (including video) for analyzing machine operators. We record each step the operator performs (with the operator present) and then look for ideas for improvement (Figures 19.6 and 19.7). While one can use the WFA for a machining cell, we generally use the ten-cycle analysis tool (Figure 19.8); but we don’t always do all ten cycles. Sometimes we do less and sometimes more. This is because most of the time where people are interacting with machines we are unloading, loading, and then cycling the machine. Since this time is man versus machine time, we need to take the labor into account to determine the total labor time (TLT).

Figure 19.6 WFA with Omits. (Source: BIG Archives.)

Figure 19.7 Example of a WFA for an operator and machine. (Source: BIG Archives.)

Figure 19.8 Ten-cycle analysis example. (Source: BIG Archives.)
Ten-Cycle Analysis and Variation
In Figure 19.9, we see medium to high variation across each step. The first questions we ask are:

Figure 19.9 Ten-cycle analysis: automated line. (Source: BIG Archives.)
■ Have the operators been trained properly in the standard work and are they proficient in the standard work or still learning?
■ If they are trained and proficient—then are they following the standard work? A review of the video analysis compared to the standard work will reveal this.
■ If they are trained, proficient and following the standard work then the standard deviation is a result of some other problem in the process. It could be man, method, machines, or materials.
In the short term we will use bumping to offset the variation where possible. If the layout does not allow bumping for some reason, then these become pure station-balanced operations and/or isolated islands. We would then have to add WIP in-between the operators to buffer the process until the variation can be addressed. Line balancing is always managed using some percentage of people and/or materials (WIP).
Part-Production Capacity Sheet
Once we have the process (product)-flow analysis (PFA) and workflow analysis (WFA) or ten-cycle analysis complete, we can create a part-production capacity sheet (PPCS). We reviewed this tool in an earlier chapter. This, along with the setup times and lot size, will give us the capacity for each machine and the overall process for the particular part we are following. In some cases, we will need a PPCS for each part, part type, or family of parts.
Yamazumi Board
The Yamazumi board has different uses and varies widely by company. In general, it visually displays the load on each machine or machining center compared to the available time (Figure 19.10). Sometimes it is used to compare cycle times for operations to the TT. This board breaks down process steps in time slices indicating value-added, non-value-added, periodic work, setup/change over time, etc.

Figure 19.10 Yamazumi board showing loading on machines or operations. Sometimes used for station-balancing operations. (Source: Courtesy of MarquipWardUnited, a division of Berry-Wehmiller, Inc.)
Setup Reduction
Once again, we don’t know of any machine shop that cannot benefit from setup reduction. Many times the group-tech matrix will help us reduce and sometimes eliminate setups, due to the families of parts we are able to put together. By creating families of parts, we can many times then load all of the tools in the carousel for that family, thus eliminating the need for changeover. The best place to start in any machine shop is with the most challenging setup or the most frequent type of setup you perform daily or weekly.
Cross-Training
The next major obstacle we run into is cross-training. Too often, people are trained and are specialized in one machine or one area or type of machine. When we put the machines together, we need machinists who can run every machine. They don’t necessarily have to be able to set up or program each machine but they have to be able to run them and be able to program tool offsets if required.
Scheduling to Minimize Setups
This involves lining up the jobs (work orders) in the best order to minimize the setup changes. Most shops do this already because it seems like common sense. However, many times it is not followed and most of the time it is due to external forces. For instance, management wants a part stopped and another part started because of a hot customer request. This unexpected, yet many times common, type of interruption can result in very large changeover times. The other difficulty is when we start reducing lot sizes, we increase the number of setups. Remember, the lesson learned was not to reduce your lot sizes until you have reduced your setup times.
Moving Operations in Line
When possible, we should move any operations performed off-line (in another area) into the machining (or assembly) line. Some good examples of these types of operations are painting or welding. We would normally use a point-to-point diagram and/or a process-flow diagram to determine the proper placement of the operations in the line.
Why Move Away from Toolboxes?
What is the problem with toolboxes in machining? The same problem exists in machining as it does in assembly. Toolboxes collect stuff. By their very nature, they create waste, and with some exceptions, most are a mess. This means there is a lot of searching required to find the right tools and many times it requires a trip to someone else’s toolbox to find the right tool or look around at every station to see who took your tool. The tools should be company owned. There are many reasons for this, one of which is that in some cases operators have modified the tool on their own and this information gets lost with them when they leave. Another is the tool boxes get locked up after the shift. When the next shift comes in, if a tool breaks or they need another tool, they don’t have access to one and the work stops.
Tooling Strategy
Keep the tools you use the closest to or at the machine. Generally, the Pareto rule comes into play: you use 20% or less of the tools 80% or more of the time. The balance of the tools should be somewhere in or near the cell and the ones you use the least may be further away. If there are some tools that are very large and won’t fit in the cell, then you may move the tools you use once a year, for instance, further away or in a centralized storage location.
Problems with Tool Cribs
Many companies experience the following problems with tools and fixture or tooling management.
■ Operators don’t put the tools back where they belong.
■ The tools disappear (or are stolen).
■ Calibration expires.
■ The tools need maintenance, but the operators wait until the start of the next job to point out the problem versus sending it to be repaired at the end of the previous job.
■ Operators can’t find the tooling.
■ Operators use the wrong tools and don’t follow the standards.
■ Tools occupy too much space.
■ Tools are not kept clean.
■ No backups of critical tooling.
■ No system of tracking tooling locations.
Vendor-Managed Tooling
There are many vendors now, especially with consumable-type tooling (i.e., drill bits, inserts) that will manage your tooling for you whether it be at POU or at a breadman or more central location (vendor-managed materials). Some systems are like vending machines (Figure 19.11) where you swipe your badge and then remove the tooling. A signal is sent back to the supplier so they immediately know what tooling to replace during their next delivery or milk run.

Figure 19.11 Vendor-management tooling in vending machines. (Source: BIG Archives.)
Place Machines Right Next to Each Other
Our ultimate goal with machines is to put them as close together as humanly possible (Figure 19.12). When we visited world-class companies in Japan, all of their chip conveyors were located in the rear. Why is this not so in the United States?

Figure 19.12 Machining layout with machines as close together as possible. (Courtesy of Ancon Gear). (Source: BIG Archives.)
Get Rid of Tables Wherever Possible
This is a difficult challenge for most machinists. Why? Because we want our table! But if you keep a real open mind, do you really need it or just want it? For the current batch-type process, you may really need it; but as we convert to flow, the table will just get in the way.
Need for Latest Drawings and Programs
It goes without saying that we need a process to ensure we always have the latest drawings, setup sheets, or work instructions available. We also need to make sure that we update these documents as we improve methods or processes for the equipment or work product. We can’t tell you how many times we have found machinists working with out-of-date documentation.
Don’t Try to Move Subassemblies Out of the Line If Possible
Many times, not only non-Lean thinkers but Lean experts feel they must move subassemblies out of line to reduce their cycle time or improve their metrics in some way for the final assembly line. However, we argue against this. What is the benefit of taking the assembly off-line? One still has to pay the labor for it, and once it is off-line, we immediately create the need for an inventory buffer of some type to link the processes together. Often, these off-line subassemblies result in a person(s) in a separate area performing the task on an isolated island where we can no longer recoup the excess fractional labor. These off-line operations normally become batched up and overproduce! Why? Because they can! It is best to work to include all operations on the line or as many as possible to the extent it makes sense. Initially we may not have a choice.
Automated Lines
The same BASICS analysis tools, process flow, work flow, and setup analysis can all be performed on automated lines and machines (Figure 19.13). For example, on a bottling line, we can follow the bottle from when it enters the fill line, or even from receiving, until it ships from the plant. For WFA, the operator will either be a person who is monitoring the equipment in case there is a problem or it breaks down or who may be making adjustments to the equipment resulting in unplanned downtime (Figure 19.14). In some cases, the operator will be the robot itself. We have utilized these tools to free up robots the same way we free up people. In the following example, the ten-cycle analysis prompts several questions regarding the function of the line. Many times the opportunity in automated lines and factories, in addition to using these analysis tools, is to see if opportunities exist in:

Figure 19.13 What is the paced conveyor doing in this analysis? (Source: BIG Archives.)

Figure 19.14 Simple downtime-analysis sheet. (Source: BIG Archives.)
■ Jidoka
■ Visual management
■ TPM
■ Inventory reduction between lines
■ Setup reduction
■ Unplanned downtime tracking and reduction
■ Overall equipment effectiveness (OEE)
■ Standard WIP in process
Paced Cells
We are in the machining section of the book because in this case an assembly line is running on a big machine. It is sort of a hybrid. In essence, these lines are collections of isolated islands full of fractional labor. Because the operators are stationery, they are given chairs and are surrounded by equipment, parts, and clutter (Figure 19.15). Why are these lines so popular? Well, when converting from batch to flow, these lines create huge improvements over the batch world: less space, higher productivity, less WIP, more organized workplace, etc. But when you use the Lean tools to analyze the line, you still find tremendous waste just waiting to be removed. The line is called a paced cell because the conveyor moves the pallets that contain the parts and the operators add parts to the products on the pallets. They may add them directly or build a subassembly, which then goes on the part. Sometimes they actually remove the part from the pallet to their workstation, assemble the subassembly to the product, and put it back on the pallet.

Figure 19.15 Paced conveyor lines, but operators can stop the line anytime, so is it really paced? (Source: BIG Archives.)
Paced Lines Are Not Bad!
Now you may think we don’t like paced lines but this is not the case. Our goal is to get to paced lines but only where it makes sense. Any assembly line that is really a paced line will generally run faster than having people manually move the products from station to station. However, it is a big investment. One also has to make sure there is no room for extra WIP in the line.
Advantages of Paced Lines:
■ With the help of pitch marks, you visually know if you are ahead or behind TT.
■ Mistake-proofing and poka yoke can be built in to the product.
■ You can run to a true cycle time.
■ Can be set up for flexing and bumping.
Challenges:
■ Line balancing.
■ Keeping operators from slowing down the line.
■ Isolated islands are easily created.
■ Don’t handle rework or major line stoppages well.
________