
Monitoring – A Critical Ability in Resilience Engineering
The prologue to this book outlines the broad defining characteristics – the four cornerstones – of Resilience Engineering. One of these is monitoring. Every organisation concerned with safety has one or more metrics that are used to judge whether the levels of safety in the organisation are acceptable. Using a common definition of safety, the organisation needs to know if it is ‘free from unacceptable risk’. This metric is often the number or rate of accidents or injuries (or deaths) over some period of time or the time between events as shown by Figure 5.1.
While such measures may provide some assurance that safety has not been entirely out of control in the past, they are of little use when considering how to manage safety in the future and could even be harmful. First, top-level outcomes such as accidents or serious injuries have a large component of chance in their occurrence. Second, the events do not, themselves, provide information about causes and fixes. Finally, when the measures show a period of good performance, complacency starts to set in. Indeed, when a period of successful performance approaches a record, there can be tremendous pressure for people not to report possibly marginal occurrences and somehow ‘lose the game’.
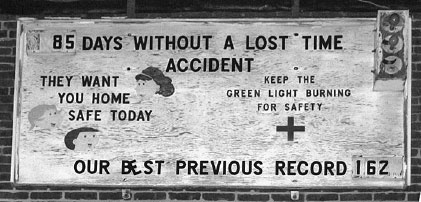
Figure 5.1 Typical industrial safety sign (Photo © Sheena Chi, 2009)
But measures like that shown in Figure 5.1 are of little or no use in preparing for foreseen and unforeseen adversity or in managing the proactive processes by which safe and efficient performance is achieved. Since the environment of the organisation and its own internal processes are both dynamic, last year’s safety performance (or last month’s or yesterday’s) are at best weak indications of how today’s and tomorrow’s will be.
The Role of Indicators in Measurement
Measurement of the processes is an essential part of any organisation. The phrase, ‘You can’t manage what you don’t measure’ is an old management adage and appears in more websites that this author could count. However, in developing Resilience Engineering, the role of indicators is on the one hand crucial and on the other also an area that is underdeveloped relative to other aspects of measurement.
While there are many metaphors for how resilience applies to the management of organisations, one that is useful in the context of measures and indicators is the classical control theory model shown in Figure 5.2. The activities in the organisation are represented in the box labelled ‘processes’. These processes comprise the main activities in the organisation, such as production (in its various forms), coordination, finance, etc. They accomplish a variety of outputs that include physical production, safety, economic performance, etc. In the classical control model, these outputs are evaluated by means of a ‘Model of the Processes’ that via a controller adjusts the inputs to the processes guided by the requirements. This set of activities takes place within an environment (the public community, regulatory bodies, the financial and business environment, etc.). The requirements may be set within the organisation itself or by the environment (such as public safety goals, financial or work demands). Some of the outputs likewise go to the environment, like work products, financial matters (including taxes and interest on loans), etc., while some are internal (record keeping, retained profits, etc.).
The management of safety has traditionally followed the classic control theory model. Changes in safety practices and policies usually do not occur unless there is a change in the ‘safety output’ of the process – a loss of life, a serious injury, an explosion or crash or some other serious event. Then the management reviews the event through using its ‘model’ of the processes, makes some changes (putting in place a new safety policy or a new barrier perhaps) and let the business continue. The sign shown in Figure 5.1, for instance, reflects the thinking that simply making the output more visible to the workforce will change the processes by reminding them that worker safety is an outcome.

Figure 5.2 Classic control theory model
Resilience Engineering emphasises the need to be proactive in the management of core processes, including but not limited to safety, and to anticipate (and hopefully forestall) major changes in safety and other critical performance domains. Simply relying on outcomes as implied in Figure 5.2 will not suffice. In order to be proactive, more information is required, as shown in Figure 5.3. In this version, data are gathered not just from the outputs of the processes but from intermediate activities along the way, as shown by some of the dashed lines from the processes to the model. These data we will refer to as indicators. Their purpose is to provide information about what is happening in intermediate stages of the processes before outcomes change significantly, so that management can take actions to forestall the adverse outcomes.
Indicators can also be developed for the changes in the environment that may impact the system. Obvious examples would be to sense upcoming changes in the financial environment that may affect the processes (e.g., changes in the cost of raw materials, changes in customer requirements, a tightening of credit). Anticipating changes in the environment and making anticipatory changes in the processes to accommodate them are an important part of the long-term stability of any organisation.

Figure 5.3 Control theory model with indicators
Westrum (1999) has pointed out that using ‘faint signals’ often is a critical feature of resilient organisations. Faint signals are early indications of problems that start to occur in a project or hints of coming trouble in a process. One example could be an increased number of questioning-type calls from a customer about how things are going. Nothing explicit, but often after a problem has been uncovered, they would be recognised as early warnings.
Selection and Basis for Indicators
Wreathall (2009) proposed that ‘indicators are proxy measures for items identified as important in the underlying model(s) of safety. As such they are uncertain and often only distantly connected to idealised measures that rarely are available in practice’.
In practice, it is rare to find explicit models that provide a formal basis for identifying measures. However, knowledge often exists about relationships that are important to safety and that can be used to create working models. In the study of fatigue (Chapter 6), a set of relationships between safety, fatigue and its underlying mechanisms was articulated (if not formally presented as a model of safety) and those relationships were used to create metrics for monitoring the risks from fatigue. In their paper, the authors acknowledge that it is not yet possible to create a fully developed model but that sufficient information exists to create a useful basis for management of the processes of concern.
In the study of cognitive strategies in air traffic control (Chapter 8), the T2EAM performance model was developed based on existing research related to cognitive strategies in similar kinds of tasks, though often in other industries. This performance model provided the basis for developing ways to measure.
As a practical matter, several studies have used ad hoc methods for selecting indicators. As described in Chapter 7, the critical factors associated with an outage indicating a potential to be problematic were identified through brainstorming workshops with experienced project managers and others often involved in supporting projects when they get into trouble. In other words, even though these were based on learning from events in the past, they were considered to be sufficiently robust that they would remain effective for the next cycles of outages (1–2 years), at least from the perspective of testing the concept. Similarly in work described by Wreathall (2006), the selection of indicators was based on factors most frequently associated with problems in human performance issues in the nuclear industry’s collective experience.
One point worthy of note in the experiences referred to above is that while the initial search for factors related to performance began by looking for factors that contributed to problems in performance, the development of these measures uncovered factors that were critical to the success of the system. For example, in the system reported by Wreathall (2006), the data gathered for particular parameters indicated a consistent positive pattern. When discussions were held with the reporting staff, they indicated that these were important factors to ensure successful performance.
Wreathall and Jones (2000) proposed a set of desired characteristics to guide the selection of indicators. Preferred indicators are as follows (in decreasing order of priority):
• Objective: They are based on observable and non-manipulatable sources.
• Quantitative: They are measurable and can identify when changes in performance occur.
• Available: They can be obtained from existing data.
• Simple to understand/represent worthy goals/possess face validity: It has been found in the author’s experience that once indicators have been established, they become pursued as goals in themselves. If the indicators in themselves represent something worthy, this pursuit helps the organisation’s performance.
• Related to/compatible with other programs. In any modern enterprise, data abound in excess. It is generally undesirable to add an additional data generation program to existing activities.
The experience to date shows that there are a variety of different kinds of measures. The examples of Chapter 6, related to the Fatigue Risk Index model principally involve measures directly associated with objective items such as duties starting early in the morning (before 06:00), working periods of greater than 5 days and the numbers of flights. In the T2EAM model (Chapter 8), the measures are scores associated with the styles of behaviour used by the controllers as observed by the various subject matter experts. In Chapter 7, a variety of different measures are used; some are objective scores like the amount of emergent (unplanned) work, prolonged duration of work, personnel turnover and the existence of special conditions (extreme weather, occurrence of major holidays, etc.). Others include more subjective judgements like a drop in moral, and a reduction in the quality (as well as quantity) of site-to-HQ communications such as perfunctory status reports. Thus, within these three example studies, almost the entire spectrum of possible measures is seen as providing indicators.
Leading and Lagging Indicators
In discussions about using indicators, much is made of whether particular indicators are leading or lagging, almost as if this is a theological issue. The basic issue of which indicators are leading or lagging is a pragmatic one. Consider the arrangement shown in Figure 5.3. The indicators are called leading if they provide information such that control actions can be taken in time to forestall an unacceptable change in one or more of the core outputs (e.g., safety-, financial- or quality-related), or at least the management can anticipate and mitigate the adverse changes – core behaviours of resilient organisations. Indicators are called lagging if they reflect changes in core outputs that have occurred. The parameter shown in the sign in Figure 5.1 is an example of a lagging indicator. It reflects the past performance in managing safety.
However, the issue is a little more complex when there are multiple time-scales and levels for control actions. Sometimes actions may be taken quickly at a local level. For example, increasing the staffing temporarily in a production department to cope safely and reliably with a sudden upsurge in demand for a product may be decided within hours or days of an indication of the upcoming demand. However, there may be a need to change the total employment in the company or redesign the processes to accommodate extended periods of new demands. A lagging indicator related to the short-term staffing change (e.g., numbers of workers suffering from fatigue-related injuries) could act as a leading indicator of the need for systemic changes. Thus the terms leading and lagging apply both to the type and level (local or system-wide for example) of control action and the timing of the actions.
This classification is truly pragmatic and many happy hours can be spent debating with colleagues much deeper interpretations. Recently a special issue of Safety Science was dedicated to a discussion of indicators and part of which was preoccupied with just this question (e.g., Hopkins, 2009a, 2009b; Hale, 2009; Wreathall, 2009 among others). The purpose in each case is, of course, to allow the management of the system or organisation to take actions that prevent adverse outcomes in the event of challenges.